Range Finder [UAlgo]🔶 Description:
The "Range Finder " indicator aims at identifying and visualizing price ranges within a specified number of candles. By utilizing the Average True Range (ATR) indicator and Simple Moving Average (SMA), it detects potential breakout conditions and tracks consecutive candles that remain within the breakout range. This indicator offers flexibility by allowing users to customize settings such as range length, method for determining range breaks (based on either candle close or wick), and visualization options for displaying range breaks on the chart.
🔶 Key Features
Identifying Ranges: The Range Finder automatically adapts to the market by continuously evaluating the Average True Range (ATR) and its Simple Moving Average (SMA). This helps in dynamically adjusting the range based on market volatility.
Range Length: Users can specify the number of candles to be used for constructing the range via the "Range Length" input setting. This allows for customization based on trading strategies and preferences.
Range Break Method: The indicator offers the flexibility to choose between two methods for identifying range breaks. Users can select between "Close" or "Wick" based on their preference for using the closing price or the highs and lows (including wicks) of candles for defining the breakout.
Show Range Breaks: This option enables visual representation of range breaks on the chart. When activated, labels with the letter "B" will appear at the breakout point, colored according to the breakout direction (upward breakouts in the chosen up range color and downward breakouts in the chosen down range color).
Range Color Customization: The indicator provides the ability to personalize the visual appearance of the range by selecting preferred colors for ranges indicating potential upward and downward breakouts.
🔶 Disclaimer
It's important to understand that the Range Finder indicator is intended for informational purposes only and should not be solely relied upon for making trading decisions. Trading financial instruments involves inherent risks, and past performance is not necessarily indicative of future results.
Simple Moving Average (SMA)

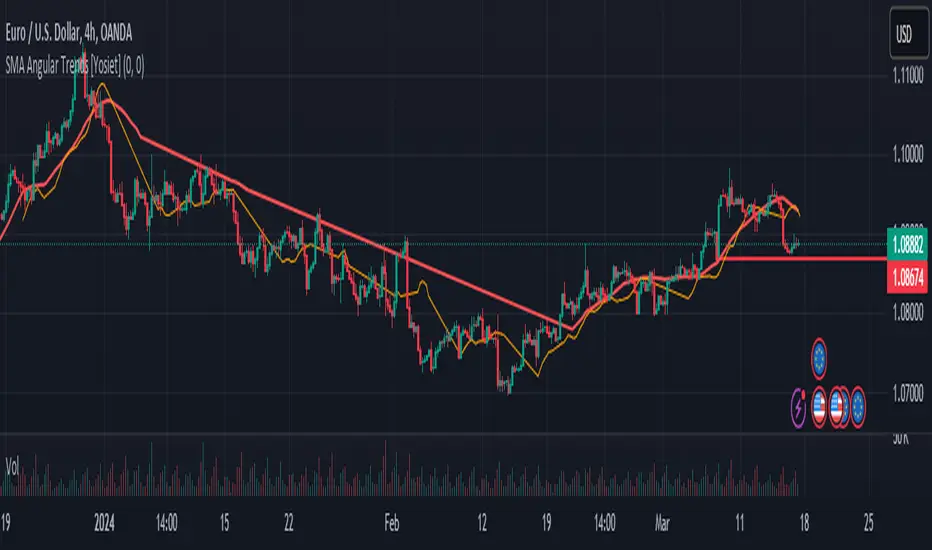
SMA Angular Trends [Yosiet]This indicator uses two specific SMA configurations conditioned by an angular slope that is always repeated in trend markets, which are usually beneficial in swing or long-term strategies.
SETTINGS
- Fast Angle Threshold: Is the value in degrees for the condition of the fast sma
- Slow Angle Threshold: Is the value in degrees for the condition of the slow sma
- Linear Mode: When is active, it shows the sma curves only when the condition is satisfied. When is inactive, it shows color of the trends
HOW TO USE
This indicator it helps to see clearly the trends and the oppotunities to entry/exit in breakouts and retests
WHY THOSE SMAs
The SMAs are sma(7, low) and sma(30, high), those setups came from analyze several others indicators with machine learning searching for convergence points in 2018.
THOUGHTS
This indicator only pretends to help traders to take decissions with extra data confirmation
IMPROVEMENTS
You can comment your ideas and sugestions to improve this indicator
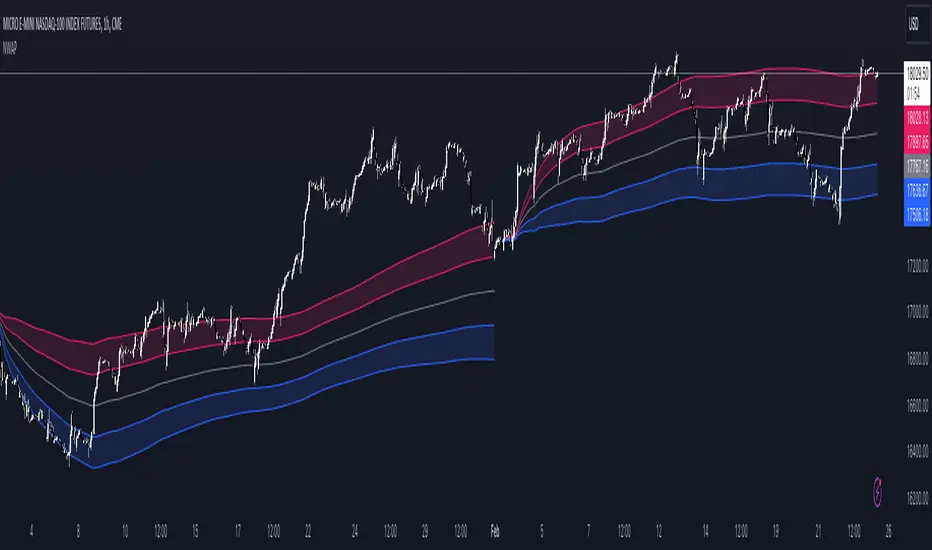
Normal Weighted Average PriceIntroducing the "Normal Weighted Average Price" (NWAP) by OmegaTools. This innovative script refines the traditional concept of VWAP by eliminating volume from the equation, offering a unique perspective on price movements and market trends.
The NWAP script is meticulously crafted to provide traders with a straightforward yet powerful tool for analyzing price action. By focusing solely on price data, the NWAP offers a clear, volume-independent view of the market's average price, augmented with bands that denote varying levels of price deviation.
Key Features:
NWAP Core: At the heart of this script is the Normal Weighted Average Price line, offering a pure, volume-excluded average price over your chosen timeframe.
Dynamic Bands: Includes upper and lower bands, plus extreme levels, calculated using the standard deviation from the NWAP. These bands help identify potential overbought and oversold conditions.
Customizable Timeframe: Whether you're a day trader or a long-term investor, the NWAP script allows you to set your preferred analysis period, ensuring relevance to your trading strategy.
Bands Width Adjustment: Tailor the width of the deviation bands with a simple multiplier to fit your risk tolerance and trading style.
Visual Zones: The script visually demarcates premium and discount zones between the bands, aiding in quick assessment of market conditions.
Usage Tips:
Ideal for traders seeking a volume-neutral method to gauge market sentiment and potential reversal points.
Use the NWAP and its bands to refine entry and exit points, especially in markets where volume data may be less reliable or skewed.
Combine with other technical indicators for a comprehensive trading strategy.
TrendFusion Pro (BETA)The TrendFusion Pro (BETA) combines advanced trend analysis, dynamic RSI insights, and price target prediction in one comprehensive tool. Here's how to customize its settings to optimize your trading strategy:
Candle Style:
Options: Traditional Candle, Super Trend Heiken Ashi Candle
Description: Select your preferred candle visualization. Traditional candles are best for classic chart analysis, while Super Trend Heiken Ashi candles help in identifying trends by smoothing price movements.
How to Use: Choose "Super Trend Heiken Ashi Candle" for trend following strategies or "Traditional Candle" for patterns and reversal strategies.
This setting allows you to match the candle visualization to your trading strategy, enhancing chart clarity and trend recognition.
Trend Analysis Settings:
Trend Strength & Smoothing Period: Adjust these to define what constitutes a trend on your chart, allowing for customization based on volatility and your trading timeframe.
How to Use: Increase the trend strength for longer-term trends or decrease it for short-term movements. Adjust the smoothing period based on the asset's volatility.
Fine-tuning these parameters helps in tailoring the trend analysis to your specific market approach, enhancing the accuracy of trend signals.
RSI Settings:
RSI Length, Overbought/Oversold Levels: Customize the RSI to fit your risk tolerance and strategy. Altering these parameters changes the frequency and sensitivity of overbought/oversold signals.
How to Use: Set your RSI length and thresholds based on the asset's historical performance and your trading strategy.
Adjusting the RSI settings allows for a more nuanced approach to momentum analysis, providing clearer signals for entry and exit points.
Price Target Interest (%):
Description: Define a percentage to calculate potential upward and downward price targets from the current price.
How to Use: Use this setting to identify potential profit targets or stop-loss levels based on your risk-reward ratio.
This feature offers a dynamic method for setting realistic and strategic price targets, aiding in risk management and profit maximization.
Multi-Timeframe Trend Analysis Table:
Description: Displays the trend direction across multiple timeframes, providing a comprehensive view of the market's momentum.
How to Use: Enable this table to align your trades with the broader market trend for higher success rates.
Understanding market direction across different timeframes can significantly improve the timing and effectiveness of your trading decisions.
Previous Day High, Low, and Average Lines:
Description: Visual markers for the previous day's high, low, and average prices.
How to Use: These markers can be used as key levels for breakout, reversal, or continuation strategies.
Incorporating these levels into your analysis provides historical context, offering critical support and resistance zones for your trades.
Signal Visibility:
Long/Short Signals, Exit Signals, RSI Signals: Customize which signals are displayed on your chart to match your trading strategy and reduce clutter.
How to Use: Enable the signals that align with your trading strategy, whether it be trend following, reversal trading, or momentum trading.
Selectively displaying signals helps in focusing on the most relevant trading opportunities, reducing distractions and improving decision-making.
Conclusion:
The TrendFusion Pro (BETA) is designed to offer traders a comprehensive, intuitive, and customizable tool for market analysis. By understanding and utilizing these settings, traders can tailor the tool to meet their specific needs, enhancing their ability to make informed trading decisions in different market conditions. Experiment with different settings in a demo account to find the optimal configuration for your trading approach.

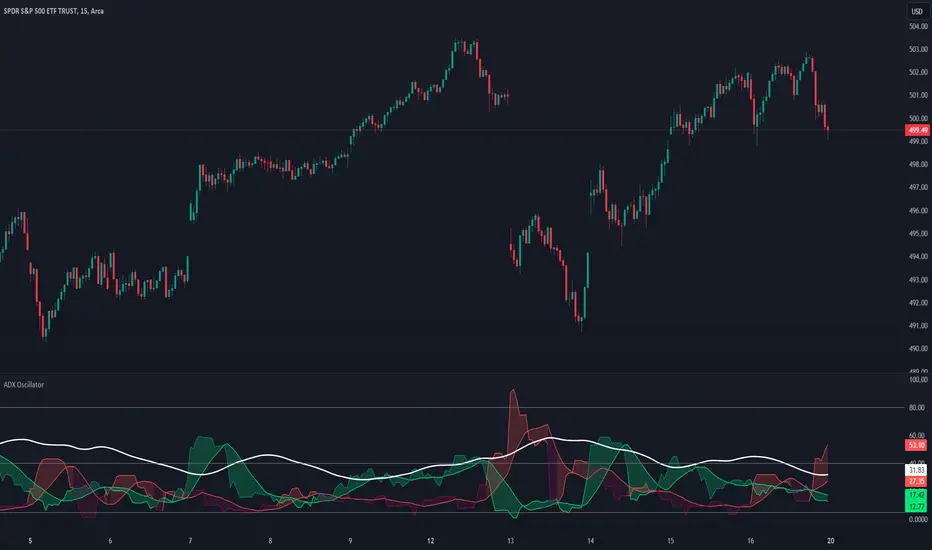
ADX Oscillator @shrilssThis Indicator calculates the Average Directional Index (ADX), a popular indicator used to quantify the strength of a trend. Additionally, it computes the Positive Directional Index (+DI) and Negative Directional Index (-DI), which measure the strength of upward and downward price movements respectively.
What sets this script apart is its enhanced ADX calculations. It incorporates Moving Averages (MAs) of the +DI and -DI to offer a smoother representation of trend direction. By averaging these directional indices over a specified period, it aims to filter out noise and provide clearer signals of trend strength.
Traders have the flexibility to visualize the traditional ADX alongside the enhanced ADX oscillator. The script also highlights potential buying and selling opportunities based on crossover events between the directional indices and the ADX, helping traders identify optimal entry and exit points.
With customizable parameters such as the length of the Directional Movement (DM), ADX, and MA periods, this script empowers traders to adapt the indicator to different market conditions and timeframes.
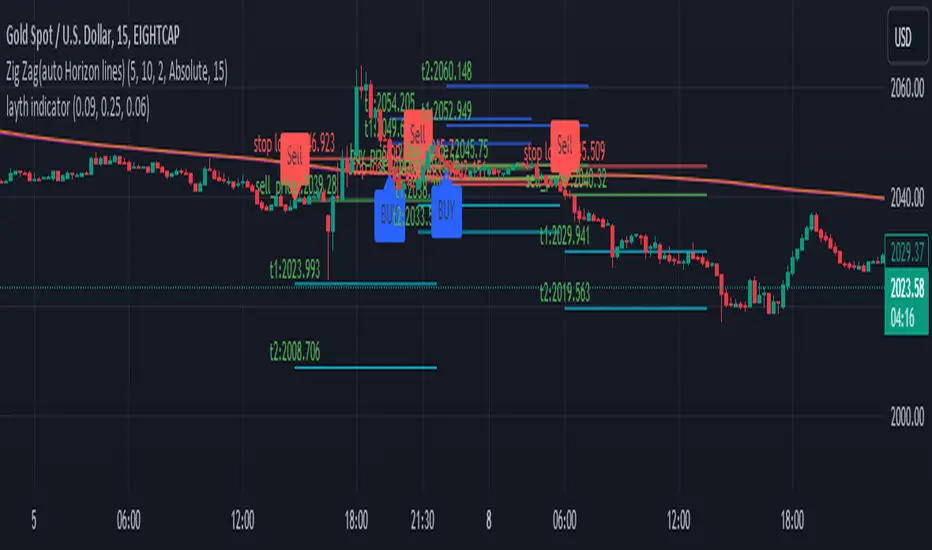
LYFX-GOLD-15MIndicator Operation Method:
The indicator provides a buy signal when the price stabilizes above the moving averages. It should be close to the averages at the same time to ensure a close stop loss.
When the conditions are met, a long trade is opened, and the buy signal appears on the indicator. The stop loss is placed with the red line, and the targets are indicated with the blue balloons. Usually, the first target is twice the stop loss, and the second target is three times the stop loss.
This indicator is one of the most powerful indicators for monitoring price explosions in gold.
For clarification, this indicator is used (according to its default settings) exclusively for gold and only on the 15-minute timeframe. The indicator is created by Mr. Layth Al-Muhandis:
The indicator provides a very close stop loss compared to the first and second targets. I recommend adhering strictly to the stop loss and securing the trade after achieving profits.
This is a simple explanation of how the indicator works.
طريقة عمل المؤشر:
يوفر المؤشر إشارة شراء عند استقرار السعر فوق المتوسطات المتحركة. يجب أن يكون السعر قريبًا من المتوسطات في نفس الوقت لضمان وجود استوب لوس قريب.
عند تحقيق الشروط، يتم فتح صفقة شراء، وتظهر إشارة الشراء على المؤشر. يتم وضع الاستوب لوس بالخط الأحمر، وتوضح البالونات الزرقاء الأهداف. عادةً، يكون الهدف الأول ضعف الاستوب لوس، والهدف الثاني ثلاثة أضعاف الاستوب.
هذا المؤشر من بين أقوى المؤشرات لرصد انفجارات الأسعار في الذهب.
للتنويه، يُستخدم هذا المؤشر (وفقًا لإعداداته الافتراضية) حصريًا للذهب وعلى فاصل زمني 15 دقيقة فقط. تم إنشاء المؤشر بواسطة السيد ليث المهندس.
يوفر المؤشر استوب لوس قريب جداً مقارنة بالهدف الأول والهدف الثاني. أنصح بالالتزام الصارم بالاستوب لوس وتأمين الصفقة بعد تحقيق الأرباح.
Multi MAs mit LabelA MA (Moving Average) is useful to identify a trend of an assets. The TradingView builtin indicator "Exponential Moving Average" is useful, but limited in some aspects:
Bound to the active timeframe (e.g. h1)
One MA per indicator instance. Makes it confusing when using multiple
In reality to want to have multiple MAs with different types (EMA, SMA), length and timeframes on your chart to identify trading opportunities. As an example you can use the daily EMA12 and EMA21 to identify the trend and EMA200 on the h4 to enter a trade. That's what this script is used for.
The provided script is an extension to the indicator powered by chipmonk (link to profile below). The original script let you add up to 8 EMAs that can be bound to any timeframe and length. The timeframe and length is displayed on the chart next to EMA.
Unfortunately you can only add EMAs (Exponential Moving Averages) and no SMAs (Simple Moving Averages). That's why the script was extended. You can now choose the type (EMA or SMA) for up to 8 MAs.
Links
Profile of chipmonk
Indicator by chipmonk

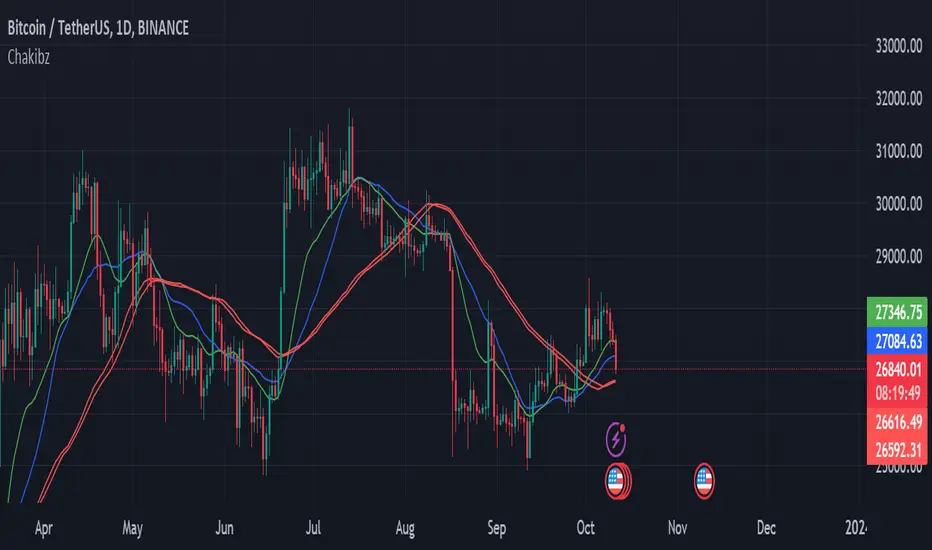
Trend Change IndicatorThe Trend Change Indicator is an all-in-one, user-friendly trend-following tool designed to identify bullish and bearish trends in asset prices. It features adjustable input values and a built-in alert system that promptly notifies investors of potential shifts in both short-term and long-term price trends. This alert system is crucial for helping less active investors correctly position themselves ahead of major trend shifts and assists in risk management after a trend is established. It's important to note that this indicator is most effective with assets that historically exhibit strong trends.
At the heart of this tool is the interaction between the 30-day and 60-day Exponential Moving Averages (EMA). A bullish trend is indicated in green when the 30-day EMA is above the 60-day EMA, while a bearish trend is signaled in red when the 30-day EMA is below the 60-day EMA. The appearance of gray alerts users to potential shifts in the current trend as the EMAs converge, falling below the Average True Range (ATR) safety margin. This analysis is conducted across both hourly and daily timeframes, with the 4-hour timeframe providing early signals for daily trend changes. The band visually represents the interaction between the daily EMAs and is also displayed in the second row of the table, with the first row showing the same EMA interaction on the 4-hour timeframe.
This indicator also includes a 140-day (20-week) Simple Moving Average (SMA), visually represented by a line with predictive dots. This feature significantly enhances the investor's ability to understand long-term trends in asset prices, offering forward-looking insights by projecting the SMA value 10 days into the future. The value of this forecast lies in interpreting the slope of the dots; upward trending dots suggest a bullish underlying trend, while downward trending dots indicate a bearish trend. Generally, prices above the SMA signal bullishness, and prices below indicate bearishness.
In summary, the Trend Change Indicator is a comprehensive solution for identifying price trends and managing risk. Its intuitive, color-coded design makes it an indispensable tool for traders and investors who aim to be well-positioned ahead of trend shifts and manage risk once a trend has been established. While it has proven historically valuable in trending markets such as cryptocurrencies, tech stocks, and commodities, it is advisable to use this indicator in conjunction with other technical analysis tools for a more comprehensive and well-rounded decision-making process.

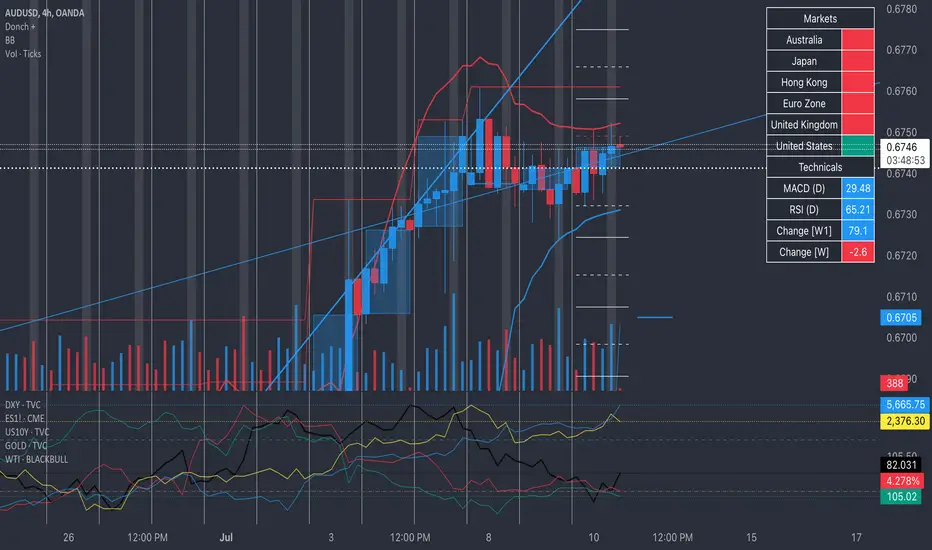
Donch +This is an indicator I made for trading Forex to help me see the bigger picture. It is meant for the 30min TF and it includes the following:
- 20 Day High | Low
- 5 Day High | Low
- 4 Hour High | L
- 4 Hour Bars
- Daily Simple Moving Averages
- Weekly Trend Line (connects last week's open to this week's open)
- Daily Trend Line (connects yesterday's open to today's open)
- Horizontal Lines at 0.25% increments (these can be useful for S/R... currency rarely moves more than 1% in a day).
- A table with information about what markets are open and technicals on the pair I am looking at.
- A slight white background fill to highlight the first hour of the US session. Knowing what session you are in is very important in day trading (in my opinion). This lets me go back and see how the US has been trading.
To keep the chart from being "too busy" (it's plenty busy lol), I use a step line and focus on 30min closes. I reference the white lines above and below closes for 4hr highs/lows and don't bother with looking at the high/low of every 30 min bar.
For the table, you will see bright green by the country for the first hour of trading in that session. It will turn to a regular green after the first hour. It will turn yellow the final hour of that session. It will turn red if that market is closed.
You can select from the settings 'inputs' tab to enable/disable any parts of this you don't find useful, for the table you'd go over to the 'style' tab and unselect it there. For example, I don't use the labels regularly. If I were to get confused about what a moving average was or something, I'd enable the labels and clarify.
Currency doesn't like to break out and likes to be stable. Keeping this in mind, you can see how the 20 day high / low and the 5 day high / low act as support and resistance (unless there is a news event to break out on.
I have alerts for the following:
- Price update every hour
- Crossing a trend line
- Crossing a moving average
- Crossing a 0.25% increment
- Making a new 4 hour, 5 day, or 20 day high/low
To enable the alerts, you would click add alert, select the indicator, and click save. To work properly, you'd want to be on the 30min TF before doing this. You will get a lot of alerts (personally I like this because I like to see how currency moves throughout the day). You will get one notification per 30 minutes but not more than that for the particular alert.
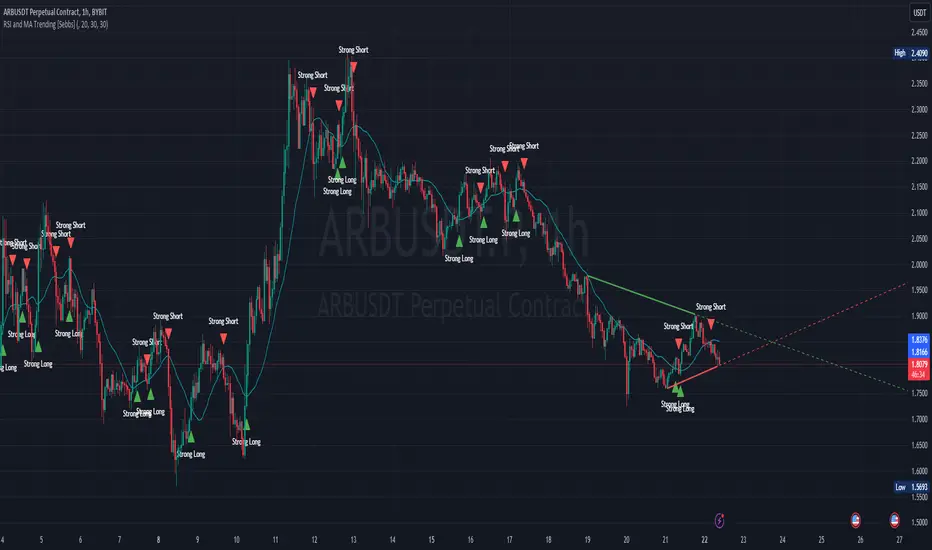
RSI and MA Trending [Sebbs]A simple indicator based on RSI strength and a custom SMA trendline.
RSI
RSI Strength is determined by a baseline.
The baseline is the 200 bar RSI
The current RSI value is compared to the Baseline and determines the current trend.
This Use of the RSI is unique because the strength indication point is not a static number (eg: 50) and the long term strength will trend up in a Bullish market.
This causes the reversal point of the strength to become much closer to the top of the waves end point.
SMA
The default SMA is a 20 bar length but is adjustable to suit any timeframe or chart.
The SMA determines the trend direction.
SIGNALS
When both are showing strength it will give a buy signal.
When both are showing weakness it will show a sell signal.
STRATEGY
I personally use 15 Minute chart and 20 bar SMA.
This method can have a close stop as it uses strength as an entry condition.
If the strength drops exit the trade.
For example, a 15 minute entry I would set a single candle stop as if that candle is taken back, the trade is no good.
The best entries are when a trendline breaks and strength changes direction.
FILTERS
Additional filters are provided such as other SMAs and Heikin Ashi bars for entry requirements.
DIVERGENCES
The Overlay also shows Divergence lines which use my own unique calculations.
The pivot low/high function provided by Pine Script requires a set number of bars to pass prior to locating a swing low/high.
This can mean large moves have occurred prior to a swing low having passed if the lookback range was set to five bars (5).
5 bars on a 2 hour chart is a long time and large moves may be missed.
As I don't use these functions, there is no requirement for a set number of bars to have passed prior to swing low/high positions to be identified.
This means it doesn't rely on a set number of bars to pass prior to finding a new pivot point.
* Code loops are a function which will check conditions in a range until a defined condition is met.
In this case a pivot low is a bar with no lower bars within 3 bars either side of the current checked bar.
Additional:
Lines will redraw and delete previous divergences to remove clutter on the indicator.
A table cells for alternate timeframe Stochastic RSI values so you don't need to swap between charts constantly.
RSI TABLE
A table is available for monitoring the RSI values of the current chart and a Higher Timeframe.
This helps keep track of which direction your should be looking for trades in.
This can be hidden in the indicator options.
Note
This indicator can not be open source due to a usage of a Private Library.
Average Percentage ChangeThis indicator computes the average percentage change between Simple Moving Averages (SMAs) of high and low prices over a specified lookback length.
The 'length' input determines the period for calculating the SMAs.
The resulting line, represented by 'AVG', displays the percentage change, indicating potential shifts or trends in price momentum.
Traders can use this indicator to identify periods of potential volatility or significant price movements.
Note for Traders:
- Adjust the 'length' input for different analysis periods.
- Watch for crossovers or divergences between the AVG line and price action for potential trading signals.
- Combine with other indicators or analysis techniques for comprehensive market insights.
Originality and Usefulness:
This script provides a unique perspective by evaluating the average percentage change, derived from SMAs of high and low prices, offering traders insights into potential price momentum shifts.

Triple Moving Averages (Gradient, Alarm & Multi TF)Triple Moving Averages
Features:
- 7 Different MA's (RMA, SMA, EMA, 'WMA', HMA, DEMA, EMA)
- Gradient coloring
- Multi timeframe
- Crossover alarm's and alarm delay function
- Forecasting (By removing the last bar in the MA period)
Moving Average to easely identify the trend and trend strength.
Gradient coloring and personal color preferences can be made.
Alert Delay System
When timing is essentially, this helps you get the alarm just in time.
Use it with the triggers ONLY ONCE PER BAR or ONLY ONCE. Then the alarm comes before the close, but you don't have to worry about it triggering just seconds after bar open :)
Default = 15m Recomended for 1h chart
Alarm's
Get the alarms before it's actually crossing or when it crosses
*This is not a selfmade indicator but simply merging from several indicators and added alert delay function and multi timeframe support
// Credits
- BigBitsIO Script : Scripting Tutorial 6 Triple Many Moving Averages Forecasting
- PineCoders Script : Color Gradient Framework PineCoders

Advanced Dynamic Threshold RSI [Elysian_Mind]Advanced Dynamic Threshold RSI Indicator
Overview
The Advanced Dynamic Threshold RSI Indicator is a powerful tool designed for traders seeking a unique approach to RSI-based signals. This indicator combines traditional RSI analysis with dynamic threshold calculation and optional Bollinger Bands to generate weighted buy and sell signals.
Features
Dynamic Thresholds: The indicator calculates dynamic thresholds based on market volatility, providing more adaptive signal generation.
Performance Analysis: Users can evaluate recent price performance to further refine signals. The script calculates the percentage change over a specified lookback period.
Bollinger Bands Integration: Optional integration of Bollinger Bands for additional confirmation and visualization of potential overbought or oversold conditions.
Customizable Settings: Traders can easily customize key parameters, including RSI length, SMA length, lookback bars, threshold multiplier, and Bollinger Bands parameters.
Weighted Signals: The script introduces a unique weighting mechanism for signals, reducing false positives and improving overall reliability.
Underlying Calculations and Methods
1. Dynamic Threshold Calculation:
The heart of the Advanced Dynamic Threshold RSI Indicator lies in its ability to dynamically calculate thresholds based on multiple timeframes. Let's delve into the technical details:
RSI Calculation:
For each specified timeframe (1-hour, 4-hour, 1-day, 1-week), the Relative Strength Index (RSI) is calculated using the standard 14-period formula.
SMA of RSI:
The Simple Moving Average (SMA) is applied to each RSI, resulting in the smoothing of RSI values. This smoothed RSI becomes the basis for dynamic threshold calculations.
Dynamic Adjustment:
The dynamically adjusted threshold for each timeframe is computed by adding a constant value (5 in this case) to the respective SMA of RSI. This dynamic adjustment ensures that the threshold reflects changing market conditions.
2. Weighted Signal System:
To enhance the precision of buy and sell signals, the script introduces a weighted signal system. Here's how it works technically:
Signal Weighting:
The script assigns weights to buy and sell signals based on the crossover and crossunder events between RSI and the dynamically adjusted thresholds. If a crossover event occurs, the weight is set to 2; otherwise, it remains at 1.
Signal Combination:
The weighted buy and sell signals from different timeframes are combined using logical operations. A buy signal is generated if the product of weights from all timeframes is equal to 2, indicating alignment across timeframe.
3. Experimental Enhancements:
The Advanced Dynamic Threshold RSI Indicator incorporates experimental features for educational exploration. While not intended as proven strategies, these features aim to offer users a glimpse into unconventional analysis. Some of these features include Performance Calculation, Volatility Calculation, Dynamic Threshold Calculation Using Volatility, Bollinger Bands Module, Weighted Signal System Incorporating New Features.
3.1 Performance Calculation:
The script calculates the percentage change in the price over a specified lookback period (variable lookbackBars). This provides a measure of recent performance.
pctChange(src, length) =>
change = src - src
pctChange = (change / src ) * 100
recentPerformance1H = pctChange(close, lookbackBars)
recentPerformance4H = pctChange(request.security(syminfo.tickerid, "240", close), lookbackBars)
recentPerformance1D = pctChange(request.security(syminfo.tickerid, "1D", close), lookbackBars)
3.2 Volatility Calculation:
The script computes the standard deviation of the closing price to measure volatility.
volatility1H = ta.stdev(close, 20)
volatility4H = ta.stdev(request.security(syminfo.tickerid, "240", close), 20)
volatility1D = ta.stdev(request.security(syminfo.tickerid, "1D", close), 20)
3.3 Dynamic Threshold Calculation Using Volatility:
The dynamic thresholds for RSI are calculated by adding a multiplier of volatility to 50.
dynamicThreshold1H = 50 + thresholdMultiplier * volatility1H
dynamicThreshold4H = 50 + thresholdMultiplier * volatility4H
dynamicThreshold1D = 50 + thresholdMultiplier * volatility1D
3.4 Bollinger Bands Module:
An additional module for Bollinger Bands is introduced, providing an option to enable or disable it.
// Additional Module: Bollinger Bands
bbLength = input(20, title="Bollinger Bands Length")
bbMultiplier = input(2.0, title="Bollinger Bands Multiplier")
upperBand = ta.sma(close, bbLength) + bbMultiplier * ta.stdev(close, bbLength)
lowerBand = ta.sma(close, bbLength) - bbMultiplier * ta.stdev(close, bbLength)
3.5 Weighted Signal System Incorporating New Features:
Buy and sell signals are generated based on the dynamic threshold, recent performance, and Bollinger Bands.
weightedBuySignal = rsi1H > dynamicThreshold1H and rsi4H > dynamicThreshold4H and rsi1D > dynamicThreshold1D and crossOver1H
weightedSellSignal = rsi1H < dynamicThreshold1H and rsi4H < dynamicThreshold4H and rsi1D < dynamicThreshold1D and crossUnder1H
These features collectively aim to provide users with a more comprehensive view of market dynamics by incorporating recent performance and volatility considerations into the RSI analysis. Users can experiment with these features to explore their impact on signal accuracy and overall indicator performance.
Indicator Placement for Enhanced Visibility
Overview
The design choice to position the "Advanced Dynamic Threshold RSI" indicator both on the main chart and beneath it has been carefully considered to address specific challenges related to visibility and scaling, providing users with an improved analytical experience.
Challenges Faced
1. Differing Scaling of RSI Results:
RSI values for different timeframes (1-hour, 4-hour, and 1-day) often exhibit different scales, especially in markets like gold.
Attempting to display these RSIs on the same chart can lead to visibility issues, as the scaling differences may cause certain RSI lines to appear compressed or nearly invisible.
2. Candlestick Visibility vs. RSI Scaling:
Balancing the visibility of candlestick patterns with that of RSI values posed a unique challenge.
A single pane for both candlesticks and RSIs may compromise the clarity of either, particularly when dealing with assets that exhibit distinct volatility patterns.
Design Solution
Placing the buy/sell signals above/below the candles helps to maintain a clear association between the signals and price movements.
By allocating RSIs beneath the main chart, users can better distinguish and analyze the RSI values without interference from candlestick scaling.
Doubling the scaling of the 1-hour RSI (displayed in blue) addresses visibility concerns and ensures that it remains discernible even when compared to the other two RSIs: 4-hour RSI (orange) and 1-day RSI (green).
Bollinger Bands Module is optional, but is turned on as default. When the module is turned on, the users can see the upper Bollinger Band (green) and lower Bollinger Band (red) on the main chart to gain more insight into price actions of the candles.
User Flexibility
This dual-placement approach offers users the flexibility to choose their preferred visualization:
The main chart provides a comprehensive view of buy/sell signals in relation to candlestick patterns.
The area beneath the chart accommodates a detailed examination of RSI values, each in its own timeframe, without compromising visibility.
The chosen design optimizes visibility and usability, addressing the unique challenges posed by differing RSI scales and ensuring users can make informed decisions based on both price action and RSI dynamics.
Usage
Installation
To ensure you receive updates and enhancements seamlessly, follow these steps:
Open the TradingView platform.
Navigate to the "Indicators" tab in the top menu.
Click on "Community Scripts" and search for "Advanced Dynamic Threshold RSI Indicator."
Select the indicator from the search results and click on it to add to your chart.
This ensures that any future updates to the indicator can be easily applied, keeping you up-to-date with the latest features and improvements.
Review Code
Open TradingView and navigate to the Pine Editor.
Copy the provided script.
Paste the script into the Pine Editor.
Click "Add to Chart."
Configuration
The indicator offers several customizable settings:
RSI Length: Defines the length of the RSI calculation.
SMA Length: Sets the length of the SMA applied to the RSI.
Lookback Bars: Determines the number of bars used for recent performance analysis.
Threshold Multiplier: Adjusts the multiplier for dynamic threshold calculation.
Enable Bollinger Bands: Allows users to enable or disable Bollinger Bands integration.
Interpreting Signals
Buy Signal: Generated when RSI values are above dynamic thresholds and a crossover occurs.
Sell Signal: Generated when RSI values are below dynamic thresholds and a crossunder occurs.
Additional Information
The indicator plots scaled RSI lines for 1-hour, 4-hour, and 1-day timeframes.
Users can experiment with additional modules, such as machine-learning simulation, dynamic real-life improvements, or experimental signal filtering, depending on personal preferences.
Conclusion
The Advanced Dynamic Threshold RSI Indicator provides traders with a sophisticated tool for RSI-based analysis, offering a unique combination of dynamic thresholds, performance analysis, and optional Bollinger Bands integration. Traders can customize settings and experiment with additional modules to tailor the indicator to their trading strategy.
Disclaimer: Use of the Advanced Dynamic Threshold RSI Indicator
The Advanced Dynamic Threshold RSI Indicator is provided for educational and experimental purposes only. The indicator is not intended to be used as financial or investment advice. Trading and investing in financial markets involve risk, and past performance is not indicative of future results.
The creator of this indicator is not a financial advisor, and the use of this indicator does not guarantee profitability or specific trading outcomes. Users are encouraged to conduct their own research and analysis and, if necessary, consult with a qualified financial professional before making any investment decisions.
It is important to recognize that all trading involves risk, and users should only trade with capital that they can afford to lose. The Advanced Dynamic Threshold RSI Indicator is an experimental tool that may not be suitable for all individuals, and its effectiveness may vary under different market conditions.
By using this indicator, you acknowledge that you are doing so at your own risk and discretion. The creator of this indicator shall not be held responsible for any financial losses or damages incurred as a result of using the indicator.
Kind regards,
Ely

Double Simple Moving AverageThe Double Simple moving average is an indicator developed to help traders identify dynamic levels of support and resistance as well as determine current trend direction.
This indicator shows both an SMA calculated on highs and one calculated on lows. In addition to that, it plots the deviation bands based on the space between the two main lines.
The gradient color between the two main lines can be used to determine the volumetric pressure and confirmation of the current trend.

What RSI? Weighted Heiken Ashi Triple RSIWhat You're Looking At:
The indicator presents a few key elements on its pane which is separate from the price chart:
Smoothed RSI Average Line: This line represents an average of three different RSI calculations, each weighted differently. It's been smoothed out to reduce noise and help you see the trend more clearly.
Moving Average Line: This is a line that smooths out the average RSI line even further and helps you identify the overall trend.
Bollinger Bands: These are two lines that create a channel around the RSI average line. The upper band typically represents an overbought condition, and the lower band represents an oversold condition.
Background Color: The background of the indicator pane will change colors to indicate buy (green) or sell (red) signals.
Horizontal Lines: There are horizontal lines drawn at levels 70, 50, and 30. These represent overbought, midpoint, and oversold levels, respectively.
How to Operate and Interpret:
Trend Identification: Look at the moving average line. If it's trending upwards, the overall momentum may be considered bullish. If it's trending downwards, the momentum may be bearish.
Buy Signals: You may consider a buy signal when:
The smoothed RSI average crosses above the moving average line.
The smoothed RSI average is below 30 and starts to rise, crossing the oversold line.
The background color turns green, signifying favorable conditions to buy according to the indicator's logic.
Sell Signals: You may consider a sell signal when:
The smoothed RSI average crosses below the moving average line.
The smoothed RSI average is above 70 and starts to fall, crossing the overbought line.
The background color turns red, signifying favorable conditions to sell according to the indicator's logic.
Overbought/Oversold Conditions: When the smoothed RSI line touches or crosses the Bollinger Bands, it could be indicating that the asset is overbought (upper band) or oversold (lower band). Some traders use these conditions to look for potential reversals.
Cautions for Trading:
If the smoothed RSI average is between the bands and near the middle line (50), the market might be considered neutral, and some traders may choose to wait for clearer signals.
Just because the indicator gives a buy or sell signal, it doesn't mean the price will immediately move in that direction. It's important to consider other factors in your trading strategy.
Final Notes:
Always use this indicator in conjunction with other analysis methods. No indicator is perfect, and they should be used to supplement your trading strategy, not replace it.
It's important to set stop losses according to your risk tolerance when entering any trades based on these signals.
Practice with the indicator in a demo account to become familiar with its behavior before using it with real money.
By following the movements and signals of this indicator, you can get a sense of the momentum and potential entry or exit points in the markets you are trading.

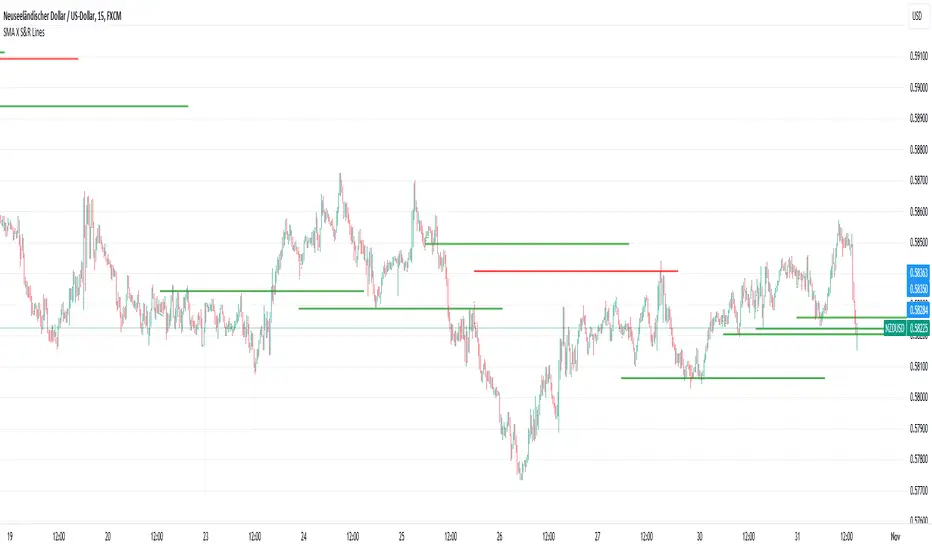
SMA Crossover Support & Resistance [Rami_LB]This indicator draws a horizontal line on the price chart at the point where two pre-defined SMA (Simple Moving Average) lines intersect. It is most useful for identifying crossed SMA lines on the 1-hour chart and then trading on smaller chart intervals.
For optimal performance, it is recommended to customize the values of the SMA lines individually for each currency pair, as these values can vary from one pair to another. To do this, switch to the 1-hour chart and adjust the SMA parameters until you visually observe that these settings would yield favorable results based on historical data. Certainly, you can also adjust the length of the lines accordingly when you switch from the 1-hour chart to smaller timeframes.
Please note that this indicator allows traders to visually identify potential trend changes and crossovers between short-term and long-term moving averages, aiding in decision-making for trading strategies.
Multi EMA/SMADescription:
This indicator combines both an Exponential Moving Average (EMA) and a Simple Moving Average (MA). The user can customize the lengths of both the EMA and the MA, as well as their respective colors and line widths.
Features:
Custom Lengths for EMA and MA: The user can specify the desired length for both the EMA and the MA.
Visibility Control: There are options to only display the MA and EMA during the times the price crosses them. This helps in highlighting significant crossover points. Additionally, the user can define how many bars before and after the crossover they wish to visualize the MA and EMA.
Customizable Appearance: The color and line width for both the MA and the EMA can be adjusted as per user preferences.
Dynamic Labels: The indicator provides labels that display the current values of the MA and the EMA. Additionally, these labels dynamically update to reflect any changes to the EMA or MA length input by the user.

Smart MAThe Smart MA indicator is a tool designed for traders seeking insights into market trends, with its foundation rooted in moving averages. It offers two distinctive color options, with "Crossing" as the default choice and "Direction" as an alternative. Let's delve deeper into these options:
1. "Crossing" Color Option (Default):
Key Features:
Utilizes the interaction between fast and slow moving averages.
The color of the base moving average (MA) line dynamically changes based on crossovers between these moving averages.
Offers real-time visual signals for potential shifts in market sentiment.
Interpretation:
With the "Crossing" color option as the default setting, the base MA line's color responds to the interaction of the fast and slow moving averages.
A crossover where the fast MA crosses above the slow MA may prompt the base MA line to change to a bullish color (e.g., teal), indicating a potential bullish trend.
Conversely, if the fast MA crosses below the slow MA, the base MA line's color may alter to represent a bearish sentiment (e.g., red). This color shift provides a visual marker for a potential bearish trend, potentially guiding traders towards shorting opportunities.
2. "Direction" Color Option:
Key Features:
Focuses on the directional trend of the base moving average (MA).
The color of the base MA line signifies the direction in which the base MA is moving.
Aids in quickly identifying the prevailing market trend.
Interpretation:
Uptrend - Bullish Direction: When the base MA slopes upward, indicating an average price increase over the chosen base MA length, the base MA line's color may shift to a bullish hue (e.g., teal). This visual cue signals a potential uptrend, suggesting favorable long positions.
Downtrend - Bearish Direction: If the base MA slopes downward, signifying an average price decrease over the selected base MA length, the base MA line could change to a bearish shade (e.g., red). This color shift acts as an indicator of a potential downtrend, implying possible opportunities for shorting.
Customization:
Both color options allow traders to adjust the indicator's parameters, including base MA length, MA type, fast MA length, and slow MA length, to align with their trading strategies and preferred timeframes.
In summary, the Smart MA indicator, based on moving averages, provides traders with two color options: the default "Crossing" and "Direction" as an alternative. The "Crossing" option leverages fast and slow moving averages to offer real-time visual cues for dynamic market shifts. The "Direction" option simplifies trend analysis by focusing on the directional trend of the base MA. The choice between these options depends on your trading style and the depth of analysis you require. With the Smart MA indicator, you're equipped to make informed trading decisions in today's financial markets.

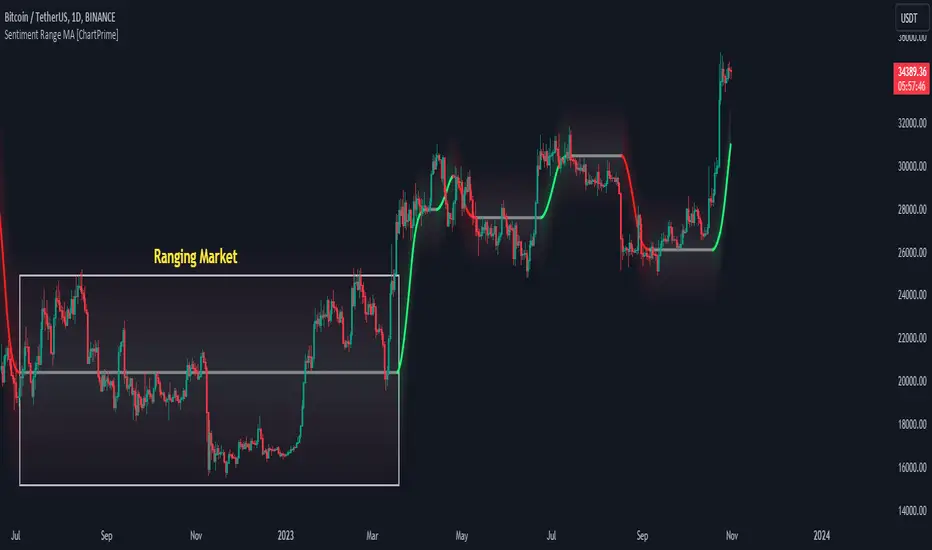
Sentiment Range MA [ChartPrime]The "Sentiment Range MA" provides traders with a dynamic perspective on market activity, emphasizing both stability in chop zones and quick adaptability outside of them.
Key Features:
Chop Zone Stability: In choppy markets, this indicator remains consistent, filtering out the noise to provide a clear view.
Quick Adaptability: Should the price break out of these zones, the indicator recalibrates promptly.
Dynamic Support and Resistance: Adapts based on the latest price action, serving as an evolving reference point.
Emphasis on Recent Levels: The tool factors in the latest notable market levels to stay relevant and timely.
Configurations:
Data Source: Choose your desired metric, though many default to the closing price.
Output Smoothing: Adjust the SR MA's response to market movements.
Trigger Smoothing: Refine boundary definitions based on your market insights.
ATR Period: Set the period for the ATR, influencing the surrounding boundary's width.
Range Multiplier: Control the ATR's effect on the range.
Range Switch: Flip between high-low and open-close values for range determination.
Visuals
Sentiment Range MA Line:
- This is the flowing line that transitions between green and red.
- When it's green, it indicates bullish momentum in the market. This suggests a prevailing upward trend and can be an entry cue for traders who trade with the trend.
- When it turns red, bearish sentiments dominate. It indicates the potential beginning of a downtrend or a continued downtrend. Traders might interpret this as a signal to be cautious, to short the market, or to exit long positions.
The Chop Zone:
- This is the space between the price candles and the Sentiment Range MA line. It represents a region where the price is considered to be moving sideways or without a clear direction. Price movements within the chop zone might not be substantial enough to warrant a trading decision. Only when the price breaks out of this zone do we see the Sentiment Range MA line change color, signaling a potential trading opportunity.
By interpreting these visuals, traders can make more informed decisions based on the prevailing market sentiment and trend. The chart becomes a tool, providing both an overview of the market condition and potential entry or exit points based on the Sentiment Range MA indicator's readings.
Detailed Settings Overview
Understanding the settings of the Sentiment Range MA Indicator can greatly enhance its utility in your trading strategy. Let's dive deeper into each:
Output Smoothing:
Purpose: It refines the SR MA to provide a clearer trend perspective.
Functionality:
- At `0`, it ensures the indicator responds immediately to price deviations from the chop zone.
- At higher values, it transforms the indicator into a volatility-adjusted moving average.
Filtering Modes:
- Single Filtering: Prioritizes speed.
- Double Filtering: Emphasizes stability.
Trigger Smoothing:
Purpose: Used for the range break detection.
Functionality: It dampens the indicator's sensitivity to sudden market volatility, preventing unnecessary triggers.
ATR Length:
Purpose: Governs the retrospective period for the chop zone.
Functionality:
- Higher values offer a more consistent and broad range size, capturing more historical data.
- Lower values allow for a more adaptive and responsive range.
Range Multiplier:
Purpose: Modifies the breadth of the range around the SR MA.
Functionality: Increasing the multiplier will extend the range, giving more leeway before triggering, while decreasing it will narrow the range, making the indicator more responsive to price changes.
Range Style:
Purpose: Decides which candlestick data is factored into the true range calculations.
Options:
- Body: Uses the open and close values.
- Wick: Accounts for the high and low values.
Functionality: Switching between styles lets you prioritize either the overall volatility (Wick) or just the concluded price action for a period (Body).
By fine-tuning these settings, traders can tailor the Sentiment Range MA Indicator to various market conditions and personal trading styles, ensuring optimal decision-making.
Quick Start
Based on the provided chart, here's a brief explanation of the default settings for the Sentiment Range MA Indicator:
Length: Set at ` 20 `.
- This determines the base moving average period. A standard setting, it calculates the average price over the last 20 periods, providing traders with a clear perspective of short-term trends.
ATR Length: Set at ` 200 `.
- This adjusts the lookback period for the Average True Range (ATR), which in turn influences the chop zone calculation. At a setting of 200, it offers a comprehensive view, considering a longer stretch of historical data.
Range Multiplier: Set at ` 6 `.
- This multiplies the ATR value, widening or narrowing the band around the SR MA. A setting of 6 means the range around the SR MA is determined by multiplying the ATR by 6, offering a broader fluctuation zone.
On the chart, the green line represents the bullish sentiment and the red represents the bearish sentiment. Price movements above and below these lines can be used as potential buy or sell signals respectively. Fine-tuning these settings can cater the Sentiment Range MA Indicator to your specific trading strategy and market condition preferences.
Alternative Settings
For traders looking to adapt to faster market conditions or prefer a more agile analysis, here's a brief description of the alternative settings for the Sentiment Range MA Indicator:
Length: Set at ` 3 `.
- This highly responsive setting calculates the average price over the last 3 periods. Ideal for quick market movements, it offers traders insights into very short-term price trends and potentially swift trade opportunities.
ATR Length: Set at ` 50 `.
- This shorter lookback period for the Average True Range (ATR) focuses on more recent market volatility, providing a tighter and more current chop zone calculation. It's suitable for those wanting to respond to recent market shifts.
Range Multiplier: Set at ` 4 `.
- Multiplying the ATR by 4 narrows down the buffer around the SR MA. This creates a tighter sentiment range, possibly resulting in more frequent crossovers and trading signals.
In the provided chart, the green line still denotes bullish momentum while the red symbolizes bearish sentiment. These alternative settings might generate more frequent signals, so traders should ensure their strategy is aligned with this heightened sensitivity.
Wrapping Up
The Sentiment Range MA melds stability and agility, making it a valuable tool in your trading toolkit. As always, before integrating new indicators, take the time to understand its nuances and potential impacts on your strategy.
MTF Moving AveragesThe MTF Moving Averages indicator allows users to plot multiple moving averages on different timeframes within the same chart on TradingView. This indicator supports four different timeframes: daily, weekly, monthly, and intraday.
For each timeframe, users can choose up to four moving averages to plot. They can also select the type of moving average (SMA, EMA, or WMA), the source (e.g., close price), and the length of each moving average. Additionally, users have the option to enable a "Trend Suite" for the second moving average on the daily timeframe. The Trend Suite adds 2 moving averages with source low and high.
In the intraday timeframe, the second moving average is calculated and plotted based on the daily timeframe.
The indicator provides customization options for colors, allowing users to define the colors for each moving average line.
The settings in the indicator are designed in a clear and organized manner.
Have fun

Moving Average with Start LineThis script paints a vertical line on the starting bar of a simple moving average to help anticipate directional changes. The line is the same color as the MA.

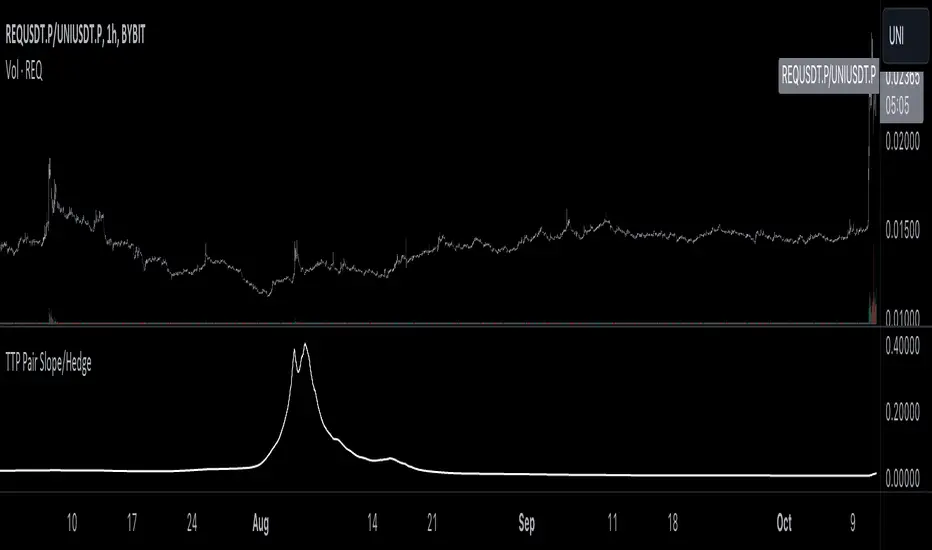
TTP Pair Slope/HedgePair slope/hedge uses linear regression to calculate the hedge ratio (slope) between the two assets within a period.
It allows you to specify a "from" and a "to" candle.
Example:
"A regression from 1000 candles back in time and ignore the last 100 candles. This would result in making a regression of 900 candles in total."
The formula used to perform the regression with the assts X and Y is:
Hedge =
mean( (X-mean(X))^2 )
——————————————————
mean( (X-mean(X)) * (Y-mean(Y)) )
You can later use the hedge in a chart of X - Hedge * Y
(Confirm with 1 / hedge )
If the plot is stationary the period tested should look like stationary.
If you cross an imaginary horizontal line across all the values in the period used it should look like a flat channel with values crossing above and below the line.
The purpose of this indicator is to help finding the linear regression test used for conintegration analysis. Conintegration assets is one of the requirements to consider assets for pair and hedge trading.
Magical SMAThis script is an intuitive trading alert system designed to identify potential entry points for both long and short positions. By utilizing a combination of Simple Moving Averages (SMA) and Ichimoku Cloud components, this script provides a robust framework for trend-following strategies.
Key Features:
SMA Crossover Detection: Monitors crossovers and crossunders between a 25-period and a 50-period SMA to signify potential bullish or bearish momentum.
Ichimoku Cloud Confirmation: Enhances the accuracy of entry signals by considering the position of the closing price relative to the Ichimoku Cloud's Lead Lines (A and B).
Long & Short Alert Conditions: Generates alert notifications for potential long and short entry signals based on the defined conditions.
Visualization: Plots the SMAs and Ichimoku Cloud components on the chart for better analysis and understanding of the prevailing market conditions.
Usage:
Long Entry Alert: Triggered when there's a crossover of the 25-period SMA above the 50-period SMA, and the closing price is above either of the Ichimoku Cloud's Lead Lines.
Short Entry Alert: Triggered when there's a crossunder of the 25-period SMA below the 50-period SMA, and the closing price is below either of the Ichimoku Cloud's Lead Lines.
This script is ideal for traders looking to capitalize on trend-following strategies with an additional layer of confirmation from the Ichimoku Cloud components. Whether you are trading equities, forex, or commodities, the "Chakibz" script is a valuable tool for identifying potential entry points and managing your trades.