Reliability[UO]This is an SMA based indicator. It gives a sense of long term behavior of the asset to make a reliable trade setup
How reliable is your asset to trade without gambling? Is there a reliable trend?
Is this price dip an opportunity to buy?
Is this price spike an opportunity to sell? Or would you avoid buying now and rather wait a bit for prices to fall down to a more reasonable level?
You can recognize all of those points on this indicator. The best to do is to look at the prices and patterns on the indicator to learn about those points.
Simple Moving Average (SMA)

RSI with Moving Averages[UO]This RSI indicator is one of my favorite indicators. This powerful indicator is implemented by Phi-Deltalytics. I modified the drawing so that it is easier (at least for me) to see the signals and trends (it would not matter if you're doing algorithmic trading).
Trends and signals. For detailed instructions and tutorial see Phi-Deltalytics page

Golden Ratio Fibonacci Multipliers Top Detector [UO]Fibonacci levels that show the critical top and bottom levels. There is no way to miss the top and bottom. And a top detector.
Also the most important SMA lines (SMA 50, 200), EMA21. Those are the most frequently used lines by traders.
This indicator is based on the work of www.tradingview.com
His work set me thinking. Could I also see the bottom using Fibonacci numbers? Yes, of course.
My favorite timeframes with this indicator are 6H, 1D, 3D.
Intensively used for BTC and BNB. And useful for any other coin.

[C] SMA multi TimeFrame with Ext. Fib PPThis script adds multi time frame Simple moving Average on a single time frame. It enables you to judge the moving average of a larger period on a small time frame. The added bonus of Fibonacci levels with additional support and resistance points works well with most NSE equity items on a intraday 5 min time frame.
VRSI-MARSI AI wanted to create an indicator which resembles price movement, aside to volume movement.
MARSI (= MA RSI(close)) = "yellow-blue" line which is the MA(5) of the RSI (9) of closing price.
VRSI (= MA RSI(Volume)) = "orange" line which is the MA(5) of the RSI (9) of Volume .
(Default plot of RSI and VRSI is not visible but can be made visible ("Settings" > "Style" > set "Opacity" of "RSI & VRSI"))
Because it still is a RSI indicator, the midline (50), and Oversold/Overbought area's (20-30 & 70-80) are important to watch, especially the MARSI!
Comparing the price movement with the "orange" Volume VRSI line helps to spot a possible trend change,
for example when price goes up and an ascending Volume VRSI line starts to flatten or starts descending,
this could be a sign that the Bullish trend is weakening, predicting a possible trend change.
Or, when for example a downwards price movement is accompanied with a rising Volume VRSI line, this can be a sign of large Bearish power.
This study comes with Bollinger Bands as an assisting tool, it is default made not visible but can be made visible
("settings" > "style" > Set "Opacity" of "basis, upper & lower")
You can see where the MARSI ("yellow-blue" line) crosses the "basis", or bounces off the bands, ...
All this is seen in "VRSI-MARSI B"
"VRSI-MARSI A" contains the alerts:
1) Long/Short = "Triangle UP/DOWN", color: lime/red
Condition: Movement of MA(5) of RSI (9) of price (close )
2) Long2/Short2 = ">", color: lime/red
Condition: Long/Short condition is true for 2 or more bars (= continuation)
3) Long3/Short3 = "•", color: lime/red
Condition: MA RSI (Close) crosses MA RSI ( Volume )
1 or more alerts can easily be disabled if desired (settings > inputs)
Thanks!
-------------------------------------------------------------------------------------------------------------------------------------------------------------------------
More information available in the script ;-)

VRSI-MARSI BI wanted to create an indicator which resembles price movement, aside to volume movement.
MARSI (= MA RSI(close)) = "yellow-blue" line which is the MA(5) of the RSI (9) of closing price.
VRSI (= MA RSI(Volume)) = "orange" line which is the MA(5) of the RSI (9) of Volume .
(Default plot of RSI and VRSI is not visible but can be made visible ("Settings" > "Style" > set "Opacity" of "RSI & VRSI"))
Because it still is a RSI indicator, the midline (50), and Oversold/Overbought area's (20-30 & 70-80) are important to watch, especially the MARSI!
Comparing the price movement with the "orange" Volume VRSI line helps to spot a possible trend change,
for example when price goes up and an ascending Volume VRSI line starts to flatten or starts descending,
this could be a sign that the Bullish trend is weakening, predicting a possible trend change.
Or, when for example a downwards price movement is accompanied with a rising Volume VRSI line, this can be a sign of large Bearish power.
This study comes with Bollinger Bands as an assisting tool, it is default made not visible but can be made visible
("settings" > "style" > Set "Opacity" of "basis, upper & lower")
You can see where the MARSI ("yellow-blue" line) crosses the "basis", or bounces off the bands, ...
All this is seen in "VRSI-MARSI B"
"VRSI-MARSI A" contains the alerts:
1) Long/Short = "Triangle UP/DOWN", color: lime/red
Condition: Movement of MA(5) of RSI (9) of price (close )
2) Long2/Short2 = ">", color: lime/red
Condition: Long/Short condition is true for 2 or more bars (= continuation)
3) Long3/Short3 = "•", color: lime/red
Condition: MA RSI (Close) crosses MA RSI ( Volume )
1 or more alerts can easily be disabled if desired (settings > inputs)
Thanks!
-------------------------------------------------------------------------------------------------------------------------------------------------------------------------
More information available in the script ;-)

sma 50 100 200 multi Timframes actual daily weekly monthlysma 50-100-200
Just 3 sma from actual,daily,weekly and monthly timeframe
Neru_TrendEvaluator_v1Neru_TrendEvaluator_v1
_____________________
This trend-finder tool is showing you at the bottom of the chart (adjustable), what the current supertrend for the chosen interval is.
Used indicators are the Ichimoku Cloud (adjustable settings) and three SMAs (also adjustable).
Both have standard settings and are useful for Stocks, Forex and Cryptocurrencies.
_____________________________________________
Warm regards,
Neru

MA Crossover [Alerts]This is a Moving Average Crossover study .
The study comes with all alerts (Long, Short, Take Profit, and Stop Loss).
A few visuals like Exit Loss and Profit/Loss Boxes have been added as well.
The following Moving Averages are supported:
SMA
EMA
DEMA
TEMA
WMA
VWMA
SMMA
HullMA
LSMA
ALMA
SSMA
TMA
ZLEMA
If you’d like to automate this script you can do that by using AutoView, ProfitView, ProfitTrailer, CryptoHopper etc.
Feel free to leave a comment and share it with your friends. Enjoy!

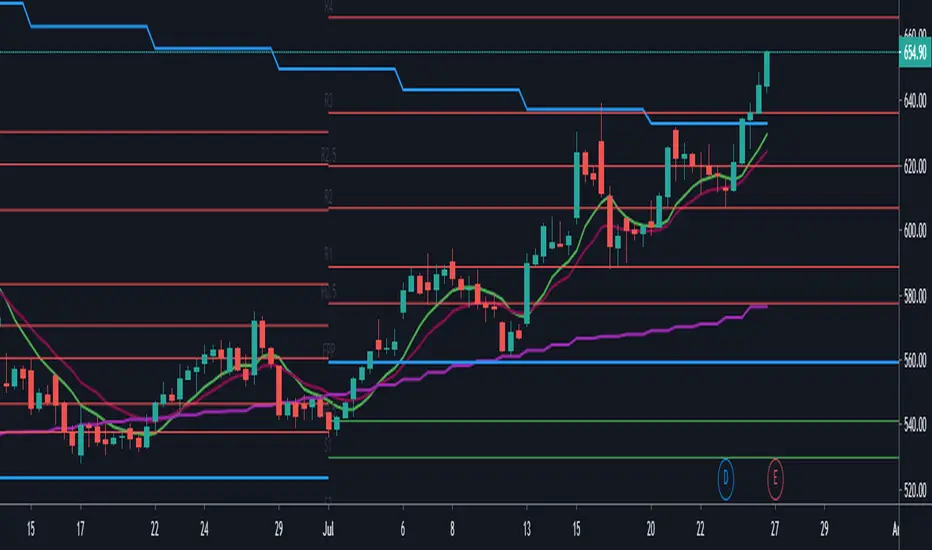
[ALL-IN-ONE] Algorithmic S/R and Pivots and Long Term LevelsHello my trading padawans.
Hope you're all having a blast
Here's the invite-only script of the week. The ALL-IN-ONE saga continues with another script.
This time, I compiled a lot of algorithmic supports and resistances (S/R) - to be used with any indicators out there.
Those S/R are universal and work with all asset classes (FOREX, CRYPTO, INDICES, STOCKS, COMMODITIES, ...)
No one can predicts which S/R will stop a move - generally - the high timeframes S/R + the SMAs with a big input value - work as strong walls often forcing the candles to retrace a bit short-term.
At Today's post (October, 25th 2019 - 12 pm UTC-4), we see how useful they were, to identify how high BTC/USD could go before retracing.
I. 💎 SCRIPTS ACCESS 💎
1.🖐️ Access can only be requested through my website.
2.🖐️ My website URL is in this script signature at the very bottom (you'll have to scroll down a bit and going past the long description) and in my profile status available here : Daveatt
3.🖐️ A tutorial article/video will be provided on those sub mentioned links + Tradingview
4.🖐️ You obviously can contact me directly for more information
II. 🔎 ALL-IN-ONE Supports and Resistances 🔎
You can display the algorithmic S/R, and/or pivots, (not finished yet) and the long terms levels.
For the 3 types of S/R, I pre-selected those that I think are the most relevant and useful for everyone. Please let me know if you'd like me to add/remove some.
All those listed by default are important and provide a MAP for a trader.
They give great take profits zones, levels where it's better to wait for a pullback before entering.
2.1 👁️🗨️ S/R mode 👁️🗨️
Each type of S/R can be displayed or not.
2.2 📱 Mobile optimized display 📱
Preview : imgur.com I posted 2 images there
The script is made using the newest version of Pinescript, and displaying small labels for every support/resistance.
✨ This will come in handy for mobile users - they'll get nice looking labels displayed at the right of their chart.
Each S/R type have its own labels and label position. The script users can activate/deactivate them at will
Let's review quickly each one.
2.3 Algorithmic SMAs
I cherish, love, sometimes despite them, but they're very relevant for all asset classes. The tool displays as many relevant algorithmic and generic SMAs that I could think of.
The indicator lists about 18 different SMAs in multiple timeframes.
2.4 Pivots
7 pivots are displayed (S1/S2/S3/P/R1/R2/R3)
You can choose one of 4 pivot point types:
- Traditional
- Woodie
- Fibonacci
- Camarilla.
The fun doesn't stop here. You can also select a timeframe between Daily/Weekly/Monthly/Yearly for those pivots.
For INDICES, for example, I use a lot the daily Traditional Pivots.
2.5 Long Terms Levels
Display by default the highest/lowest weekly/monthly/quarterly/monthly levels.
The scripts user can chose to select the previous highest/lowest also.
-------------------------------------------------------------------------------------------------------------------------------------
If you have any doubts or questions, please hit me up directly or ask in the comments section of this script.
I'll never claim I have the best trading methodology or indicators.
You only will judge and I'll appreciate all the questions and feedback you're sending my way.
They helped me a ton for developing indicators based on all the requests I received.
May the force 💪 be with you all 🥳.
Dave

Rolling Moving Average, SMA/EMA, for IPO stocksThe script replicates the standard EMA/SMA used by tradingview, but also adds an estimate for the first X periods, where X is the length of the moving average. This allows for an estimate of support resistance in IPO stocks, when fewer date is available

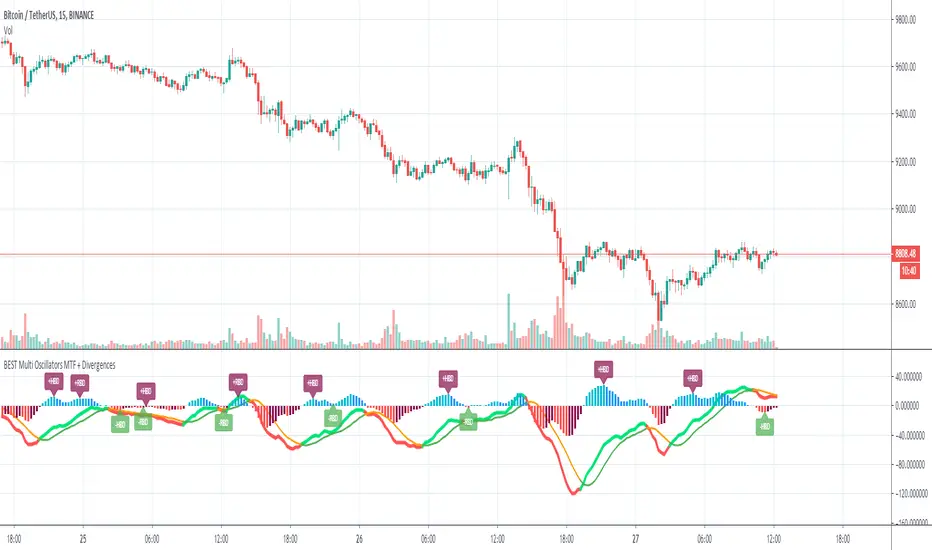
[ALL-IN-ONE] OSCILLATORS MTFHi everyone
I. 💎 SCRIPTS ACCESS 💎
1. My website URL is in this script signature at the very bottom (you'll have to scroll down a bit and going past the long description) and in my profile status available here : Daveatt
Due to the new scripts publishing house rules, I won't mention the URL here directly. As I value my partnership with TradingView very much, I prefer showing you the way for finding them :)
2. You obviously can contact me directly for more information
II. 🔎 ALL-IN-ONE OSCILLATORS MTF 🔎
This indicator offers to display many oscillators with a multi-timeframe option
The available oscillators so far are:
1. MACD
2. MACD ZERO LAG
3. RSI
4. DMI/ADX
5. ATR
6. STOCHASTIC RSI
7. TRUE STRENGTH INDEX
8. CHANDLE MOMENTUM OSCILLATOR
9. VORTEX INDICATOR
10. COMMODITY CHANNEL INDEX
11. RATE OF CHANGE
III - 📊 FEATURES 📊
3.1- 🔔 Alerts 🔔
LONG/SHORT alerts available for all oscillators.
You'll find only two events GoLong or GoShort because I simplified it a lot.
Let's assume the user wants to create alerts on a MACD first, and in a second time on an RSI.
All he/she has to do is :
1) to select the MACD parameter in the indicator and then activating the events GoLong and/or GoShort.
2) once done, select RSI filter in the indicator and then activate the events GoLong and/or GoShort.
3.2- 🔌&🕹️ (Plug and Play)
This feature is optional but very cool regardless.
Compatible with any of my Plug&Play trading tools.
You'll get instant results by connecting the ALL-IN-ONE to another Plug and Play compatible system.
Feel free to send a request my way if you want more details on that
3.3 - ⏱️ Use current chart resolution or any available timeframe
The Multi-timeframes component will expand your analytics capabilities even more.
IV - Use Cases
The use cases are maybe limitless
- an H4 oscillator combined with your indicator Plug&Play applied on an H1 chart.
- an RSI reversal signal used with your Backtest system.
- a 30-minutes True Strength Index plugged to a 5-minute indicator- itself combined into a Backtest system. #mind #blown
- ...
-------------------------------------------------------------------------------------------------------------------------------------
If you have any doubts or questions, please hit me up directly or ask in the comments section of this script.
I'll never claim I have the best trading methodology or indicators.
You only will judge and I'll appreciate all the questions and feedback you're sending my way.
They helped me a ton for developing indicators based on all the requests I received.
Kind regards,
Dave
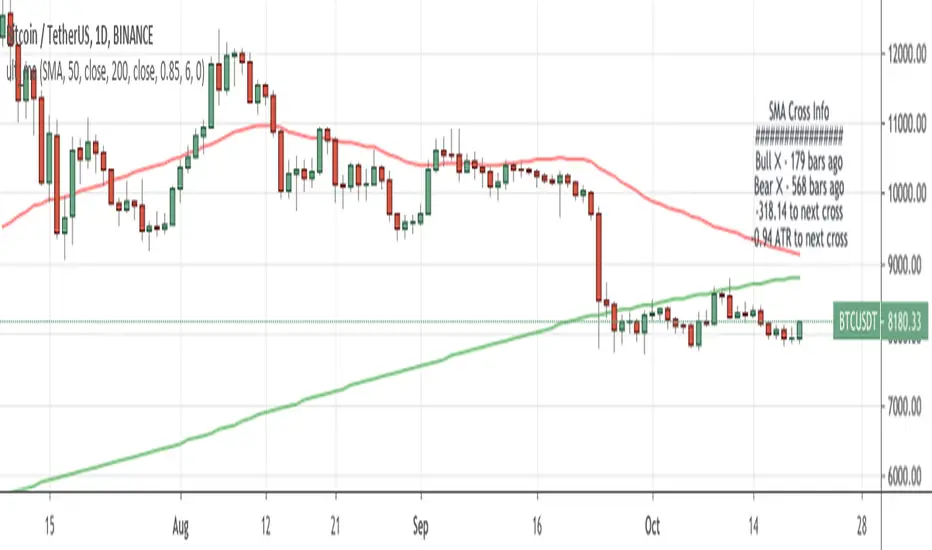
Ultimate MA Cross IndicatorContinue to experiment with new labels functionality in TradingView. Created ma cross script with 9 different types of MA wit additional information box. In that box, I included the bars passed from the previous bull/bear cross.
Also you cand find there live distance between moving averages in price and ATRs , so you track how close are you from the next close.
Do you think this concept is useful? What information do you want to see in this kind of boxes?
These ma types are included in this indicator:
Simple Moving Average ( SMA )
Exponential Moving Average ( EMA )
Weighted Moving Average ( WMA )
Arnaud Legoux Moving Average ( ALMA )
Hull Moving Average ( HMA )
Volume-weighted Moving Average ( VWMA )
Least Square Moving Average ( LSMA )
Smoothed Moving Average ( SMMA )
Double Exponential Moving Average ( DEMA )
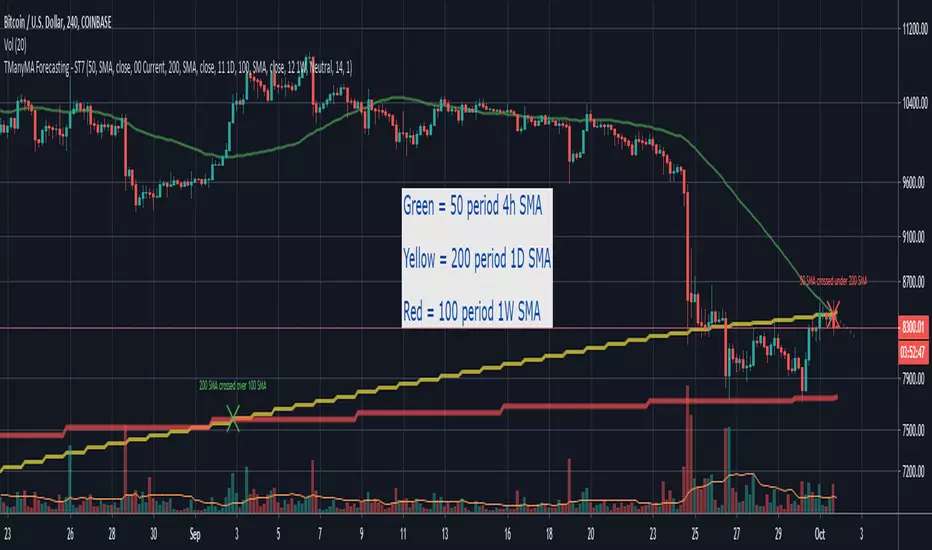
Scripting Tutorial 8 - Triple Many Moving Averages RibbonsThis script is for a triple moving average indicator where the user can select from different types of moving averages, price sources, lookback periods and resolutions.
Features:
- 3 Moving Averages with variable MA types, periods, price sources, resolutions and the ability to disable each individually
- Crossovers are plotted on the chart with detailed information regarding the crossover (Ex: 50 SMA crossed over 200 SMA )
- Forecasting available for all three MAs. MA values are forecasted 5 values out and plotted as if a continuation to the MA.
- Forecast bias also applies to all forecasting. Bias means we can forecast based on an anticipated bullish, bearish or neutral direction in the market.
- To understand bias, please read the source code, or if you can't read the code just send me a message on here or Twitter. Twitter should be linked to my profile.
- Ribbons added and on by default. Optional setting to disable the ribbons. 5 ribbons between MA1 and MA2 and another 5 between MA2 and MA3.
- Ribbons are alpha-color coded based on their relation to their default MAs.
- Ribbons are only visible between MAs if the MAs being compared share the same Type, Resolution, and Source because there is no way to consolidate those three in a simple manner.
- Ribbon values are calculated based on calculated MA Periods between the MAs.
This script is meant as an educational script with well-formatted styling, and references for specific functions.

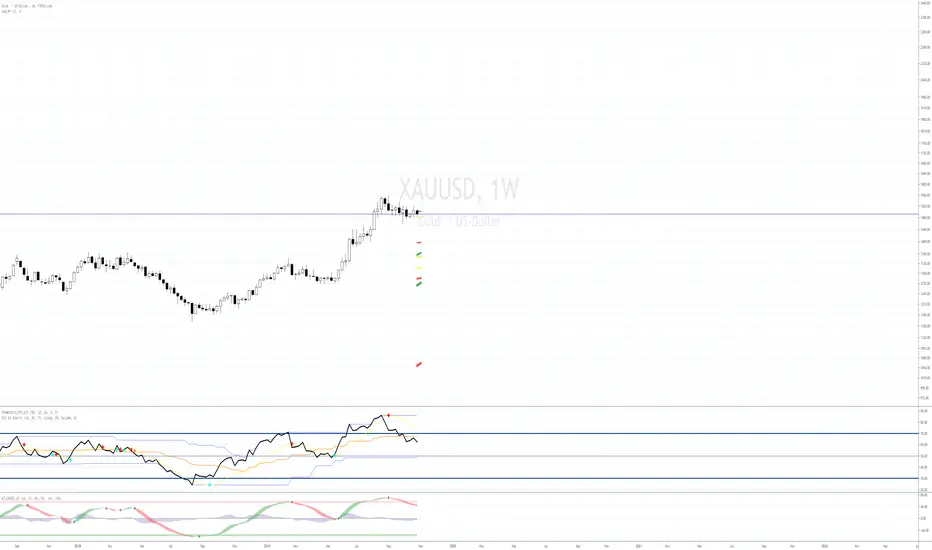
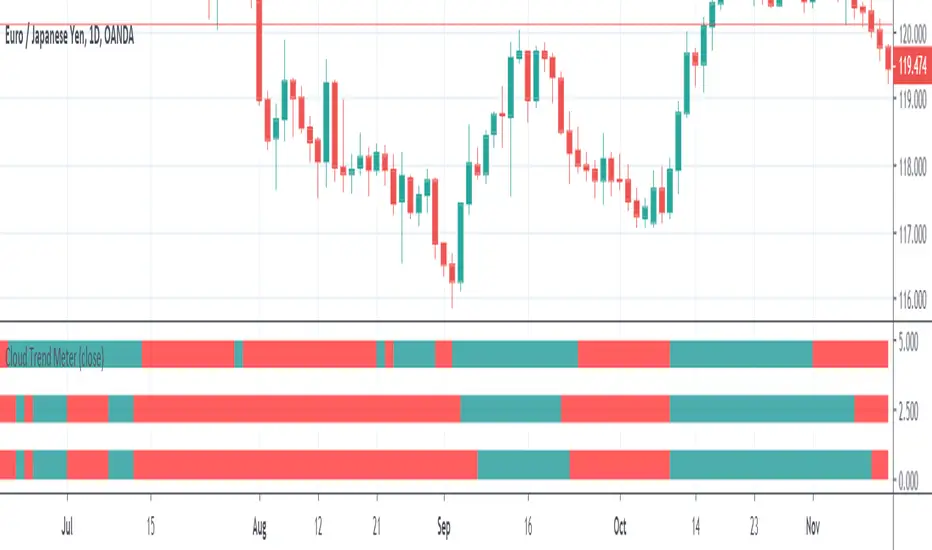
Cloud Trend Meter Uptrend / Bullish
Predict uptrend when at least 2/3 are green on the left side.
Downtrend / Bearish
Predict downtrend when at least 2/3 are red on the left side.
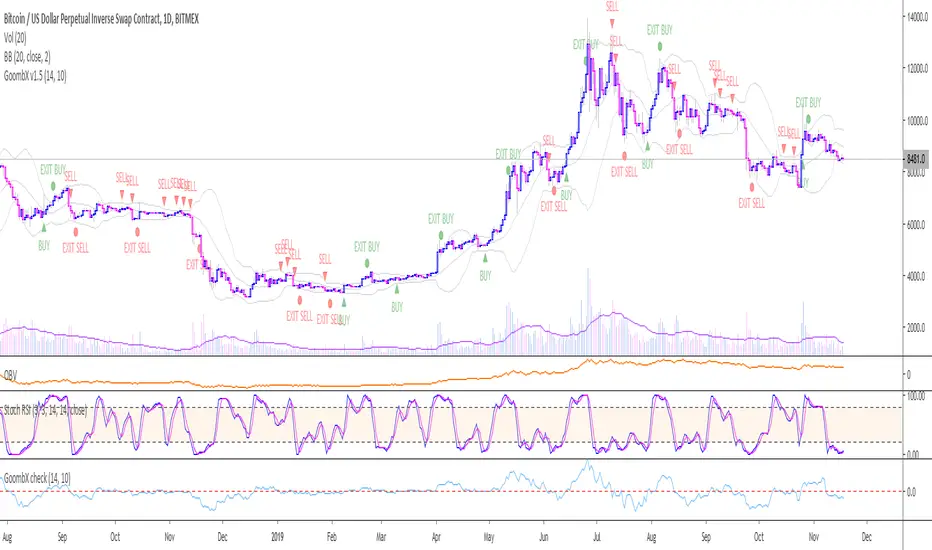
GoombX v1.1 - A trend catcherThis is an MA and stoch RSI based indicator which looks for particular crosses to identify strong trends.
It produces clear signals for:
- LONG ENTRY when it detects a significant MA cross and the right stoch RSI conditions
- LONG EXIT when certain stoch RSI conditions are met
- LONG STOP when price moves x% below entry (default 10%)
- SHORT ENTRY when it detects a significant MA cross and the right stoch RSI conditions
- SHORT EXIT when certain stoch RSI conditions are met
- SHORT STOP when price moves x% above entry (default 10%)
In testing it it performed best on daily chart with a 14 days Lookback window and 10% stop loss
NOTE that a signal is only definitive once the trigger candle has closed
To setup an alert with GoombX, follow these steps:
- Set up GoombX on your chart with the desired parameters and Time Frame
- Click on alerts in the right side of the screen and then Add (+)
- Under Conditions, choose the alert you are looking for (LONG ENTRY, LONG STOP,....)
- Under Options, choose "Once per bar close"
- Create
8 EMA & 5 SMA ComboA combination of 8 EMA & 5 SMA to use with more advanced MA strategies and de-cluttering of indicator list.
To identify lines, Color combination should be somewhat warmer/lighter to cooler/darker colors.
EMA have a thicker line than the SMA. Color pairs have lighter/darker in cases where there are slight variations (when using one over another).

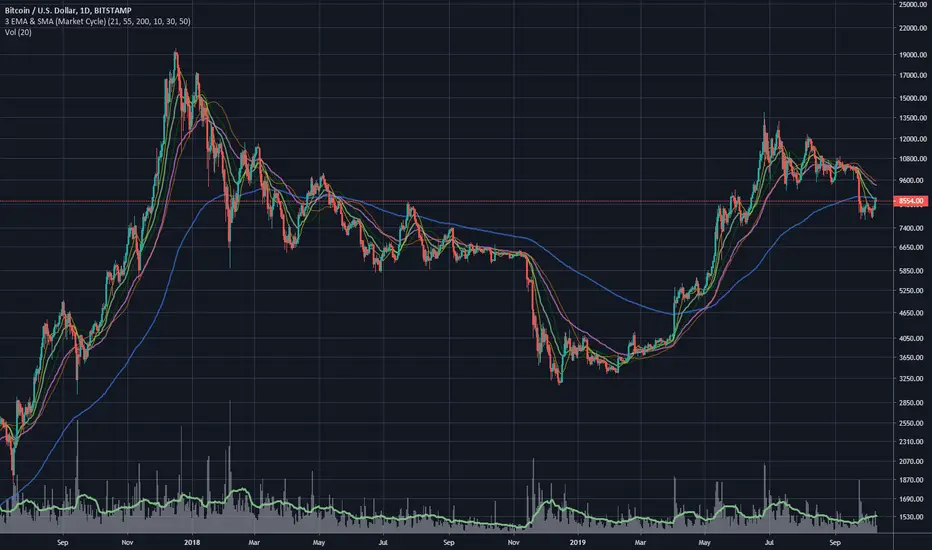
3 EMA & SMA (Market Cycle)Simple Indicator based on 3 Simple and 3 Exponential Moving Averages. Used to indicate Market Cycles.
Definition of Bull Market: 10 SMA is above 21 EMA . 30 SMA slope is up. 55 EMA is trending above 200 EMA .
Definition of Bear Market: 10 SMA is below 21 EMA . 30 SMA slope is down. 55 EMA is trending below 200 EMA .
Moving Averages (21, 55, 200) with Parabolic SAR and Support/ ReA Simple indicator combining 3 of the most popular simple moving averages; (21,55, 200) with a tweaked Parabolic SAR as well as recent support & resistance points.
Developed to help see key areas of interest on COINBASE:BTCUSD quickly without needing to draw many manual trendlines in order to trade breakouts or bounces at key levels. But should be useful for any market.
This indicator is best used in combination with oscillators such as the MacD or RSI and also volume.

Moving Average Daily (& Weekly) 50,100,200Free to use Moving Average indicator for 50, 100 and 200 days that displays both the daily and weekly Moving Averages on the same chart - revealing key support and resistance lines that might otherwise be overlooked. Please ensure to view in daily view only.
What is a Moving Average?
Smooths out the price across each period to reveal short, medium and long term trends and their relationship to each other. In principal, when the price is above a moving average the trend is up, when the price is below a moving average the trend is down.
When a short term MA crosses above a long term MA (a "golden cross") it is a strong buy signal. Conversely when a short term MA crosses below a long term MA (a "death cross") it is a strong sell signal. However, a death cross is usually only critical when both MAs are moving downwards.
Note that Moving Averages represent historical data and therefore are not strictly predictive in nature, but show trends that may be in action. Notably the 200 MA will often be particularly respected as support or resistance.
This tool is for educational purposes only and not a recommendation to buy or sell. Always do your own research before trading.

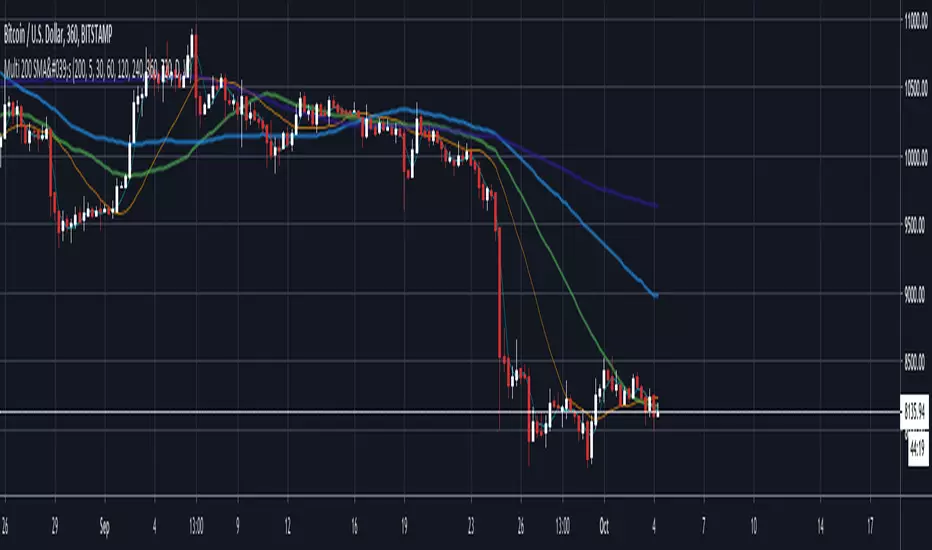
Multi 200 SMA'sIndicator that allows to print multiple timeframes MAs on a single chart instead of opening each timeframe separately
Scripting Tutorial 7 - Triple Many Moving Averages ResolutionsThis script is for a triple moving average indicator where the user can select from different types of moving averages, price sources, lookback periods and resolutions.
Features:
- 3 Moving Averages with variable MA types, periods, price sources, resolutions and the ability to disable each individually
- Crossovers are plotted on the chart with detailed information regarding the crossover (Ex: 50 SMA crossed over 200 SMA )
- Forecasting available for all three MAs. MA values are forecasted 5 values out and plotted as if a continuation to the MA.
- Forecast bias also applies to all forecasting. Bias means we can forecast based on an anticipated bullish, bearish or neutral direction in the market.
- To understand bias, please read the source code, or if you can't read the code just send me a message on here or Twitter. Twitter should be linked to my profile.
This script is meant as an educational script with well-formatted styling, and references for specific functions.