NEXT VWAP SlopeOverview:
This customizable oscillator tracks slope of the Volume-Weighted Average Price ( VWAP ) line, positive and negative, over a user-specified run (bar distance). It is highly responsive, far more so than VWAP alone, making it suitable for issuing long and short signals (especially around 0 crossovers) as well as exit signals at positive and negative extremes (corresponding to price-volume momentum exhaustion).
NASDAQ 100 Futures ( CME_MINI:NQ1! ) 1-minute trend following
The example below shows a NEXT VWAP Slope 0-crossover strategy, issuing long signals when the VWAP Slope line crosses over 0 and short when it crosses under it. You will need the NEXT Strategy Visualizer (free) to plot NEXT VWAP Slope's signals.
NEXT VWAP Slope is highly customizable, allowing you to change the length of the run (for smoother slopes), as well as the midline level - in the above example it is 0. The latter is useful if you want to introduce a bias into your strategies: long, if negative, short, if positive.
Input Parameters:
There are 2 groups of input.
Slope Settings
Slope Run - controls the length of time (in bars) for slope calculation with higher values yielding a smoother, more filtered, but less responsive curve
Midline - the NEXT VWAP Slope level above which market is considered long, below short; default is 0
Upper Limit - the NEXT VWAP Slope level above which market is considered overbought; default is 0 (off)
Lower Limit - the NEXT VWAP Slope level under which market is considered oversold; default is 0 (off)
VWAP Settings
Anchor Period - controls the origin of VWAP calculations, start of session being the default.
Source - data used for calculating the VWAP, typically HLC /3, but can be used with other price formats and data sources as well.
Offset - shifting of the VWAP line forward (+) or backward (-).
Here is how to set NEXT VWAP Slope crossing 0 alerts: open a chart, attach NEXT VWAP Slope, and right-click on chart -> Add Alert. Condition: NEXT VWAP Slope >> VWAP >> Crossing >> Value >> 0 >> Once Per Bar Close.
Slope

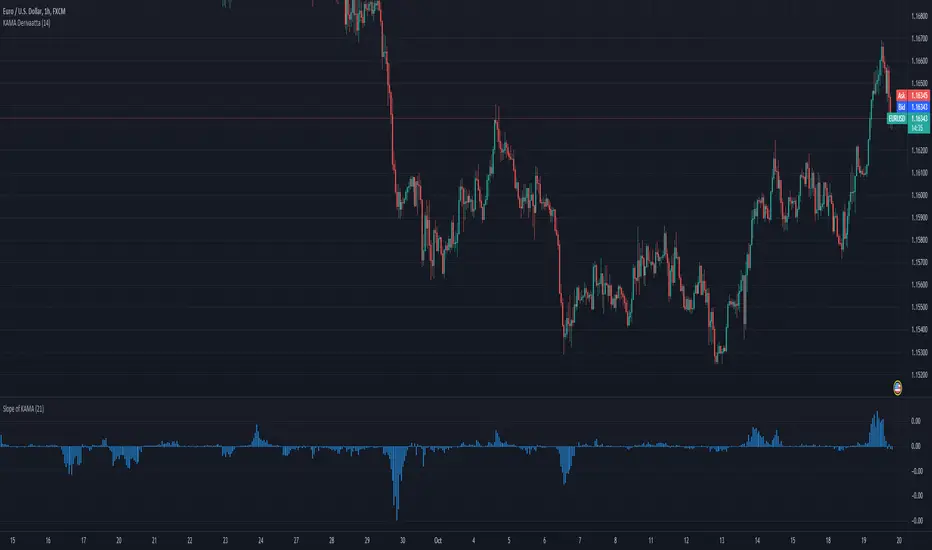
Slope of KAMAShows the slope of KAMA by comparing last bar KAMA value to current bar KAMA value. Very simple, yet very effective determining the trend or volatility of market. When slope is very small market can be in range, hence it can be used as volatility filter for trend traders.
LinearRegressionLibraryLibrary "LinearRegressionLibrary" contains functions for fitting a regression line to the time series by means of different models, as well as functions for estimating the accuracy of the fit.
Linear regression algorithms:
RepeatedMedian(y, n, lastBar) applies repeated median regression (robust linear regression algorithm) to the input time series within the selected interval.
Parameters:
y :: float series, source time series (e.g. close)
n :: integer, the length of the selected time interval
lastBar :: integer, index of the last bar of the selected time interval (defines the position of the interval)
Output:
mSlope :: float, slope of the regression line
mInter :: float, intercept of the regression line
TheilSen(y, n, lastBar) applies the Theil-Sen estimator (robust linear regression algorithm) to the input time series within the selected interval.
Parameters:
y :: float series, source time series
n :: integer, the length of the selected time interval
lastBar :: integer, index of the last bar of the selected time interval (defines the position of the interval)
Output:
tsSlope :: float, slope of the regression line
tsInter :: float, intercept of the regression line
OrdinaryLeastSquares(y, n, lastBar) applies the ordinary least squares regression (non-robust) to the input time series within the selected interval.
Parameters:
y :: float series, source time series
n :: integer, the length of the selected time interval
lastBar :: integer, index of the last bar of the selected time interval (defines the position of the interval)
Output:
olsSlope :: float, slope of the regression line
olsInter :: float, intercept of the regression line
Model performance metrics:
metricRMSE(y, n, lastBar, slope, intercept) returns the Root-Mean-Square Error (RMSE) of the regression. The better the model, the lower the RMSE.
Parameters:
y :: float series, source time series (e.g. close)
n :: integer, the length of the selected time interval
lastBar :: integer, index of the last bar of the selected time interval (defines the position of the interval)
slope :: float, slope of the evaluated linear regression line
intercept :: float, intercept of the evaluated linear regression line
Output:
rmse :: float, RMSE value
metricMAE(y, n, lastBar, slope, intercept) returns the Mean Absolute Error (MAE) of the regression. MAE is is similar to RMSE but is less sensitive to outliers. The better the model, the lower the MAE.
Parameters:
y :: float series, source time series
n :: integer, the length of the selected time interval
lastBar :: integer, index of the last bar of the selected time interval (defines the position of the interval)
slope :: float, slope of the evaluated linear regression line
intercept :: float, intercept of the evaluated linear regression line
Output:
mae :: float, MAE value
metricR2(y, n, lastBar, slope, intercept) returns the coefficient of determination (R squared) of the regression. The better the linear regression fits the data (compared to the sample mean), the closer the value of the R squared is to 1.
Parameters:
y :: float series, source time series
n :: integer, the length of the selected time interval
lastBar :: integer, index of the last bar of the selected time interval (defines the position of the interval)
slope :: float, slope of the evaluated linear regression line
intercept :: float, intercept of the evaluated linear regression line
Output:
Rsq :: float, R-sqared score
Usage example:
//@version=5
indicator('ExampleLinReg', overlay=true)
// import the library
import tbiktag/LinearRegressionLibrary/1 as linreg
// define the studied interval: last 100 bars
int Npoints = 100
int lastBar = bar_index
int firstBar = bar_index - Npoints
// apply repeated median regression to the closing price time series within the specified interval
{square bracket}slope, intercept{square bracket} = linreg.RepeatedMedian(close, Npoints, lastBar)
// calculate the root-mean-square error of the obtained linear fit
rmse = linreg.metricRMSE(close, Npoints, lastBar, slope, intercept)
// plot the line and print the RMSE value
float y1 = intercept
float y2 = intercept + slope * (Npoints - 1)
if barstate.islast
{indent} line.new(firstBar,y1, lastBar,y2)
{indent} label.new(lastBar,y2,text='RMSE = '+str.format("{0,number,#.#}", rmse))

Repeated Median Regression with Interactive Range SelectionGreetings to all!
As you probably know, TradingView now supports interactive inputs that can be directly set on a chart. I decided to build a tool that takes advantage of this incredible feature. This tool applies robust linear regression within a time interval on the chart that you can select interactively.
Method
The script uses an algorithm known as Repeated Median Regression . It belongs to the class of so-called robust regression methods. The reason they are called “robust” is that these methods are much less sensitive to outliers in the data than the ordinary least squares.
The calculation procedure is as follows: For each data point, this algorithm collects the slopes of the lines connecting that point to all other points in the sample, calculates the median slope, and then obtains the median value of these median slopes. Subsequently, it calculates the intercepts of the regression line and the mean absolute error (MAE) of the model.
Based on these results, a linear channel is plotted. The upper and lower channel boundaries are set by the MAE value multiplied by a user-defined coefficient.
Further reading
You can read more about robust linear regression on Wikipedia .
For more information on interactive inputs, see the User Manual's page .
Previous publication
I have already posted a script using the repeated median regression method. Although the core algorithm is essentially the same, interactive input provides fundamentally different functionality to the current script.
A word of caution
Currently, the interactive interval selection mode can be triggered only when the script is loaded to the chart. Thus, you might have to reload it when switching between different timeframes.

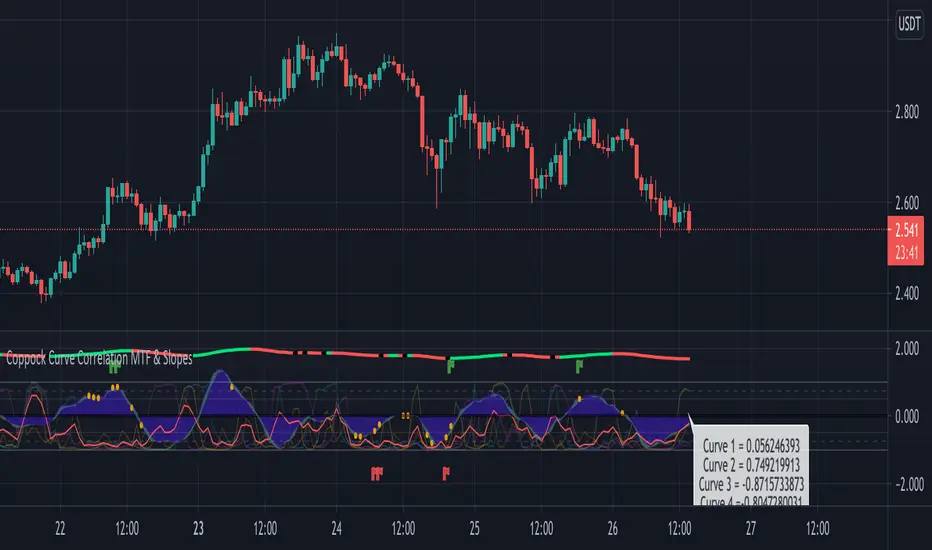
Coppock Curve Correlation between MTF & SlopesMy first tool !
1. The waves shows the slope of the curve. The front one = 3 periods, back one = 2 periods, difference = white area.
2. The moving lines shows the curve correlation between 2x 2 time frames (adjustable on the settings) on 2 periods lookback.
2.1 Theres few regions of high correlation, lines are at (absolute values) 0.5, 0.75, 1
3. On the top there's the Coppock curve -> if falling since 1 period = red, else green.
4. Diamonds shows : if correlation is in the strong correlation area and slope is falling or rising : red or green diamond.
This tool could be interesting to have an idea if there's strong correlation between timeframes instead of watching 4-5 different timeframes !
Mean AnglesThis indicator plots the trend of the angles made by the chosen means. This trend when analysed over multiple timeframes as well as different lengths can give an indication of the trend in short medium and long term.
For example, in any particular timeframe, when the 20 EMA turns a negative arctan, it signifies that on a shorter timeframe (than the current timeframe) is turning downwards in price. When 50, 100 and 200 EMA turn negative, it confirms the trend reversal. Similarly the 20 EMA will be the first one to turn "Up" or positive to indicate a possible trend reversal on the upside.
The angle of the means will oscillate between +pi/2 and -pi/2.
0 means - EMA is flat
+pi/2 means - almost vertical price rise
-pi/2 means - almost vertical price fall
Between -pi/2 and 0 means EMA is sloped downwards. Moving from -pi/2 to 0 means EMA slope is turning up. Moving from 0 to -pi/2 means EMA slope is falling down even lower and faster.
Between 0 and +pi/2 means EMA is slopped upwards. Moving from +pi/2 to 0 means EMA slope is falling down. Moving from 0 to +pi/2 means EMA slope is turning up even higher and faster.

Natural Market Slope [CC]The Natural Market Slope was created by Jim Sloman and this is one of his many Ocean Indicators which I'm publishing thanks to receiving source materials from @altcoinz and @tmac87. I did completely rewrite the formula for this indicator but I commented out the original calculation so you can compare or just for study purposes. I like this version better because it is very smooth and the original formula is a bit faster with response but is very choppy in comparison.
This indicator was the basis for his Natural Market Combo which I will be publishing very soon so stay tuned for that. The idea behind all of his Natural indicators was to use the natural log of the current price in different ways. This indicator obviously focuses on the slope and it essentially becomes another momentum indicator which peaks when the upward momentum is gone and vice versa. Buy when the line turns green and sell when it turns red. I have added strong buy and sell signals in addition to the normal ones and strong signals are darker in color in comparison to the original lighter colors.
Let me know if there are any other indicators you would like to see me publish!

Moving Average Slope AnalysisThis is a simple script which allows to do slope analysis on any kind of Moving Average. Simply change the moving average function that you wish to work with , in the script.
Slope analysis may be required for fine-tuning trade automation software , which uses Moving Average for determining optimum enter/exit point.
Read code comments for instructions!
Crypto momentum strategyThis strategy is based on LazyBear's Squeeze Momentum indicator. It analyzes when the trend in the momentum is shifting, locating the peaks and the valleys, and takes those as sell and buy signals respectively. This is a long strategy, so it also takes into consideration the 50 period Exponential Moving Average to identify upward trends. If the closing price of the candle is above the 50EMA, and the slope of the 50EMA is trending upwards, then the buy signal is executed. If these conditions are not met, the buy signal is ignored.
This strategy works well with crypto trading on the day/week charts.
It has a profit ratio of 4:1 on average, and roughly half of the trades are profitable.

DRSI DMA Scalping Strategy No RepaintThis strategy compares the slope of a Moving Average (of your choosing) to the slope of a Momentum Indicator (of your choosing). Zero is the center line because 0 slope means sideways movement. When both lines cross your buy threshold, it buys. When both lines cross your Sell threshold, it sells. The lines may look choppy, but that is probably because it is referencing a different timeframe than what the chart is set to. I left as many settings adjustable by the user as possible so you can tune this strategy to the relative behavior of whatever you are trading.
This also includes a No Repaint function so the backtest should be as close to live trading as possible.

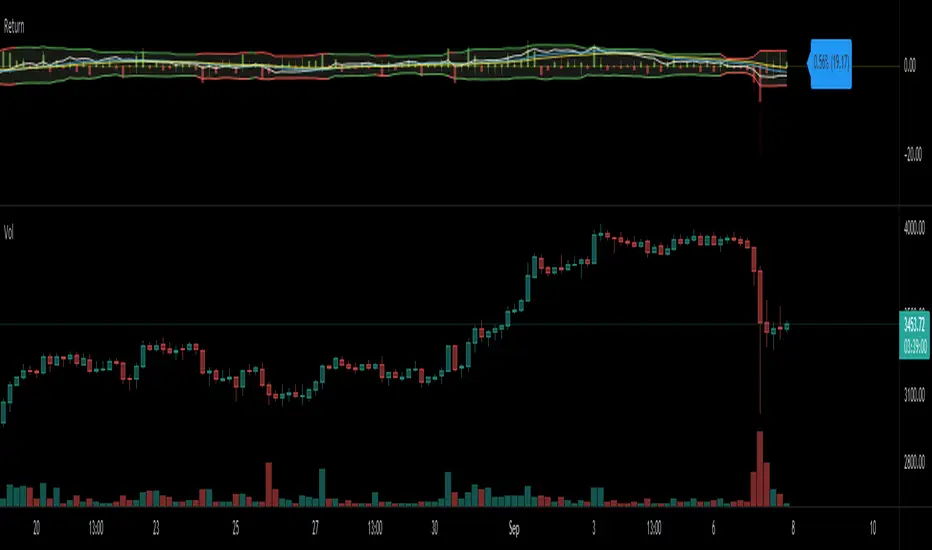
Return (Percent Change)This Script displays Regular or Log Returns as either a line or histogram and labels the current bar.
If something other than price is selected as the source, the result is percent change with a positive or negative slope.
If a moving average of price is used as the source, the result is analogous to a strength index
Other options include a look-back period adjustment (the default is 1),
smoothing results by converting to an EMA, and
Bollinger Bands with Length and Standard Deviation inputs.
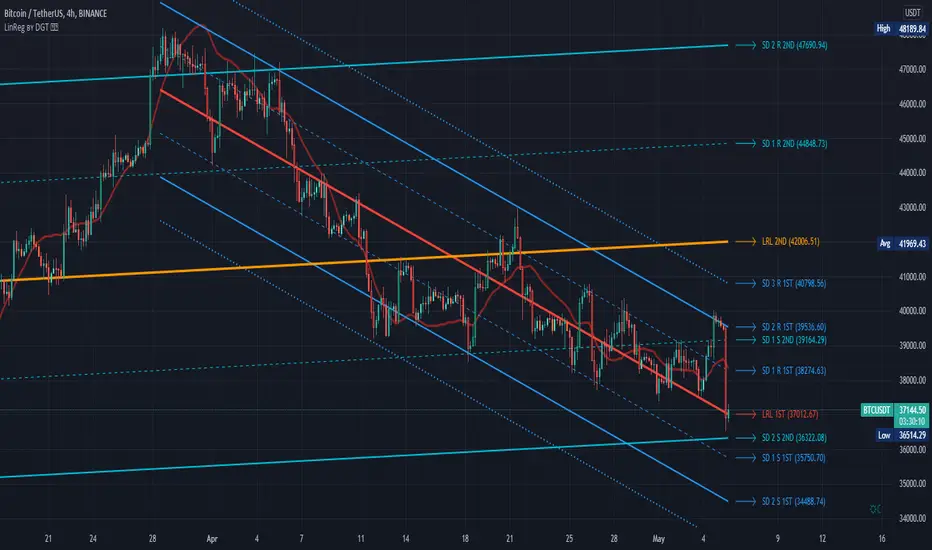
Linear Regression Channel / Curve / Slope by DGTTʜᴇ Lɪɴᴇᴀʀ Rᴇɢʀᴇꜱꜱɪᴏɴ Cʜᴀɴɴᴇʟꜱ
Linear Regression Channels are useful measure for technical and quantitative analysis in financial markets that help identifying trends and trend direction. The use of standard deviation gives traders ideas as to when prices are becoming overbought or oversold relative to the long term trend
The basis of a linear regression channel
Linear Regression Line – is a line drawn according to the least-squares statistical technique which produces a best-fit line that cuts through the middle of price action, a line that best fits all the data points of interest. The resulting fitted model can be used to summarize the data, to predict unobserved values from the same system. Linear Regression Line then present basis for the channel calculations
The linear regression channel
2. Upper Channel Line – A line that runs parallel to the Linear Regression Line and is usually one to two standard deviations above the Linear Regression Line.
3. Lower Channel Line – This line runs parallel to the Linear Regression Line and is usually one to two standard deviations below the Linear Regression Line.
Unlike Fibonacci Channels and Andrew’s Pitchfork, Linear Regression Channels are calculated using statistical methods, both for the regression line (as expressed above) and deviation channels. Upper and Lower channel lines are presenting the idea of bell curve method, also known as a normal distribution and are calculated using standard deviation function.
A standard deviation include 68% of the data points, two standard deviations include approximately 95% of the data points and any data point that appears outside two standard deviations is very rare.
It is often assumed that the data points will move back toward the average, or regress and channels would allow us to see when a security is overbought or oversold and ready to revert to the mean
please note : Over time, the price will move up and down, and the linear regression channel will experience changes as old prices fall off and new prices appear
█ Linear Regression Study Features
Linear Regression Channel
- Linear regression line as basis
- Customizable multiple channels based on Standard Deviation
- ALERTs for the channel levels
Linear Regression Curve
- Linear regression curve as basis
- Optional : Bands based on Standard Deviation or Volatility (ATR). Bands are applied with fixed levels 1, 2 and 3 times StdDev or ATR away from the curve
Linear Regression Slope
- Optional : Up/Down slope arrows for a used defined period
█ Volume / Volatility Add-Ons
High Volatile Bar Indication
Volume Spike Bar Indication
Volume Weighted Colored Bars
Slope and Concavity : derivative calculations [Fournier-Eaton]This script calculates the "instantaneous" first and second derivatives in a highly flexible and accurate way: namely, via zero-lag price tracking with increasingly narrow sample windows for sequential secant approximation tending towards the tangent. The slope of this tangential is the first derivative, i.e., slope.
Paired with a divergence indicator this can be a powerful tool for trend analysis.
The Script Works As Follows
The slope (first derivative) is represented in line form
Note that crossing through zero, the slope indicates a change in trend direction.
The concavity (second derivative) is represented in histogram form
Positive concavity indicates a shape like an upward bowl, negative is like a downward bowl, and crossing through zero is an inflection point.
Pair this with any indicator that will accept arbitrary input (i.e., from other indicators) select slope or concavity (first or second derivative) to get a lead on trend changes that are often difficult to approximate with the eye during hectic markets.
This is particularly useful as an augmentation for trend shift indicator -- which has been updated.

Moving Average Slope to determine market directionMoving Average Slope is a straightforward but also a handy indicator.
By inserting this moving average, it is possible to glance at the direction of the trend.
When the moving average has an increasing angle, it will turn green; vice versa, it will be colored red.
It is a trend indicator; I recommend leaving the period at 20 because it includes the last four trading weeks.
If you found this indicator useful, please like it
Repeated Median Regression ChannelThis script uses the Repeated Median (RM) estimator to construct a linear regression channel and thus offers an alternative to the available codes based on ordinary least squares.
The RM estimator is a robust linear regression algorithm. It was proposed by Siegel in 1982 (1) and has since found many applications in science and engineering for linear trend estimation and data filtering.
The key difference between RM and ordinary least squares methods is that the slope of the RM line is significantly less affected by data points that deviate strongly from the established trend. In statistics, these points are usually called outliers, while in the context of price data, they are associated with gaps, reversals, breaks from the trading range. Thus, robustness to outlier means that the nascent deviation from a predetermined trend will be more clearly seen in the RM regression compared to the least-squares estimate. For the same reason, the RM model is expected to better depict gaps and trend changes (2).
Input Description
Length : Determines the length of the regression line.
Channel Multiplier : Determines the channel width in units of root-mean-square deviation.
Show Channel : If switched off , only the (central) regression line is displayed.
Show Historical Broken Channel : If switched on , the channels that were broken in the past are displayed. Note that a certain historical broken channel is shown only when at least Length / 2 bars have passed since the last historical broken channel.
Print Slope : Displays the value of the current RM slope on the graph.
Method
Calculation of the RM regression line is done as follows (1,3):
For each sample point ( t (i), y (i)) with i = 1.. Length , the algorithm calculates the median of all the slopes of the lines connecting this point to the other Length -1 points.
The regression slope is defined as the median of the set of these median slopes.
The regression intercept is defined as the median of the set { y (i) – m * t (i)}.
Computational Time
The present implementation utilizes a brute-force algorithm for computing the RM-slope that takes O ( Length ^2) time. Therefore, the calculation of the historical broken channels might take a relatively long time (depending on the Length parameter). However, when the Show Historical Broken Channel option is off, only the real-time RM channel is calculated, and this is done quite fast.
References
1. A. F. Siegel (1982), Robust regression using repeated medians, Biometrika, 69 , 242–244.
2. P. L. Davies, R. Fried, and U. Gather (2004), Robust signal extraction for on-line monitoring data, Journal of Statistical Planning and Inference 122 , 65-78.
3. en.wikipedia.org

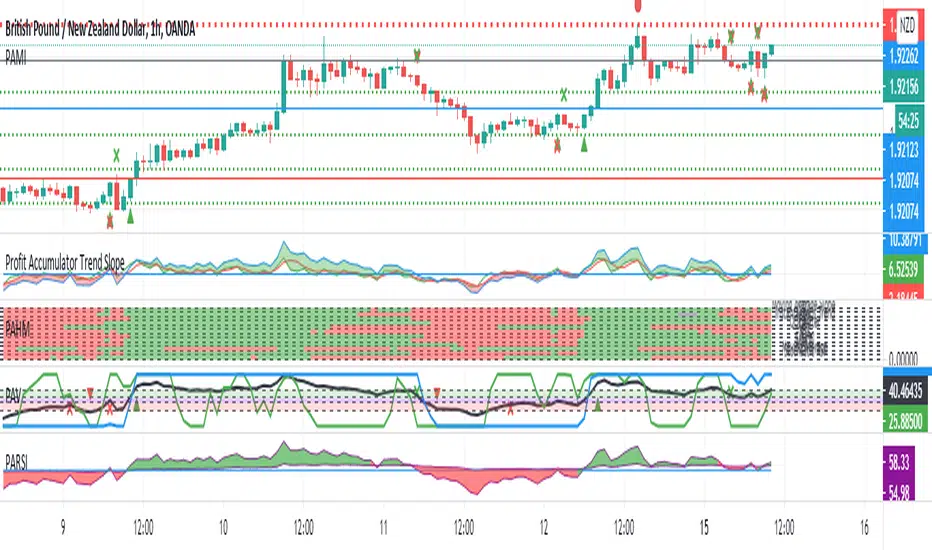
Profit Accumulator Trend SlopeI've been getting very good results with this indicator, using it in conjunction with the Profit Accumulator Main Indicator.
This indicator uses a number of methods for detecting reversals and the start of new trends.
The basis is simple in that when the trend lines cross above the zero line, it indicates a possible long entry and crossing below the zero line, indicates a possible short entry.
The strongest signal is when they all cross the zero line in one timeframe.
In terms of options/settings, I've included the following:
Multiple Timeframe
Changing the lengths.
I've also added an alert option for when the lines cross the zero line.
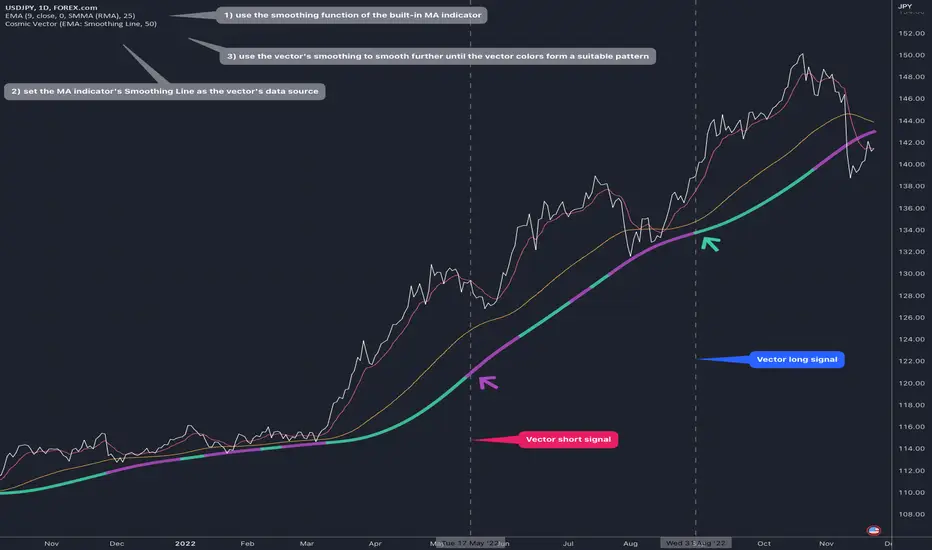
Cosmic VectorThis indicator will copy a moving average's plot and show whether its angle vector is negative or positive. In other words, it will show when the moving average starts to "accelerate" / "decelerate".
To use:
Add any moving average indicator to the chart
Click that indicator's More > Add Indicator on (MA)
Select the Cosmic Angle Gravity indicator
Smooth First Derivative IndicatorIntroducing the Smooth First Derivative indicator. For each time step, the script numerically differentiates the price data using prior datapoints from the look-back window. The resulting time derivative (the rate of price change over time) is presented as a centered oscillator.
A first derivative is a versatile tool used in functional data analysis. When applied to price data, it can be applied to analyze momentum, confirm trend direction, and identify pivot points.
Model Description:
The model assumes that, within the look-back window, price data can be well approximated by a smooth differentiable function. The first derivative can then be computed numerically using a noise-robust one-sided differentiator. The current version of the script employs smooth differentiators developed by P. Holoborodko (www.holoborodko.com). Note that the Indicator should not be confused with Constance Brown's Derivative Oscillator.
Input parameter:
The Bandwidth parameter sets the number of points in the moving look-back window and thus determines the smoothness of the first derivative curve. Note that a smoother Indicator shows a greater lag.
Interpretation:
When using this Indicator, one should recall that the first derivative can simply be interpreted as the slope of the curve:
- The maximum (minimum) in the Indicator corresponds to the point at which the market experiences the maximum upward (downward) slope, i.e., the inflection point. The steeper the slope, the greater the Indicator value.
- The positive-to-negative zero-crossing in the Indicator suggests that the market has formed a local maximum (potential start of a downtrend or a period of consolidation). Likewise, a zero-crossing from negative to positive is a potential bullish signal.
DMI+ADX w/ Slope Colour & Fib LevelsThis is a DMI+ADX with colours based on the slope of the plot, with Fibonacci levels.
It makes it easier to see what is happening with a quick glance. I have also added Fib levels as an experiment, but when doing some backtesting they seem to line up reasonably well with past price movements. They can be used to see possible reversal areas, or as thresholds to gauge how strong the trend is. Fibs play a big role in the markets for some reason and I have seen them applied to more than PA with good results, but I know it will not fit into every strategy. The more standard settings for the thresholds are 25,50,75 and you can change them to those if you want, but I suggest taking a look at the Fib version first.
The ADX smoothing is set up for Crypto trading on Mid to High TFs. If you are trading sub 1hour charts I would suggest changing it to 3-4. If you are trading traditional markets it is probably a good idea to have it set somewhere between 6-14 (default is 14), but I am not a professional so please do your own testing and research.
Colours:
ADX going up = Green
ADX going down = Red
DMI+ going up = Bright Aqua
DMI+ going down = Turquoise / Dark Aqua
DMI- going up = Bright Purple
DMI- going down = Dark Purple
(if someone finds a better colour system please let me know as it is tricky to get it looking good without being unicorn puke)
This is my first script and I am just beginning to learn PineScript so somethings may have been done in an unorthodox manner but I believe everything is working as it should, however, I am happy to make any improvements. I'm interested in what people think of the Fib levels on this indicator and would love to hear people opinions and results in the comments.

Linear Regression Slope HistogramThis is the slope of linear regression plotted as a histogram. It has a threshold for the slope in case there is a minimum slope amount that the user wants for it to show green or red. The color shows a dim and bright effect depending on the direction of the slope to better show its rise and fall. You can set the length of the slope in the input setting screen.
Some interesting things about linear regression slope that I found out: It kind of looks like the histogram of ADX or the directional movement lines depending on the length used for the slope. According to Tushar Chande, linear regression can be used as an alternative of finding trend direction, although it is hard to say what length to use for it, I haven't been able to figure out a good way to apply it yet. According to Bulkowski, linear regression of the volume can be used with certain chart patterns that he listed to increase their chance of success by taking trades where the linear regression line points towards, so if you use volume as a source on this indicator you can take trades in whatever said direction. Got any other ideas on how to use linear regression? Feel free to let me knows, would gladly appreciate it.

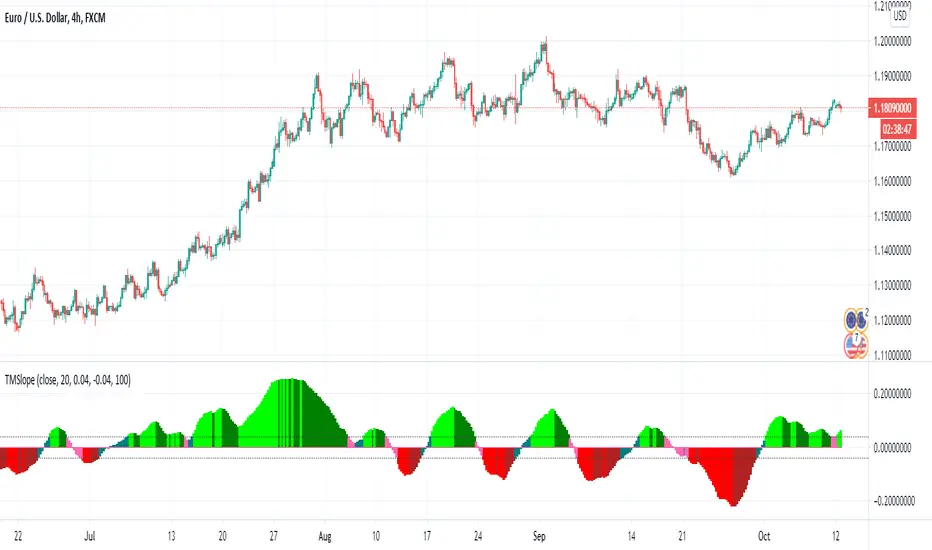
The TMA Slope - TMSlope Oscillator The TMA Slope oscillator is a simple slope of a Triangular Moving Average compared and normalized with the Average True Range of the last 100 periods (default setting).
This specific version add 2 triggers to give trading signals according to the slope:
- Above superior trigger, the trend is bullish, so trading is “Buy”
- Below inferior trigger, the trend is bearish, trading is “Sell”
- If the slope is included between these 2 levels, the market is probably ranging and no new orders should be initiated
3 MA w price slope The MA is indicating historical cost on the market.
This script will help you observe MA with price and slope.
This stript is inspired by LEI & LoneCapital.
All thanks to LEI.

Directional Movement IndexThis is a standard ADX DMI indicator with Background colour and the option to draw the Background colour of the next higher timeframe.
