Smartmoneyconcept

Smart Money Trap Scanner [TradingFinder]🔵 Introduction
In many market conditions, what initially seems to be a decisive breakout often turns out to be nothing more than a false breakout or fake move. Price breaks through a significant structural level, such as a swing high or low or a key support and resistance zone, only to quickly return to its previous range. These moves, often driven by liquidity traps or market manipulation, typically signal structural weakness rather than the start of a new trend.
This screener is specifically designed to detect such situations. It focuses on identifying false breakouts and price returns to broken levels within a defined time window, and then looks for retracements into the Fibonacci zone. If price reenters the 0.618 to 1.0 retracement area and aligns with the time-based filters, the system flags a low-risk, high-probability entry opportunity.
To enhance the precision of signal detection, the screener categorizes setups into two distinct types based on the speed of the price reaction after a breakout. Type A signals occur when the price breaks a level and immediately returns to break-even within the very next candle indicating a sharp rejection and rapid invalidation of the breakout. In contrast, Type B signals involve a more gradual return to the broken level, typically taking between two to five candles. This differentiation allows traders to better assess the context and urgency of each trap, providing a clearer understanding of momentum and liquidity behavior behind the move.
Additionally, the screener includes a Signal Age feature, which displays how much time has passed since the last valid signal was generated. This allows traders to quickly assess signal freshness and avoid acting on outdated setups, especially in fast-moving market environments.
One of the key advantages of this tool is its ability to simultaneously scan multiple symbols and timeframes. It only triggers an alert when all conditions false breakout, structural return, and Fibonacci alignment are met. This allows traders to bypass the need for manually reviewing dozens of charts and instead concentrate on clean, valid, and structure-based setups with greater precision.
🔵 How to Use
This tool operates as a structure-based screener that continuously scans various symbols and timeframes. By combining price behavior analysis, structural breakout detection, and Fibonacci retracement zones, it only signals entries when the probability of reversal is significantly supported by liquidity logic and price correction depth.
The system doesn’t just monitor price movements beyond key levels like swing highs or lows. It also evaluates whether the move quickly reverses and absorbs liquidity. If so, Fibonacci is applied to measure the depth of the pullback and identify the most favorable entry zones.
🟣 Long Signal
A long setup is triggered when price temporarily breaks below a valid structural support or swing low. This initial move is typically designed to trigger stop losses and collect sell-side liquidity. If price returns to the broken level within five candles, it is considered a false breakout.
At this point, Fibonacci is drawn from the recent swing high to the new low. If price enters the 0.618 to 1.0 retracement zone within the next ten candles, a potential long entry aligned with Smart Money logic is activated. This deep retracement zone often offers the best low-risk entry, as it typically marks the area where liquidity has been absorbed and the breakout structure has failed.
The stop loss is placed slightly below the 1.0 level to account for minor fluctuations, while the target is set based on trend structure or risk-reward preferences.
🟣 Short Signal
A short setup begins with price temporarily breaking above a valid resistance or swing high. This breakout is often driven by buy-side liquidity collection or stop hunting. If price returns to the broken level within five candles, the move is marked as a breakout failure.
Fibonacci is then drawn from the recent swing low to the new high. If price enters the 0.618 to 1.0 zone within ten candles after the return, a short opportunity is confirmed. This area usually represents the maximum acceptable retracement before a continuation move to the downside and often triggers strong reactions.
The stop loss is placed just above the 1.0 level, and the target is defined based on the expected structure of the move or a predetermined reward ratio.
🟡 Advantages of the Screener
Unlike manual approaches that require constant monitoring of multiple charts, this tool functions as a fully automated screener across multiple symbols and timeframes. It continuously evaluates key levels, liquidity reactions, structural returns, and Fibonacci zones. An alert is only generated when all necessary conditions are met with high accuracy.
This ensures that traders avoid risky or misleading entries and stay focused on precise, verified, and logic-based setups — saving time, reducing noise, and improving consistency in decision-making.
🔵 Settings
🟣 Logical settings
Swing period : You can set the swing detection period.
Valid After Trigger Bars : Limits how many candles after a fake breakout the entry zone remains valid.
Max Swing Back Method : It is in two modes "All" and "Custom". If it is in "All" mode, it will check all swings, and if it is in "Custom" mode, it will check the swings to the extent you determine.
Max Swing Back : You can set the number of swings that will go back for checking.
🟣 Display Settings
Table on Chart : Allows users to choose the position of the signal dashboard either directly on the chart or below it, depending on their layout preference.
Number of Symbols : Enables users to control how many symbols are displayed in the screener table, from 10 to 20, adjustable in increments of 2 symbols for flexible screening depth.
Table Mode : This setting offers two layout styles for the signal table :
Basic : Mode displays symbols in a single column, using more vertical space.
Extended : Mode arranges symbols in pairs side-by-side, optimizing screen space with a more compact view.
Table Size : Lets you adjust the table’s visual size with options such as: auto, tiny, small, normal, large, huge.
Table Position : Sets the screen location of the table. Choose from 9 possible positions, combining vertical (top, middle, bottom) and horizontal (left, center, right) alignments.
🟣 Symbol Settings
Each of the 10 symbol slots comes with a full set of customizable parameters :
Symbol : Define or select the asset (e.g., XAUUSD, BTCUSD, EURUSD, etc.).
Timeframe : Set your desired timeframe for each symbol (e.g., 15, 60, 240, 1D).
🟣 Alert Settings
Alert : Enables alerts for SMT Screener.
Message Frequency : Determines the frequency of alerts. Options include 'All' (every function call), 'Once Per Bar' (first call within the bar), and 'Once Per Bar Close' (final script execution of the real-time bar). Default is 'Once per Bar'.
Show Alert Time by Time Zone : Configures the time zone for alert messages. Default is 'UTC'.
🔵 Conclusion
Many trading mistakes stem from misinterpreting price breaks and entering too early into deceptive moves. In a market environment where false breakouts, liquidity traps, and engineered movements are increasingly common, having a tool that accurately filters these events and frames them within a Fibonacci-based and time-filtered structure provides a real strategic edge.
This indicator merges market structure logic, false breakout detection, and precise retracement analysis to ensure trades are only taken when multiple technical factors are aligned. It not only enhances trade success rates but also helps avoid emotional or impulsive entries.
Moreover, with the ability to scan across several symbols and timeframes simultaneously, the tool goes beyond being just an indicator it becomes a semi-automated structural analysis system. For traders who base their decisions on price behavior, Smart Money logic, and structural retracements, this screener can become a key component of a disciplined and effective trading approach.
Skrip berbayar

Time Range Marker By BCB ElevateThe Time Range Marker is a simple yet powerful visual tool for traders who want to focus on specific time intervals within the trading day. This indicator highlights a custom time range on your chart using a background color, helping you visually isolate key trading sessions or event windows such as:
Market open/close hours
News release periods
High-volatility trading zones
Personal strategy testing windows
⚙️ Key Features:
Customizable start and end time (hour & minute)
Works across all intraday timeframes
Adjustable highlight color to match your chart theme
Built using Pine Script v5 for speed and flexibility
🔧 Settings:
Start Hour / Minute – Set the beginning of the time range (in 24-hour format)
End Hour / Minute – Define when the range ends
Highlight Color – Choose the background color for better visibility
🕒 Timezone Note:
The indicator uses UTC time by default to ensure accuracy across markets. If your broker uses a different timezone (like EST, IST, etc.), the script can be adjusted to reflect your local market hours.
✅ How to Use the Time Range Marker Indicator
This indicator is used to visually highlight a specific time window each trading day, such as:
Market open or close sessions (e.g., NYSE, London, Tokyo)
High-impact news release periods
Custom time slots for strategy testing or scalping
🛠️ Installation Steps
Open TradingView and go to any chart.
Click on Pine Editor at the bottom of the screen.
Copy and paste the full Pine Script (shared above) into the editor.
Click the “Add to Chart” ▶️ button.
The indicator will appear on the chart with a highlighted background during the time range you set.
⚙️ How to Customize the Time Range
After adding the indicator:
Click the gear icon ⚙️ next to the indicator’s name on the chart.
Adjust the following settings:
Start Hour / Start Minute: The beginning of your time range (in 24-hour format).
End Hour / End Minute: When the highlight should stop.
Highlight Color: Pick a color and transparency for visual clarity.
Click OK to apply changes.
🕒 Timezone Consideration
By default, the indicator uses UTC (Coordinated Universal Time).
To match your broker’s timezone (e.g., EST, IST, etc.), you'll need to adjust the script by changing:
sessStart = timestamp("Etc/UTC", ...)
sessEnd = timestamp("Etc/UTC", ...)
to your correct timezone, like "Asia/Kolkata" for IST or "America/New_York" for EST.
Let me know your broker or local timezone, and I’ll update it for you.
📈 Tips for Traders
Combine this with volume, price action, or breakout indicators to focus your strategy on high-probability time windows.
Use multiple versions of this script if you want to highlight more than one time range in a day.

SMT Divergences V2 [OutOfOptions]Smart Money Technique (SMT) Divergence is designed to identify discrepancies between correlated assets within the same timeframe. It occurs when two related assets exhibit opposing signals, such as one forming a higher low while the other forms a lower low. This technique is particularly useful for anticipating market shifts or reversals before they become evident through other Premium Discount (PD) Arrays.
This indicator works by identifying the highs and lows that have formed for an asset on the current chart and the correlated symbol defined in the settings. Once a pivot on either asset is formed, it checks if the pivot has taken liquidity as identified by the previous pivot in the same direction (i.e., a new high taking out a previous high). If this is the case and the corresponding asset has not taken a similar pivot, the condition is determined to be a potential valid divergence. The indicator will then filter out SMTs formed by adjacent candles, requiring at least one candle difference between the candles forming the SMT.
If the “Candle Direction Validation” setting is enabled, the indicator will further check both assets to ensure that for bullish SMTs, the last high on both assets was formed by down candle, and for bearish SMTs, the low was formed by an up candle. This check can often eliminate low-probability SMTs that are frequently broken.
The referenced chart shows divergence between Nasdaq (NQ) and S&P 500 (ES) futures, which are normally closely correlated assets that move in the same direction. The lines shown represent bullish and bearish divergences between the two when they are formed. As you can see from the chart, SMT Divergences may not always indicate a reversal, or a reversal might be just a short-term retrace. Therefore, SMT Divergences should not be used independently. However, in conjunction with other PD arrays, they can provide strong confirmation of a change in market direction.
Configurability:
Pivot strength - Indicates how many bars to the left/right of a high for pivot to be considered, recommended to keep at 1 for maximum detection speed
Candle Direction Validation - Additional SMT validation to filter out weak/low-probability SMTs be examining candle direction
Remove Broken SMTs - Keeps the chart clean by removing broken (invalidate) SMTs from the chart, once price moves beyond the outmost edge of the SMT
Work in Realtime - Enabled real-time mode for even faster detection of SMTs
Line Styling for Bullish/Bearish SMTs - Ability to customize line style, color & width for bullish/bearish SMTs
Label Control - Whether or not to show SMT label and if shown what font size & color should be used and if labels should include a tooltip containing information about the SMT
What makes this indicator different:
When used on NQ/ES it will automatically detect the matching the corresponding ticker, i.e. if you have chart on NQU2025 it'll automatically match to ESU2025 and vice-versa. Works for mini/micro/continuous contract
Unlike other SMT indicators, this indicator has an option to remove broken (no longer valid SMTs)
Allows real-time detection of SMTs prior to the pivot being fully formed
Allows validation of SMTs to only display high-probability SMTs, that are more likely to signal a possible reversal
Includes alerting capability for both SMT creation and when the SMT is broken (invalidated)

[TehThomas] - ICT Rejection BlocksWhat Are Rejection Blocks?
Rejection Blocks are price zones formed when a candle attempts to push through a level, gets rejected with force, and then closes in the opposite direction. This price action creates a “block” that reflects clear intent from smart money participants. These blocks are typically marked by a large wick that fails to close beyond a key high or low, followed by a body that closes back inside the previous range. The zone around the candle body becomes a footprint of where buyers or sellers aggressively stepped in, often defending that level with size.
Why Rejection Blocks Matter to Smart Money Traders
In any smart money model, understanding where large players are active is key. Rejection Blocks highlight exactly that. These zones often sit just above inducement highs or below engineered lows, where liquidity was taken before displacement occurred. By identifying where price got rejected with conviction, traders can spot the origin of institutional interest. These levels often act as magnets for retracement and can provide high-probability entries when price trades back into them. The best part is they often line up with other SMT elements like Fair Value Gaps, Breaker Blocks, or market structure shifts, allowing for strong confluence-based setups.
How the Indicator Works and Why It’s Effective
This script is designed to do one thing exceptionally well, automatically detect and display clean, high-quality rejection blocks. It filters out noise and only marks candles that meet strict rejection criteria. That means long wicks showing failed pushes, and bodies that close convincingly in the opposite direction. The indicator then draws a box over the candle body to mark the rejection zone. These boxes help map out areas where price is likely to react or stall in the future. By automating this process, the indicator saves time, improves consistency, and removes guesswork. You no longer have to manually scan charts or second-guess if a level is valid, the tool handles it for you.
What This Adds to Your Trading Workflow
This tool fits perfectly into any smart money strategy built around liquidity, displacement, and market structure. It helps you focus on the most meaningful zones, especially when price sweeps a high or low and leaves behind a reversal. Whether you trade breakouts, reversals, or liquidity setups, Rejection Blocks give you a visual confirmation of where price got turned away. They act as future entry zones, rejection points, or even stop placement areas. You can pair them with your Fair Value Gap entries, or use them to validate the direction of a shift in structure. This is the type of tool that simplifies your chart without losing precision.
Optimized for Focus and Clarity
There’s no clutter, no overload of options, and no distractions. Just clean, focused rejection zones that update in real-time. The boxes stay until invalidated, giving you a static map of relevant zones without recalculating on every bar. This makes it ideal for traders who want to plan entries, set alerts, or manage risk without redrawing levels every session. Whether you scalp on the 5M or swing trade using the 4H, this tool helps lock in the zones where price already told you something important, rejection with force.
Conclusion
The Rejection Blocks indicator is for traders who want cleaner charts, smarter levels, and more conviction behind every entry. It isolates zones where price showed clear rejection and turns them into actionable blocks that fit seamlessly into any smart money strategy. If you rely on liquidity sweeps, displacement, and reaction-based entries, this tool brings clarity and consistency to your edge. Just turn it on and let it show you where real rejection occurred.
Example of how to use it

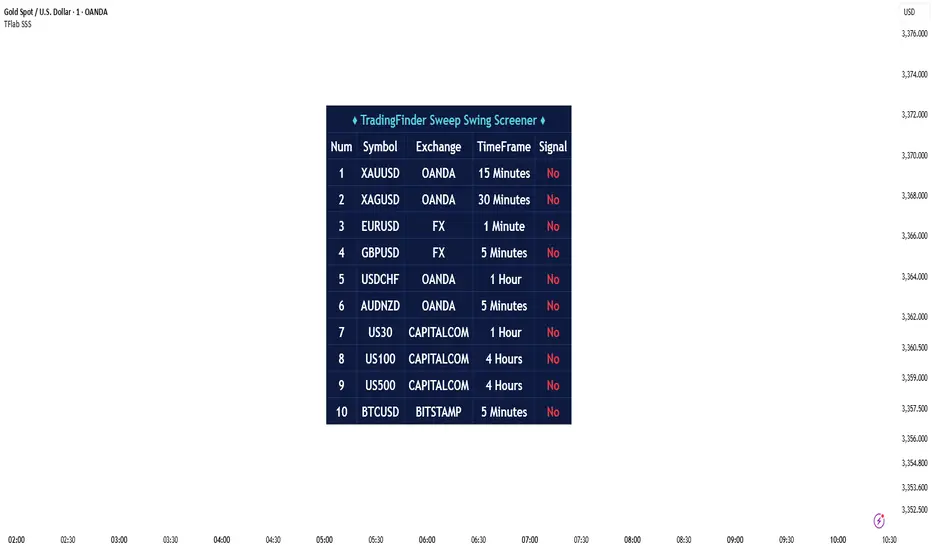
Sweep Swing Screener [TradingFinder]🔵 Introduction
Understanding how liquidity forms and how price reacts around key structural levels is essential for identifying precise, low-risk entry points. The Sweep Swing Screener is a specialized tool developed to continuously monitor market activity and detect liquidity sweeps, reaction zones, and valid confirmation candles across various trading instruments and timeframes.
This tool can be applied both to scan multiple symbols at once and to analyze all timeframes of a specific asset for potential reversal points. It begins by identifying a clear swing point, whether a swing high or a swing low, and then outlines a reaction zone between that level and either the highest or lowest value of the swing candle's open or close.
If the price revisits this zone, performs a liquidity grab, and prints an indecision candle like a doji or a narrow-bodied bar that closes within the zone, this may indicate a rejection of the level and the failure of a breakout attempt. At that moment, depending on the context, the screener may identify a bullish or bearish reversal and generate a corresponding Long or Short signal.
By emphasizing accurate entry timing, alignment with institutional order flow, and avoidance of common traps, this approach highlights market areas where liquidity engineering, reversal probability, and price inefficiency come together. As a result, the Sweep Swing Screener becomes a valuable part of any trader’s toolkit, particularly for those who rely on price action and liquidity logic to drive their decisions. It allows traders to focus on clean, actionable setups without getting lost in noise or misleading breakouts.
🔵 How to Use
The Sweep Swing Screener is designed to track market structure in real time and alert users when conditions for a potential reversal are present. Its methodology combines liquidity behavior with swing analysis and candle confirmation, all within predefined reaction zones.
To better understand this logic, consider a basic market flow where a swing high or low forms, followed by a return to that level. If the price sweeps the previous extreme and forms a confirming candle within the reaction zone, a signal is issued.
🟣 Long Signal
To identify a long setup, the screener looks for a valid swing low, often a level below which sell-side liquidity is likely to be clustered. Once found, it defines a reaction zone from the swing low to the lowest point between the candle’s open and close.
If the price returns to this area and creates a lower wick that extends beneath the swing low, the tool checks whether the price manages to close back inside the range, rejecting the breakdown. This indicates absorption of selling pressure and failure to sustain the move lower.
The screener then waits for a confirmation candle to appear. Typically, this is a doji or other small-bodied candle that closes inside the zone. If these conditions are met, the screener records a Long signal for that asset and, if enabled, sends a notification to alert the user.
🟣 Short Signal
For bearish setups, the screener begins by identifying a valid swing high, which usually marks a level where buy-side liquidity is concentrated. It then creates a reaction zone from the swing high to the highest point between the candle’s open and close.
When price returns to this level, sweeps above the swing high, and then fails to close higher, it may signal the presence of a bull trap and early exhaustion in the upward move.
A confirmation candle, usually a doji or a rejection bar that closes back within the zone, is then required. Once that occurs, the screener marks the asset with a Short signal and optionally sends a real-time alert to the user.
This type of setup helps highlight potential institutional sell zones, offering insight into where price is likely to reverse following a liquidity event.
🔵 Settings
🟣 Logical settings
Swing period : You can set the swing detection period.
Max Swing Back Method : It is in two modes "All" and "Custom". If it is in "All" mode, it will check all swings, and if it is in "Custom" mode, it will check the swings to the extent you determine.
Max Swing Back : You can set the number of swings that will go back for checking.
Maximum Distance Between Swing and Signal : The maximum number of candles allowed between the swing point and the potential signal. The default value is 50, ensuring that only recent and relevant price reactions are considered valid.
🟣 Display Settings
Table Size : Lets you adjust the table’s visual size with options such as: auto, tiny, small, normal, large, huge.
Table Position : Sets the screen location of the table. Choose from 9 possible positions, combining vertical (top, middle, bottom) and horizontal (left, center, right) alignments.
🟣 Symbol Settings
Each of the 10 symbol slots comes with a full set of customizable parameters :
Symbol : Define or select the asset (e.g., XAUUSD, BTCUSD, EURUSD, etc.).
Timeframe : Set your desired timeframe for each symbol (e.g., 15, 60, 240, 1D).
🟣 Alert Settings
Alert : Enables alerts for SSS.
Message Frequency : Determines the frequency of alerts. Options include 'All' (every function call), 'Once Per Bar' (first call within the bar), and 'Once Per Bar Close' (final script execution of the real-time bar). Default is 'Once per Bar'.
Show Alert Time by Time Zone : Configures the time zone for alert messages. Default is 'UTC'.
🔵 Conclusion
The Sweep Swing Screener provides a systematic method for identifying potential reversal zones by combining price structure, liquidity behavior, and candle-based confirmation. In markets that are often noisy and full of failed breakouts, focusing on these three elements helps clarify directional bias and supports more confident decision-making.
With the ability to scan multiple symbols and timeframes efficiently, this tool allows traders to stay focused on high-quality setups without the need to manually sift through dozens of charts. The inclusion of optional alerts further enhances its utility by offering timely updates when criteria are met.
By moving away from reactive strategies and toward structural anticipation, this screener supports traders who align their methods with institutional logic and the mechanics of smart money.
Fair Value Gap Profiles [AlgoAlpha]🟠 OVERVIEW
This script draws and manages Fair Value Gap (FVG) zones by detecting unfilled gaps in price action and then augmenting them with intra-gap volume profiles from a lower timeframe. It is designed to help traders find potential areas where price may return to fill liquidity voids, and to provide extra detail about volume distribution inside each gap to assess strength and likely mitigation. The script automatically tracks each gap, updates its state over time, and can show which gaps are still unfilled or have been mitigated.
🟠 CONCEPTS
A Fair Value Gap is a zone between candles where no trades occurred, often seen as an inefficiency that price later revisits. The script checks each bar to see if a bullish (low above 2-bars-ago high) or bearish (high below 2-bars-ago low) gap has formed, and measures whether the gap’s size exceeds a threshold defined by a volatility-adjusted multiplier of past gap widths (to only detect significantly large gaps). Once a qualified gap is found, it gets recorded and visualized with a box that can stretch forward in time until filled. To add more context, a mini volume profile is built from a lower timeframe’s price and volume data, showing how volume is distributed inside the gap. The lowest-volume subzone is also highlighted using a sliding window scan method to visualise the true gap (area with least trading activity)
🟠 FEATURES
Visual gap boxes that appear automatically when bullish or bearish fair value gaps are detected on the chart.
Color-coded zones showing bullish gaps in one color and bearish gaps in another so you can easily see which side the gap favors.
Volume profile histograms plotted inside each gap using data from a lower timeframe, helping you see where volume concentrated inside the gap area.
Highlight of the lowest-volume subzone within each gap so you can spot areas price may target when filling the gap.
Dynamic extension of the gap boxes across the chart until price comes back and fills them, marking them as mitigated.
Customizable colors and transparency settings for gap boxes, profiles, and low-volume highlights to match your chart style.
Alerts that notify you when a new gap is created or when price fills an existing gap.
🟠 USAGE
This indicator helps you find and track unfilled price gaps that often act as magnets for price to revisit. You can use it to spot areas where liquidity may rest and plan entries or exits around these zones.
The colored gap boxes show you exactly where a fair value gap starts and ends, so you can anticipate potential pullbacks or continuations when price approaches them.
The intra-gap volume profile lets you gauge whether the gap was created on strong or thin participation, which can help judge how likely it is to be filled. The highlighted lowest-volume subzone shows where price might accelerate once inside the gap.
Traders often look for entries when price returns to a gap, aiming for a reaction or reversal in that area. You can also combine the mitigation alerts with your trade management to track when gaps have been closed and adjust your bias accordingly. Overall, the tool gives a clear visual reference for imbalance zones that can help structure trades around supply and demand dynamics.

Hodie Smart Inside BarThe Hodie Smart Inside Bar indicator automatically detects and visually highlights inside bars — candles fully contained within the range of the previous (parent) candle.
How the indicator works:
Inside Bar Identification:
The indicator analyzes each candle and checks if its high is lower than the previous candle’s high, and its low is higher than the previous candle’s low. If this condition is met, the candle is considered an inside bar.
Size Filtering:
To filter out small and insignificant consolidations, the indicator compares the size of the parent candle’s range to the inside bar’s range. Only if the parent candle is significantly larger (2 times or more — adjustable parameter), the inside bar is considered significant.
Zone Drawing:
For each detected inside bar, the indicator draws a rectangular zone bounded by the parent candle’s high and low. This zone automatically extends to the right as new bars appear until the price moves outside the parent candle’s range.
Zone Completion:
Once the price closes above the parent candle’s high or below its low, the zone is considered complete and stops extending.
Visual Aids:
If enabled, the indicator can shade the background of the current inside bar for additional visual emphasis.
A label with the text "IB" appears above the inside bar candle on the chart for easier identification.
Alerts:
Supports alerts when a new inside bar forms.
Alerts help traders notice important signals promptly.
To activate, create an alert on the indicator with the condition “New Inside Bar”.
Benefits of the Indicator:
Inside bars often signal consolidation and potential liquidity accumulation, which may be followed by a strong impulsive breakout. This indicator helps traders quickly identify consolidation zones and prepare for possible price moves.

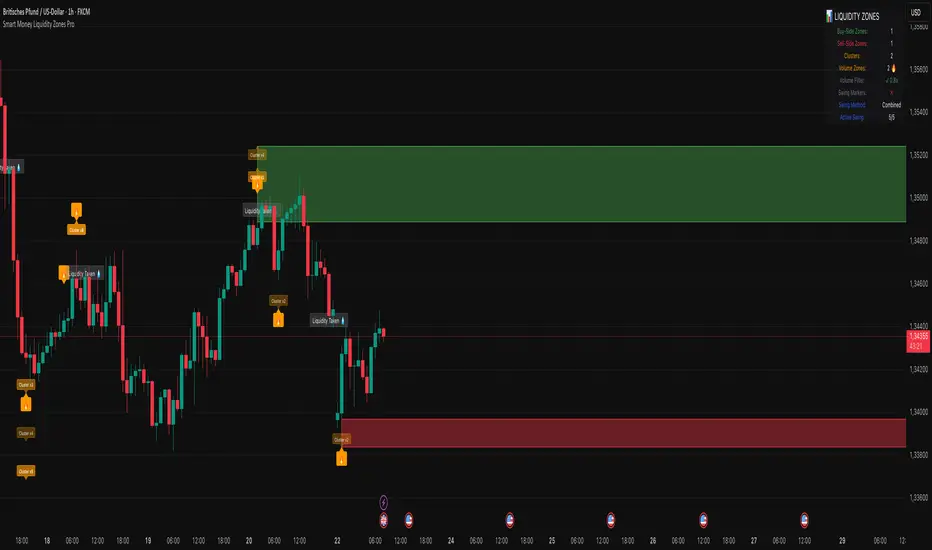
Smart Money Liquidity Zones ProThe Smart Money Liquidity Zones Pro indicator identifies and visualizes key liquidity areas in the market where institutional traders (smart money) are likely to have placed their stop-loss orders. These zones represent areas of high liquidity that often act as magnets for price, making them valuable reference points for trading decisions.
What the Indicator Does
Core Functionality
Swing Point Detection: The indicator identifies significant swing highs and lows using three different methods (Classic, Fractal, or Combined) to locate potential liquidity pools.
Liquidity Zone Creation: At each valid swing point, the indicator creates a horizontal zone representing an area where stop-loss orders are likely clustered.
Zone Clustering: When multiple swing points occur near the same price level, the indicator intelligently combines them into larger cluster zones, indicating stronger liquidity areas.
Volume Confirmation: The indicator can filter zones based on volume, showing only those swing points that occurred with significant trading volume.
Zone Break Detection: When price closes through a liquidity zone, the indicator marks it as "Liquidity Taken" and removes the zone from the chart.
Zone Types
Buy-Side Liquidity Zones (Green): Created at swing highs where short sellers' stop-losses are likely placed
Sell-Side Liquidity Zones (Red): Created at swing lows where long traders' stop-losses are likely placed
Trading Strategies
Basic Concepts
Liquidity Runs: Price often moves toward these zones to trigger stop-loss orders before reversing. This creates trading opportunities.
Support and Resistance: Unbroken liquidity zones can act as support (sell-side) or resistance (buy-side) levels.
Breakout Confirmation: When price breaks through a zone with strong momentum, it often continues in that direction.
Entry Strategies
Strategy 1: Liquidity Grab Reversa l
Wait for price to spike into a liquidity zone
Look for rejection candles (wicks) at the zone
Enter in the opposite direction after confirmation
Place stop-loss beyond the liquidity zone
Strategy 2: Zone Break Continuation
Wait for price to close decisively through a zone
Enter on the retest of the broken zone
Target the next liquidity zone in the direction of the break
Strategy 3: Zone Clustering Trade
Focus on areas with multiple overlapping zones (clusters)
These areas offer higher probability setups
Trade bounces from cluster zones with tighter risk management
Risk Management
Always use stop-losses beyond the liquidity zones
Consider the overall market context and trend
Zones on higher timeframes are generally more significant
Volume-confirmed zones have higher reliability
Settings Explanation
Swing Detection Settings
Swing Strength (Lookback Bars)
Determines how many bars to look back for swing point validation
Higher values find more significant swings but fewer zones
Recommended settings:
1m-5m charts: 3-5
15m-1h charts: 5-8
Daily charts: 5-10
Weekly charts: 3-5
Monthly charts: 2-3
Adaptive Swing Detection
Automatically adjusts swing detection based on available historical data
Prevents errors when there's limited chart history
Recommended to keep enabled
Minimum Bars for Swing
Sets the absolute minimum bars required for swing detection
Lower values allow detection in limited data conditions
Swing Detection Method
Classic: Strict price comparison for pure swing highs/lows
Fractal: Williams Fractal pattern (2 bars on each side)
Combined: Uses both methods for maximum zone detection
Auto-Adjust for Timeframe
Automatically optimizes settings based on chart timeframe
Prevents inappropriate settings on higher timeframes
Zone Settings
Max Number of Visible Zones
Limits the number of zones displayed to prevent chart clutter
Older zones are automatically removed
Max Zone Duration (Bars)
Zones older than this are automatically deleted
Keeps the chart focused on recent liquidity areas
Enable Zone Clustering
Groups nearby zones into larger clusters
Identifies stronger liquidity areas
Cluster Threshold (%)
Maximum price distance for zones to be clustered
Lower values create tighter clusters
Show Cluster Labels
Displays "Cluster x2", "Cluster x3" etc. on grouped zones
Volume Filter Settings
Enable Volume Filter
When enabled, only creates zones at high-volume swing points
Increases zone quality but reduces quantity
Volume Multiplier
Multiplier for average volume to determine "high volume"
Lower values (0.7-0.9) create more zones
Higher values (1.2+) create fewer, higher-quality zones
Volume SMA Period
Period for calculating average volume
Higher values create smoother volume baseline
Show Volume Confirmation Icon
Displays a fire emoji on volume-confirmed zones
Volume Visualization Settings
Show Volume Dots
Displays dots below high-volume bars
Dynamic Zone Colors
Volume-confirmed zones appear with more intense colors
Show Volume Background
Highlights the chart background on high-volume bars
Visual Settings
Buy-Side/Sell-Side Zone Colors
Customize colors for long and short liquidity zones
Border Width
Thickness of zone borders (1-3)
Show 'Liquidity Taken' Labels
Displays labels when zones are broken
Label Size
Size of the liquidity taken labels
Show Swing Point Markers
Displays triangles at detected swing points
Show Debug Info
Shows diagnostic information for troubleshooting
Dashboard Settings
Show Dashboard
Toggles the information panel display
Dashboard Position
Choose from 6 positions on the chart
Background Color
Dashboard background color
Text Color
Dashboard text color
Text Size
Dashboard text size (tiny/small/normal/large)
Tips for Effective Use
Start with default settings and adjust based on your trading style and timeframe
Use multiple timeframes to identify confluence between zones on different scales
Combine with other indicators like trend analysis or momentum oscillators
Pay attention to clusters as they represent stronger liquidity areas
Monitor volume-confirmed zones for higher probability setups
Adjust zone duration based on your trading timeframe (shorter for scalping, longer for swing trading)
Use the debug feature if zones aren't appearing to understand why
Keep the chart clean by limiting the number of visible zones
Common Issues and Solutions
No zones appearing:
Lower the Swing Strength setting
Switch to Combined detection method
Disable volume filter if active
Check if there's enough historical data
Too many zones:
Increase Swing Strength
Enable volume filter
Reduce Max Number of Visible Zones
Increase Cluster Threshold
Zones disappearing too quickly:
Increase Max Zone Duration
Check if zones are being broken by price
Poor performance on higher timeframes:
Enable Auto-Adjust for Timeframe
Use appropriate Swing Strength for the timeframe
Consider using Classic method instead of Fractal
PriceLevels GBGoldbach Price Levels – Identify Algorithmic Key Zones
This open-source indicator is designed to help traders identify potential algorithmic key zones by highlighting price levels ending with specific numbers such as 03, 11, 29, 35, 65, and 71. These levels may act as inflection points or hesitation areas based on observed behavioral patterns in price movement.
What It Does:
📌 Scans and plots horizontal price levels where the price ends with one of the selected number combinations
🎯 Toggle on/off visibility for each number ending
🎨 Customize color and thickness for each level
🏷️ Shows price labels at the end of each line
🌗 Label styles (color/transparency) are adjustable for both dark and light chart themes
🧠 Why Use It:
This tool is ideal for discretionary traders who study market structure through static price anchors. It provides a visual reference for recurring numerical levels that may be used in algorithmic trading models or serve as psychological price zones.
⚠️ Disclaimer:
This script is open-source and intended for educational and analytical purposes only. No trading signals or performance guarantees are provided. Please use your own judgment when applying this tool in a trading context.

FVG Premium [no1x]█ OVERVIEW
This indicator provides a comprehensive toolkit for identifying, visualizing, and tracking Fair Value Gaps (FVGs) across three distinct timeframes (current chart, a user-defined Medium Timeframe - MTF, and a user-defined High Timeframe - HTF). It is designed to offer traders enhanced insight into FVG dynamics through detailed state monitoring (formation, partial fill, full mitigation, midline touch), extensive visual customization for FVG representation, and a rich alert system for timely notifications on FVG-related events.
█ CONCEPTS
This indicator is built upon the core concept of Fair Value Gaps (FVGs) and their significance in price action analysis, offering a multi-layered approach to their detection and interpretation across different timeframes.
Fair Value Gaps (FVGs)
A Fair Value Gap (FVG), also known as an imbalance, represents a range in price delivery where one side of the market (buying or selling) was more aggressive, leaving an inefficiency or an "imbalance" in the price action. This concept is prominently featured within Smart Money Concepts (SMC) and Inner Circle Trader (ICT) methodologies, where such gaps are often interpreted as footprints left by "smart money" due to rapid, forceful price movements. These methodologies suggest that price may later revisit these FVG zones to rebalance a prior inefficiency or to seek liquidity before continuing its path. These gaps are typically identified by a three-bar pattern:
Bullish FVG : This is a three-candle formation where the second candle shows a strong upward move. The FVG is the space created between the high of the first candle (bottom of FVG) and the low of the third candle (top of FVG). This indicates a strong upward impulsive move.
Bearish FVG : This is a three-candle formation where the second candle shows a strong downward move. The FVG is the space created between the low of the first candle (top of FVG) and the high of the third candle (bottom of FVG). This indicates a strong downward impulsive move.
FVGs are often watched by traders as potential areas where price might return to "rebalance" or find support/resistance.
Multi-Timeframe (MTF) Analysis
The indicator extends FVG detection beyond the current chart's timeframe (Low Timeframe - LTF) to two higher user-defined timeframes: Medium Timeframe (MTF) and High Timeframe (HTF). This allows traders to:
Identify FVGs that might be significant on a broader market structure.
Observe how FVGs from different timeframes align or interact.
Gain a more comprehensive perspective on potential support and resistance zones.
FVG State and Lifecycle Management
The indicator actively tracks the lifecycle of each detected FVG:
Formation : The initial identification of an FVG.
Partial Fill (Entry) : When price enters but does not completely pass through the FVG. The indicator updates the "current" top/bottom of the FVG to reflect the filled portion.
Midline (Equilibrium) Touch : When price touches the 50% level of the FVG.
Full Mitigation : When price completely trades through the FVG, effectively "filling" or "rebalancing" the gap. The indicator records the mitigation time.
This state tracking is crucial for understanding how price interacts with these zones.
FVG Classification (Large FVG)
FVGs can be optionally classified as "Large FVGs" (LV) if their size (top to bottom range) exceeds a user-defined multiple of the Average True Range (ATR) for that FVG's timeframe. This helps distinguish FVGs that are significantly larger relative to recent volatility.
Visual Customization and Information Delivery
A key concept is providing extensive control over how FVGs are displayed. This control is achieved through a centralized set of visual parameters within the indicator, allowing users to configure numerous aspects (colors, line styles, visibility of boxes, midlines, mitigation lines, labels, etc.) for each timeframe. Additionally, an on-chart information panel summarizes the nearest unmitigated bullish and bearish FVG levels for each active timeframe, providing a quick glance at key price points.
█ FEATURES
This indicator offers a rich set of features designed to provide a highly customizable and comprehensive Fair Value Gap (FVG) analysis experience. Users can tailor the FVG detection, visual representation, and alerting mechanisms across three distinct timeframes: the current chart (Low Timeframe - LTF), a user-defined Medium Timeframe (MTF), and a user-defined High Timeframe (HTF).
Multi-Timeframe FVG Detection and Display
The core strength of this indicator lies in its ability to identify and display FVGs from not only the current chart's timeframe (LTF) but also from two higher, user-selectable timeframes (MTF and HTF).
Timeframe Selection: Users can specify the exact MTF (e.g., "60", "240") and HTF (e.g., "D", "W") through dedicated inputs in the "MTF (Medium Timeframe)" and "HTF (High Timeframe)" settings groups. The visibility of FVGs from these higher timeframes can be toggled independently using the "Show MTF FVGs" and "Show HTF FVGs" checkboxes.
Consistent Detection Logic: The FVG detection logic, based on the classic three-bar imbalance pattern detailed in the 'Concepts' section, is applied consistently across all selected timeframes (LTF, MTF, HTF)
Timeframe-Specific Visuals: Each timeframe's FVGs (LTF, MTF, HTF) can be customized with unique colors for bullish/bearish states and their mitigated counterparts. This allows for easy visual differentiation of FVGs originating from different market perspectives.
Comprehensive FVG Visualization Options
The indicator provides extensive control over how FVGs are visually represented on the chart for each timeframe (LTF, MTF, HTF).
FVG Boxes:
Visibility: Main FVG boxes can be shown or hidden per timeframe using the "Show FVG Boxes" (for LTF), "Show Boxes" (for MTF/HTF) inputs.
Color Customization: Colors for bullish, bearish, active, and mitigated FVG boxes (including Large FVGs, if classified) are fully customizable for each timeframe.
Box Extension & Length: FVG boxes can either be extended to the right indefinitely ("Extend Boxes Right") or set to a fixed length in bars ("Short Box Length" or "Box Length" equivalent inputs).
Box Labels: Optional labels can display the FVG's timeframe and fill percentage on the box. These labels are configurable for all timeframes (LTF, MTF, and HTF). Please note: If FVGs are positioned very close to each other on the chart, their respective labels may overlap. This can potentially lead to visual clutter, and it is a known behavior in the current version of the indicator.
Box Borders: Visibility, width, style (solid, dashed, dotted), and color of FVG box borders are customizable per timeframe.
Midlines (Equilibrium/EQ):
Visibility: The 50% level (midline or EQ) of FVGs can be shown or hidden for each timeframe.
Style Customization: Width, style, and color of the midline are customizable per timeframe. The indicator tracks if this midline has been touched by price.
Mitigation Lines:
Visibility: Mitigation lines (representing the FVG's opening level that needs to be breached for full mitigation) can be shown or hidden for each timeframe. If shown, these lines are always extended to the right.
Style Customization: Width, style, and color of the mitigation line are customizable per timeframe.
Mitigation Line Labels: Optional price labels can be displayed on mitigation lines, with a customizable horizontal bar offset for positioning. For optimal label placement, the following horizontal bar offsets are recommended: 4 for LTF, 8 for MTF, and 12 for HTF.
Persistence After Mitigation: Users can choose to keep mitigation lines visible even after an FVG is fully mitigated, with a distinct color for such lines. Importantly, this option is only effective if the general setting 'Hide Fully Mitigated FVGs' is disabled, as otherwise, the entire FVG and its lines will be removed upon mitigation.
FVG State Management and Behavior
The indicator tracks and visually responds to changes in FVG states.
Hide Fully Mitigated FVGs: This option, typically found in the indicator's general settings, allows users to automatically remove all visual elements of an FVG from the chart once price has fully mitigated it. This helps maintain chart clarity by focusing on active FVGs.
Partial Fill Visualization: When price enters an FVG, the indicator offers a dynamic visual representation: the portion of the FVG that has been filled is shown as a "mitigated box" (typically with a distinct color), while the original FVG box shrinks to clearly highlight the remaining, unfilled portion. This two-part display provides an immediate visual cue about how much of the FVG's imbalance has been addressed and what potential remains within the gap.
Visual Filtering by ATR Proximity: To help users focus on the most relevant price action, FVGs can be dynamically hidden if they are located further from the current price than a user-defined multiple of the Average True Range (ATR). This behavior is controlled by the "Filter Band Width (ATR Multiple)" input; setting this to zero disables the filter entirely, ensuring all detected FVGs remain visible regardless of their proximity to price.
Alternative Usage Example: Mitigation Lines as Key Support/Resistance Levels
For traders preferring a minimalist chart focused on key Fair Value Gap (FVG) levels, the indicator's visualization settings can be customized to display only FVG mitigation lines. This approach leverages these lines as potential support and resistance zones, reflecting areas where price might revisit to address imbalances.
To configure this view:
Disable FVG Boxes: Turn off "Show FVG Boxes" (for LTF) or "Show Boxes" (for MTF/HTF) for the desired timeframes.
Hide Midlines: Disable the visibility of the 50% FVG Midlines (Equilibrium/EQ).
Ensure Mitigation Lines are Visible: Keep "Mitigation Lines" enabled.
Retain All Mitigation Lines:
Disable the "Hide Fully Mitigated FVGs" option in the general settings.
Enable the feature to "keep mitigation lines visible even after an FVG is fully mitigated". This ensures lines from all FVGs (active or fully mitigated) remain on the chart, which is only effective if "Hide Fully Mitigated FVGs" is disabled.
This setup offers:
A Decluttered Chart: Focuses solely on the FVG opening levels.
Precise S/R Zones: Treats mitigation lines as specific points for potential price reactions.
Historical Level Analysis: Includes lines from past, fully mitigated FVGs for a comprehensive view of significant price levels.
For enhanced usability with this focused view, consider these optional additions:
The on-chart Information Panel can be activated to display a quick summary of the nearest unmitigated FVG levels.
Mitigation Line Labels can also be activated for clear price level identification. A customizable horizontal bar offset is available for positioning these labels; for example, offsets of 4 for LTF, 8 for MTF, and 12 for HTF can be effective.
FVG Classification (Large FVG)
This feature allows for distinguishing FVGs based on their size relative to market volatility.
Enable Classification: Users can enable "Classify FVG (Large FVG)" to identify FVGs that are significantly larger than average.
ATR-Based Threshold: An FVG is classified as "Large" if its height (price range) is greater than or equal to the Average True Range (ATR) of its timeframe multiplied by a user-defined "Large FVG Threshold (ATR Multiple)". The ATR period for this calculation is also configurable.
Dedicated Colors: Large FVGs (both bullish/bearish and active/mitigated) can be assigned unique colors, making them easily distinguishable on the chart.
Panel Icon: Large FVGs are marked with a special icon in the Info Panel.
Information Panel
An on-chart panel provides a quick summary of the nearest unmitigated FVG levels.
Visibility and Position: The panel can be shown/hidden and positioned in any of the nine standard locations on the chart (e.g., Top Right, Middle Center).
Content: It displays the price levels of the nearest unmitigated bullish and bearish FVGs for LTF, MTF (if active), and HTF (if active). It also indicates if these nearest FVGs are Large FVGs (if classification is enabled) using a selectable icon.
Styling: Text size, border color, header background/text colors, default text color, and "N/A" cell background color are customizable.
Highlighting: Background and text colors for the cells displaying the overall nearest bullish and bearish FVG levels (across all active timeframes) can be customized to draw attention to the most proximate FVG.
Comprehensive Alert System
The indicator offers a granular alert system for various FVG-related events, configurable for each timeframe (LTF, MTF, HTF) independently. Users can enable alerts for:
New FVG Formation: Separate alerts for new bullish and new bearish FVG formations.
FVG Entry/Partial Fill: Separate alerts for price entering a bullish FVG or a bearish FVG.
FVG Full Mitigation: Separate alerts for full mitigation of bullish and bearish FVGs.
FVG Midline (EQ) Touch: Separate alerts for price touching the midline of a bullish or bearish FVG.
Alert messages are detailed, providing information such as the timeframe, FVG type (bull/bear, Large FVG), relevant price levels, and timestamps.
█ NOTES
This section provides additional information regarding the indicator's usage, performance considerations, and potential interactions with the TradingView platform. Understanding these points can help users optimize their experience and troubleshoot effectively.
Performance and Resource Management
Maximum FVGs to Track : The "Max FVGs to Track" input (defaulting to 25) limits the number of FVG objects processed for each category (e.g., LTF Bullish, MTF Bearish). Increasing this value significantly can impact performance due to more objects being iterated over and potentially drawn, especially when multiple timeframes are active.
Drawing Object Limits : To manage performance, this script sets its own internal limits on the number of drawing objects it displays. While it allows for up to approximately 500 lines (max_lines_count=500) and 500 labels (max_labels_count=500), the number of FVG boxes is deliberately restricted to a maximum of 150 (max_boxes_count=150). This specific limit for boxes is a key performance consideration: displaying too many boxes can significantly slow down the indicator, and a very high number is often not essential for analysis. Enabling all visual elements for many FVGs across all three timeframes can cause the indicator to reach these internal limits, especially the stricter box limit
Optimization Strategies : To help you manage performance, reduce visual clutter, and avoid exceeding drawing limits when using this indicator, I recommend the following strategies:
Maintain or Lower FVG Tracking Count: The "Max FVGs to Track" input defaults to 25. I find this value generally sufficient for effective analysis and balanced performance. You can keep this default or consider reducing it further if you experience performance issues or prefer a less dense FVG display.
Utilize Proximity Filtering: I suggest activating the "Filter Band Width (ATR Multiple)" option (found under "General Settings") to display only those FVGs closer to the current price. From my experience, a value of 5 for the ATR multiple often provides a good starting point for balanced performance, but you should feel free to adjust this based on market volatility and your specific trading needs.
Hide Fully Mitigated FVGs: I strongly recommend enabling the "Hide Fully Mitigated FVGs" option. This setting automatically removes all visual elements of an FVG from the chart once it has been fully mitigated by price. Doing so significantly reduces the number of active drawing objects, lessens computational load, and helps maintain chart clarity by focusing only on active, relevant FVGs.
Disable FVG Display for Unused Timeframes: If you are not actively monitoring certain higher timeframes (MTF or HTF) for FVG analysis, I advise disabling their display by unchecking "Show MTF FVGs" or "Show HTF FVGs" respectively. This can provide a significant performance boost.
Simplify Visual Elements: For active FVGs, consider hiding less critical visual elements if they are not essential for your specific analysis. This could include box labels, borders, or even entire FVG boxes if, for example, only the mitigation lines are of interest for a particular timeframe.
Settings Changes and Platform Limits : This indicator is comprehensive and involves numerous calculations and drawings. When multiple settings are changed rapidly in quick succession, it is possible, on occasion, for TradingView to issue a "Runtime error: modify_study_limit_exceeding" or similar. This can cause the indicator to temporarily stop updating or display errors.
Recommended Approach : When adjusting settings, it is advisable to wait a brief moment (a few seconds) after each significant change. This allows the indicator to reprocess and update on the chart before another change is made
Error Recovery : Should such a runtime error occur, making a minor, different adjustment in the settings (e.g., toggling a checkbox off and then on again) and waiting briefly will typically allow the indicator to recover and resume correct operation. This behavior is related to platform limitations when handling complex scripts with many inputs and drawing objects.
Multi-Timeframe (MTF/HTF) Data and Behavior
HTF FVG Confirmation is Essential: : For an FVG from a higher timeframe (MTF or HTF) to be identified and displayed on your current chart (LTF), the three-bar pattern forming the FVG on that higher timeframe must consist of fully closed bars. The indicator does not draw speculative FVGs based on incomplete/forming bars from higher timeframes.
Data Retrieval and LTF Processing: The indicator may use techniques like lookahead = barmerge.lookahead_on for timely data retrieval from higher timeframes. However, the actual detection of an FVG occurs after all its constituent bars on the HTF have closed.
Appearance Timing on LTF (1 LTF Candle Delay): As a natural consequence of this, an FVG that is confirmed on an HTF (i.e., its third bar closes) will typically become visible on your LTF chart one LTF bar after its confirmation on the HTF.
Example: Assume an FVG forms on a 30-minute chart at 15:30 (i.e., with the close of the 30-minute bar that covers the 15:00-15:30 period). If you are monitoring this FVG on a 15-minute chart, the indicator will detect this newly formed 30-minute FVG while processing the data for the 15-minute bar that starts at 15:30 and closes at 15:45. Therefore, the 30-minute FVG will become visible on your 15-minute chart at the earliest by 15:45 (i.e., with the close of that relevant 15-minute LTF candle). This means the HTF FVG is reflected on the LTF chart with a delay equivalent to one LTF candle.
FVG Detection and Display Logic
Fair Value Gaps (FVGs) on the current chart timeframe (LTF) are detected based on barstate.isconfirmed. This means the three-bar pattern must be complete with closed bars before an FVG is identified. This confirmation method prevents FVGs from being prematurely identified on the forming bar.
Alerts
Alert Setup : To receive alerts from this indicator, you must first ensure you have enabled the specific alert conditions you are interested in within the indicator's own settings (see 'Comprehensive Alert System' under the 'FEATURES' section). Once configured, open TradingView's 'Create Alert' dialog. In the 'Condition' tab, select this indicator's name, and crucially, choose the 'Any alert() function call' option from the dropdown list. This setup allows the indicator to trigger alerts based on the precise event conditions you have activated in its settings
Alert Frequency : Alerts are designed to trigger once per bar close (alert.freq_once_per_bar_close) for the specific event.
User Interface (UI) Tips
Settings Group Icons: In the indicator settings menu, timeframe-specific groups are marked with star icons for easier navigation: 🌟 for LTF (Current Chart Timeframe), 🌟🌟 for MTF (Medium Timeframe), and 🌟🌟🌟 for HTF (High Timeframe).
Dependent Inputs: Some input settings are dependent on others being enabled. These dependencies are visually indicated in the settings menu using symbols like "↳" (dependent setting on the next line), "⟷" (mutually exclusive inline options), or "➜" (directly dependent inline option).
Settings Layout Overview: The indicator settings are organized into logical groups for ease of use. Key global display controls – such as toggles for MTF FVGs, HTF FVGs (along with their respective timeframe selectors), and the Information Panel – are conveniently located at the very top within the '⚙️ General Settings' group. This placement allows for quick access to frequently adjusted settings. Other sections provide detailed customization options for each timeframe (LTF, MTF, HTF), specific FVG components, and alert configurations.
█ FOR Pine Script® CODERS
This section provides a high-level overview of the FVG Premium indicator's internal architecture, data flow, and the interaction between its various library components. It is intended for Pine Script™ programmers who wish to understand the indicator's design, potentially extend its functionality, or learn from its structure.
System Architecture and Modular Design
The indicator is architected moduarly, leveraging several custom libraries to separate concerns and enhance code organization and reusability. Each library has a distinct responsibility:
FvgTypes: Serves as the foundational data definition layer. It defines core User-Defined Types (UDTs) like fvgObject (for storing all attributes of an FVG) and drawSettings (for visual configurations), along with enumerations like tfType.
CommonUtils: Provides utility functions for common tasks like mapping user string inputs (e.g., "Dashed" for line style) to their corresponding Pine Script™ constants (e.g., line.style_dashed) and formatting timeframe strings for display.
FvgCalculations: Contains the core logic for FVG detection (both LTF and MTF/HTF via requestMultiTFBarData), FVG classification (Large FVGs based on ATR), and checking FVG interactions with price (mitigation, partial fill).
FvgObject: Implements an object-oriented approach by attaching methods to the fvgObject UDT. These methods manage the entire visual lifecycle of an FVG on the chart, including drawing, updating based on state changes (e.g., mitigation), and deleting drawing objects. It's responsible for applying the visual configurations defined in drawSettings.
FvgPanel: Manages the creation and dynamic updates of the on-chart information panel, which displays key FVG levels.
The main indicator script acts as the orchestrator, initializing these libraries, managing user inputs, processing data flow between libraries, and handling the main event loop (bar updates) for FVG state management and alerts.
Core Data Flow and FVG Lifecycle Management
The general data flow and FVG lifecycle can be summarized as follows:
Input Processing: User inputs from the "Settings" dialog are read by the main indicator script. Visual style inputs (colors, line styles, etc.) are consolidated into a types.drawSettings object (defined in FvgTypes). Other inputs (timeframes, filter settings, alert toggles) control the behavior of different modules. CommonUtils assists in mapping some string inputs to Pine constants.
FVG Detection:
For the current chart timeframe (LTF), FvgCalculations.detectFvg() identifies potential FVGs based on bar patterns.
For MTF/HTF, the main indicator script calls FvgCalculations.requestMultiTFBarData() to fetch necessary bar data from higher timeframes, then FvgCalculations.detectMultiTFFvg() identifies FVGs.
Newly detected FVGs are instantiated as types.fvgObject and stored in arrays within the main script. These objects also undergo classification (e.g., Large FVG) by FvgCalculations.
State Update & Interaction: On each bar, the main indicator script iterates through active FVG objects to manage their state based on price interaction:
Initially, the main script calls FvgCalculations.fvgInteractionCheck() to efficiently determine if the current bar's price might be interacting with a given FVG.
If a potential interaction is flagged, the main script then invokes methods directly on the fvgObject instance (e.g., updateMitigation(), updatePartialFill(), checkMidlineTouch(), which are part of FvgObject).
These fvgObject methods are responsible for the detailed condition checking and the actual modification of the FVG's state. For instance, the updateMitigation() and updatePartialFill() methods internally utilize specific helper functions from FvgCalculations (like checkMitigation() and checkPartialMitigation()) to confirm the precise nature of the interaction before updating the fvgObject’s state fields (such as isMitigated, currentTop, currentBottom, or isMidlineTouched).
Visual Rendering:
The FvgObject.updateDrawings() method is called for each fvgObject. This method is central to drawing management; it creates, updates, or deletes chart drawings (boxes, lines, labels) based on the FVG's current state, its prev_* (previous bar state) fields for optimization, and the visual settings passed via the drawSettings object.
Information Panel Update: The main indicator script determines the nearest FVG levels, populates a panelData object (defined in FvgPanelLib), and calls FvgPanel.updatePanel() to refresh the on-chart display.
Alert Generation: Based on the updated FVG states and user-enabled alert settings, the main indicator script constructs and triggers alerts using Pine Script's alert() function."
Key Design Considerations
UDT-Centric Design: The fvgObject UDT is pivotal, acting as a stateful container for all information related to a single FVG. Most operations revolve around creating, updating, or querying these objects.
State Management: To optimize drawing updates and manage FVG lifecycles, fvgObject instances store their previous bar's state (e.g., prevIsVisible, prevCurrentTop). The FvgObject.updateDrawings() method uses this to determine if a redraw is necessary, minimizing redundant drawing calls.
Settings Object: A drawSettings object is populated once (or when inputs change) and passed to drawing functions. This avoids repeatedly reading numerous input() values on every bar or within loops, improving performance.
Dynamic Arrays for FVG Storage: Arrays are used to store collections of fvgObject instances, allowing for dynamic management (adding new FVGs, iterating for updates).

FII SMART KEY LEVELSIntroducing the **Global Institutional Flow Indicator (GIFI)**—your all-in-one guide to the levels that matter most, powered by real-time foreign institutional activity. GIFI seamlessly adapts to any market—be it NSE and BSE equities, major cryptocurrencies, or the world’s most liquid forex pairs—so you never miss a beat.
Key Features:
Foreign Institutional Footprint
Tracks aggregated buy and sell volumes of FIIs (Foreign Institutional Investors) and equivalent large players across markets, highlighting where “smart money” is concentrating their capital.
* **Dynamic Support & Resistance Levels**
Automatically calculates high-conviction zones—zones where institutional orders have previously clustered—so you can pinpoint ultra-reliable levels for entries, exits, and stop placements.
* **Multi-Asset Compatibility**
One unified indicator that works out of the box on NSE and BSE stocks, top crypto tokens, and major FX crosses. No need to switch tools when you move between markets.
* **Trend-Aligned Signals**
Overlays institutional levels on your favorite trend filters—moving averages, ADX, or MACD—so you only trade in the direction that big players are committing.
* **Volume-Weighted Confirmation**
Confirms level-breaks and bounces with volume delta analysis, ensuring you’re following genuine institutional commitment rather than retail noise.
* **Adaptive Timeframes**
From 5-minute scalps to daily swing setups, GIFI adjusts its sensitivity so you capture the most meaningful levels on any timeframe.
**Why It Works:**
Foreign institutions often leave telltale footprints when they build or unwind positions at scale. GIFI decodes those footprints into actionable levels—revealing where the “smart money” is most willing to buy or sell. When price approaches one of these institutional zones, you gain:
* **Higher Probability Entries**
Enter trades alongside large-ticket players rather than against them.
* **Optimized Risk Management**
Place stops just beyond genuine institutional commitment zones, reducing the odds of false breakouts.
* **Clearer Exit Strategies**
Target profit levels where institutions are likely to take profits or enter fresh positions.
Whether you’re scalping Nifty futures, swing-trading mid-cap stocks, riding crypto trends, or trading EUR/USD, the Global Institutional Flow Indicator equips you with the insights you need to trade confidently—knowing you’re aligning with the forces that really move the markets.
Plyo Tap'n'Slap (TnS) by OutOfOptionsThe Model
This Strategy/Model takes advantage of the strongest trend signature in the market, which is also the most basic move in the market. This basic move is what most traders consider to be a staircase, or trendline. ICT traders call this setup a “unicorn” which is just another word for when an Order block overlaps with an FVG. The beauty of this model is that you don't need to know what ANY of these things are.
The entry comes when a candles High or Low overlaps with a FVG that is at least 3 points away from both edges of the FVG. If the candle is too close to the edge then the setups is invalid (see rules for more). TO find a candle that overlaps with the FVG it also can not cut through any other price action, for example, A potential entry cant cut through another wick to make it overlap with the FVG. (see rules for more)
TnS gets its TP by analyzing what is called the "OG TP" The OG TP is determined by looking for the first tapped into the FVG, then looking for an immediate High or Low to the left of the candle that first tapped the FVG. IF there is no immediate High or low next to the candle that first tapped the FVG, then target the candle itself (see rules for more). IF the "OG TP" has already been hit before TnS gets its entry, then look to the left of the TnS entry candle for the immediate High or Low next to it. If there is no immediate High or Low next to the TnS Entry candle, then target the Entry candles, High or Low (see rules for more)
Model Rules
Overlapping H/L MUST be at least 3 points away from both edges of the FVG,
Overlapping H/L cannot cut through PA to make it overlap with the FVG,
Entries can only be the highest overlapping high or the lowest overlapping low,
If TnS Has already played out within the FVG then it should no longer be used,
If the FVGs OG TP has already been hit then use the TnS entry to re-align for your target,
No using NWOGs/NDOGs for setups. A NWOG is NOT the same thing as an FVG so this example
V2 Rules
If its a Bullish FVG then you need a bearish candle H/L that overlaps for your entry
If its a Bearish FVG then you need a bullish candle H/L that overlaps for your entry
Indicator Functionality
The indicator uses specific logic to identify FVGs that match the requirements of the TnS model, ensuring at least one valid entry exists per the default V1 rules of the model, or the stricter V2 rules if configured via settings. If entries (up to 2 per model rules) are identified, the FVG is highlighted, and each entry and its stop loss is marked with a line. The line styles, colors, and FVG color, which can vary depending on whether the entry is bullish or bearish, are configurable via settings.
Once the FVG is tapped into, the indicator will highlight the take profit spot and list all applicable entries, stop losses, and take profits in a table, the position and presence of which can be controlled within the indicator settings. When price action hits either stop loss or take profit, all elements are removed from the chart to avoid clutter.
Additionally, the indicator allows filtering of entries based on Risk/Reward (R:R), filtering out entries where take profit is less than the model stop loss and entries for which the stop loss resides inside the FVG itself. To help visualize setups where the FVG is outside the current visual range, the indicator has options to extend the FVG box and lines by a configurable number of bars. Once the FVG is tapped, the indicator will automatically extend lines/FVG box to the bar that tapped the FVG plus the configured number of bars.

Smart Money Volume by P4 ProviderSmart Money Volume by P4 Provider is a proprietary volume-based tool designed to identify institutional activity across major trading sessions (Asian, London, and New York) with precision. It combines classical Volume Spread Analysis (VSA) with dynamically calculated session-wise volume averages , tracked in real-time on 1-minute and 5-minute charts.
Built for serious traders, this indicator highlights:
High-Volume Nodes: Automatically marks the highest volume bar of the day with a horizontal level.
Session-Based Volume Intelligence: Tracks and averages volume spikes during key sessions using both M1 and M5 granularities.
Smart Institutional Footprint: Reveals session-specific average volume levels via colored horizontal lines (Green for Asian, Purple for London, Red for NY).
Volume Strength Color Coding: Visualizes bullish/bearish volume intensity via dynamic bar coloring.
Ideal for scalpers, intraday traders, and smart money trackers seeking to align with institutional footprints.
Important Notes:
Time Zone Setup Required: Please adjust the UTC offset in the script according to your local time for accurate session alignment.
Optimized for 1-minute and 5-minute charts only.
For educational and analytical use. Not a buy/sell signal generator.
Developed by P4 Provider , this tool is part of a broader ecosystem focused on elite trading tools powered by real market behavior.

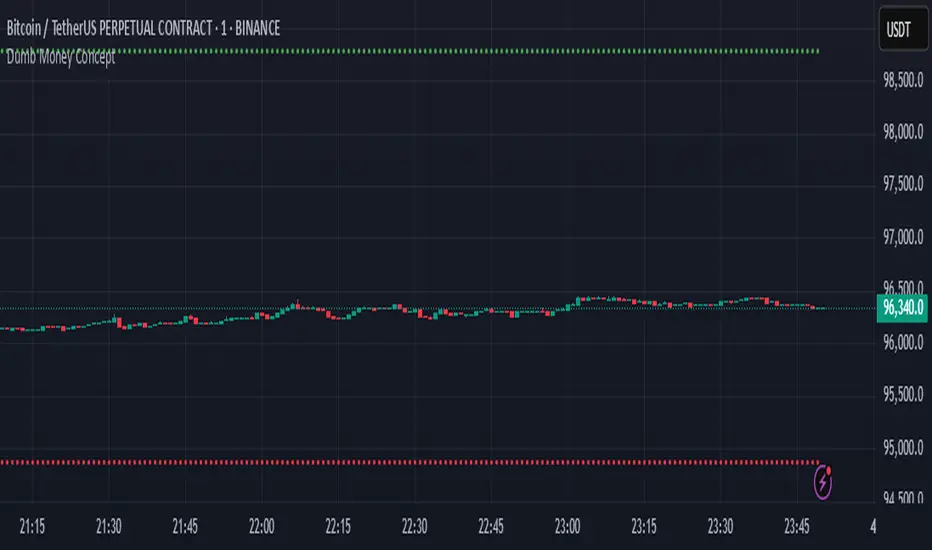
Dumb Money ConceptUse in 1 minute timeframe
1. Strategy setup
Name & sizing: Trades 25% of your account on each signal, assumes 0.04% commission + 2‑tick slippage, starts with a notional 10 million.
Timing: Only makes decisions at each 1‑minute bar close, and processes orders at bar‑close.
2. Optional filters (both default to off)
Volatility filter : when on, requires that yesterday’s ATR (average true range) ≥ your threshold before even placing an entry.
Trend filter : when on, only allows a “long” if yesterday’s close was above its daily MA, or a “short” if below.
You can toggle each filter on/off and adjust ATR period, ATR threshold, and MA length through the inputs at the top.
3. Signal logic (“dumb money” wicks)
At today’s first minute, the script pulls yesterday’s open, high, low, close, ATR and MA—using only completed daily bars so nothing repaints.
It measures the size of yesterday’s upper wick (close→high) vs. lower wick (open→low).
If the upper wick was longer, that sets a long bias (“dumb money” got shaken out at the top). Otherwise it sets a short bias.
4. Calculate where to place orders
On that same first minute of day:
Entry: a limit order at half of yesterday’s range away from today’s open (below the open for longs, above for shorts).
Stop‑loss: one full‑range (×1.0) below today’s open for longs (and above for shorts).
Take‑profit: 1.236× yesterday’s range above today’s open for longs (and below for shorts).
5. Apply filters before sending entry
Before actually placing that limit order, it checks:
Volatility: if enabled, requires yesterday’s ATR ≥ your “Min Daily ATR.”
Trend: if enabled, requires yesterday’s close to lie on the same side of its daily MA as your signal.
If either filter fails, no order is sent.
6. Give the limit order up to 24 hours to fill
The code remembers the bar‑index when the order went live.
If 1440 one‑minute bars pass (≈24 h) without a fill, it automatically cancels the unfilled entry—so stale orders don’t hang around.
7. Once filled, TP/SL manage the trade
As soon as your limit order executes, two opposite orders are placed:
A take‑profit at the 1.236× range level
A stop‑loss at the –1.0× range level
One cancels the other when triggered.
8. No overnight risk
On the very first minute of the next daily bar, any position still open is force‑closed (“Time Exit”)
CYCLE BY RiotWolftradingDescription of the "CYCLE" Indicator
The "CYCLE" indicator is a custom Pine Script v5 script for TradingView that visualizes cyclic patterns in price action, dividing the trading day into specific sessions and 90-minute quarters (Q1-Q4). It is designed to identify and display market phases (Accumulation, Manipulation, Distribution, and Continuation/Reversal) along with key support and resistance levels within those sessions. Additionally, it allows customization of boxes, lines, labels, and colors to suit user preferences.
Main Features
Cycle Phases:
Accumulation (1900-0100): Represents the phase where large operators accumulate positions.
Manipulation (0100-0700): Identifies potential manipulative moves to mislead retail traders.
Distribution (0700-1300): The phase where large operators distribute their positions.
Continuation/Reversal (1300-1900): Indicates whether the price continues the trend or reverses.
90-Minute Quarters (Q1-Q4):
Divides each 6-hour cycle (360 minutes) into four 90-minute quarters (Q1: 00:00-01:30, Q2: 01:30-03:00, Q3: 03:00-04:30, Q4: 04:30-06:00 UTC).
Each quarter is displayed with a colored box (Q1: light purple, Q2: light blue, Q3: light gray, Q4: light pink) and labels (defaulted to black).
Support and Resistance Visualization:
Draws boxes or lines (based on settings) showing the high and low levels of each session.
Optionally displays accumulated volume at the highs and lows within the boxes.
Daily Lines and Last 3 Boxes:
How to Use the Indicator
Step 1: Add the Indicator to TradingView
Open TradingView and select the chart where you want to apply the indicator (e.g., UMG9OOR on a 5-minute timeframe, as shown in the screenshot).
Go to the Pine Editor (at the bottom of the TradingView interface).
Copy and paste the provided code.
Click Compile and then Add to Chart.
Step 2: Configure the Indicator
Click on the indicator name on the chart ("CYCLE") and select Settings (or double-click the name).
Adjust the options based on your needs:
Cycle Phases: Enable/disable phases (Accumulation, Manipulation, Distribution, Continuation/Reversal) and adjust their time slots if needed.
90-Minute Quarters: Enable/disable quarters (Q1-Q4).
Step 3: Interpret the Indicator
Identify Cycle Phases:
Observe the red boxes indicating the phases (Accumulation, Manipulation, etc.).
The high and low levels within each phase are potential support/resistance zones.
If volume is enabled, pay attention to the accumulated volume at highs and lows, as it may indicate the strength of those levels.
Use the 90-Minute Quarters (Q1-Q4):
The colored boxes (Q1-Q4) divide the day into 90-minute segments.
Each quarter shows the price range (high and low) during that period.
Use these boxes to identify price patterns within each quarter, such as breakouts or consolidations.
The labels (Q1, Q2, etc.) help you track time and anticipate potential moves in the next quarter.
Analyze Support and Resistance:
The high and low levels of each phase/quarter act as support and resistance.
Daily lines (if enabled) show key levels from the previous day, useful for planning entries/exits.
The "last 3 boxes below price" (if enabled) highlight potential support levels the price might target.
Avoid Manipulation:
During the Manipulation phase (0100-0700), be cautious of sharp moves or false breakouts.
Use the high/low levels of this phase to identify potential traps (as explained in your first question about manipulation candles).
Step 4: Trading Strategy
Entries and Exits:
Support/Resistance: Use the high/low levels of phases and quarters to set entry or exit points.
For example, if the price bounces off a Q1 support level, consider a buy.
Breakouts: If the price breaks a high/low of a quarter (e.g., Q2), wait for confirmation to enter in the direction of the breakout.
Volume: If accumulated volume is high near a key level, that level may be more significant.
Risk Management:
Place stop-loss orders below lows (for buys) or above highs (for sells) identified by the indicator.
Avoid trading during the Manipulation phase unless you have a specific strategy to handle false breakouts.
Time Context:
Use the quarters (Q1-Q4) to plan your trades based on time. For example, if Q3 is typically volatile in your market, prepare for larger moves between 03:00-04:30 UTC.
Step 5: Adjustments and Testing
Test on Different Timeframes: The indicator is set for a 5-minute timeframe (as in the screenshot), but you can test it on other timeframes (e.g., 1-minute, 15-minute) by adjusting the time slots if needed.
Adjust Colors and Styles: If the default colors are not visible on your chart, change them for better clarity.
---
📌 1. **Accumulation: Strong Institutional Activity**
- During the **accumulation phase, we see **high volume: 82.773K, which suggests strong buying interest**, likely from institutional players.
- This sets the base for the following upward move in price.
---
📌 2. **Manipulation: False Breakout with Lower Volume**
- Later, there's a manipulation phase where price breaks above previous highs, but the volume (71.814K) is **lower than during accumulation**.
- This implies that buyers are not as aggressive as before—no real demandbehind the breakout.
- It’s likely a bull trap, where smart money is selling into the breakout to exit their positions.
---
### 📌 3. Distribution: Weakness and Lack of Demand
- The market enters a distribution phase, and volume drops even further (only 7.914K).
- Price struggles to go higher, and you start seeing rejections at the top.
- This shows that demand is drying up, and smart money is offloading positions**—not accumulating anymore.
---
### 💡 Why Take the Short Here?
- Volume is not increasing with new highs—showing weak demand**.
- The manipulation volume is weaker than the accumulation volume, confirming the breakout was likely false.
- Structure starts to break down (Q levels falling), which confirms weakness.
- This creates a high-probability short setup:
- **Entry:** after confirmation of distribution and structural breakdown.
- **Stop loss:** above the manipulation high.
- **Target:** down toward previous lows or value zones.
---
### ✅ Conclusion
Since the manipulation volume failed to exceed the accumulation volume, the breakout lacked real strength. Combined with decreasing volume in the distribution phase, this indicates fading demand and supply taking control—which justifies entering a short position.

Supply and Demand Order Blocks - Nadeem Al-QahwiThis advanced order block detection system identifies key supply and demand zones on your chart using a proprietary multi-factor algorithm. Unlike basic implementations that only look for engulfing patterns, this indicator incorporates price momentum, volume confirmation, and swing point analysis to filter out false signals and highlight only the most significant trading zones.
Unique Features
Dual Detection System:
Identifies both internal order blocks (within trends) and swing order blocks (at market turns)
Separate customization for each type allows focused analysis
Smart Zone Validation:
Dynamic strength calculation based on price rejection intensity
Timeframe-sensitive filtering (automatically adjusts for different chart intervals)
Minimum price movement threshold to eliminate insignificant zones
Advanced Visualization:
Three display modes (Boxes & Levels, Boxes Only, Levels Only)
Gradient coloring system showing zone strength intensity
Configurable midline markers for precise entry/exit planning
Methodology
The indicator scans the specified lookback period for:
Bullish Order Blocks: Last bearish candle before a sustained upward move
Bearish Order Blocks: Last bullish candle before a sustained downward move
Each potential zone is evaluated using:
Price Action Confirmation:
Minimum required price move (configurable as percentage)
Consecutive closes beyond the order block range
Volume Analysis (implied through price movement):
Significant expansion beyond the zone
Sustained momentum after breakout
Zone Quality Filters:
Overlap prevention (merges similar zones)
Strength ranking system (prioritizes zones with strongest reactions)
Usage Instructions
Primary Settings:
Adjust lookback period (default 500 bars)
Select display style based on your trading needs
Zone Customization:
Internal Order Blocks: Best for trending markets
Swing Order Blocks: Ideal for reversal trading
Configure colors and styles for visual clarity
Advanced Filters:
Minimum price move: Increase for higher timeframes
Overlap threshold: Adjust based on market volatility
Strength filter: Focus only on high-probability zones
Trading Applications
Trend Trading: Use internal order blocks as continuation signals
Reversal Trading: Swing order blocks mark potential turning points
Risk Management: Zone boundaries serve as natural stop levels
Multiple Timeframe Analysis: Combine settings for different chart intervals
Originality Statement
This implementation differs from basic order block indicators through:
Proprietary strength calculation algorithm
Adaptive timeframe filtering
Intelligent zone merging technology
Configurable display system for personalized charting
While the concept of order blocks is not novel, this particular implementation adds significant value through its sophisticated filtering mechanisms and customizable visualization options that aren't available in open-source alternatives.
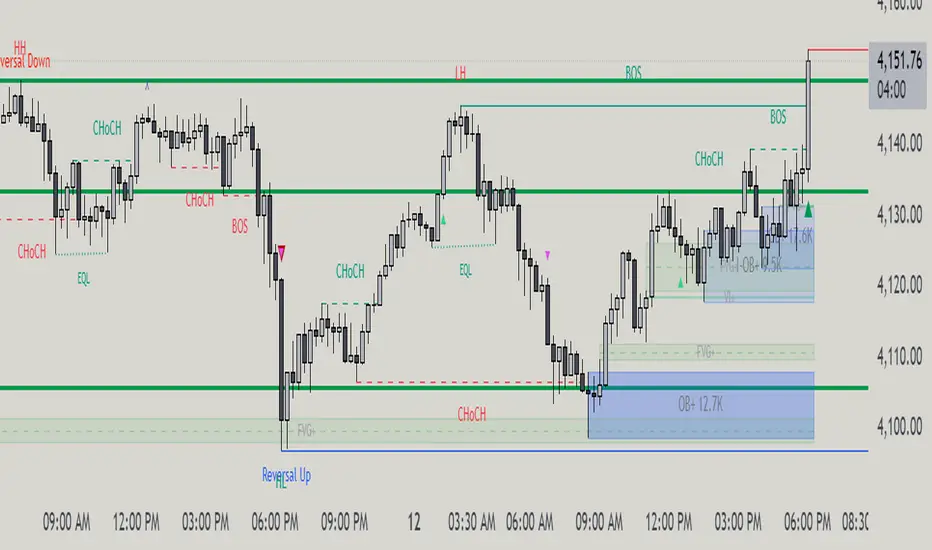
Smarter Money Concepts - OBs [PhenLabs]📊 Smarter Money Concepts - OBs
Version: PineScript™ v6
📌 Description
Smarter Money Concepts - OBs (Order Blocks) is an advanced technical analysis tool designed to identify and visualize institutional order zones on your charts. Order blocks represent significant areas of liquidity where smart money has entered positions before major moves. By tracking these zones, traders can anticipate potential reversals, continuations, and key reaction points in price action.
This indicator incorporates volume filtering technology to identify only the most significant order blocks, eliminating low-quality signals and focusing on areas where institutional participation is likely present. The combination of price structure analysis and volume confirmation provides traders with high-probability zones that may attract future price action for tests, rejections, or breakouts.
🚀 Points of Innovation
Volume-Filtered Block Detection : Identifies only order blocks formed with significant volume, focusing on areas with institutional participation
Advanced Break of Structure Logic : Uses sophisticated price action analysis to detect legitimate market structure breaks preceding order blocks
Dynamic Block Management : Intelligently tracks, extends, and removes order blocks based on price interaction and time-based expiration
Structure Recognition System : Employs technical analysis algorithms to find significant swing points for accurate order block identification
Dual Directional Tracking : Simultaneously monitors both bullish and bearish order blocks for comprehensive market structure analysis
🔧 Core Components
Order Block Detection : Identifies institutional entry zones by analyzing price action before significant breaks of structure, capturing where smart money has likely positioned before moves.
Volume Filtering Algorithm : Calculates relative volume compared to a moving average to qualify only order blocks formed with significant market participation, eliminating noise.
Structure Break Recognition : Uses price action analysis to detect legitimate breaks of market structure, ensuring order blocks are identified only at significant market turning points.
Dynamic Block Management : Continuously monitors price interaction with existing blocks, extending, maintaining, or removing them based on current market behavior.
🔥 Key Features
Volume-Based Filtering : Filter out insignificant blocks by requiring a minimum volume threshold, focusing only on zones with likely institutional activity
Visual Block Highlighting : Color-coded boxes clearly mark bullish and bearish order blocks with customizable appearance
Flexible Mitigation Options : Choose between “Wick” or “Close” methods for determining when a block has been tested or mitigated
Scan Range Adjustment : Customize how far back the indicator looks for structure points to adapt to different market conditions and timeframes
Break Source Selection : Configure which price component (close, open, high, low) is used to determine structure breaks for precise block identification
🎨 Visualization
Bullish Order Blocks : Blue-colored rectangles highlighting zones where bullish institutional orders were likely placed before upward moves, representing potential support areas.
Bearish Order Blocks : Red-colored rectangles highlighting zones where bearish institutional orders were likely placed before downward moves, representing potential resistance areas.
Block Extension : Order blocks extend to the right of the chart, providing clear visualization of these significant zones as price continues to develop.
📖 Usage Guidelines
Order Block Settings
Scan Range : Default: 25. Defines how many bars the indicator scans to determine significant structure points for order block identification.
Bull Break Price Source : Default: Close. Determines which price component is used to detect bullish breaks of structure.
Bear Break Price Source : Default: Close. Determines which price component is used to detect bearish breaks of structure.
Visual Settings
Bullish Blocks Color : Default: Blue with 85% transparency. Controls the appearance of bullish order blocks.
Bearish Blocks Color : Default: Red with 85% transparency. Controls the appearance of bearish order blocks.
General Options
Block Mitigation Method : Default: Wick, Options: Wick, Close. Determines how block mitigation is calculated - “Wick” uses high/low values while “Close” uses close values for more conservative mitigation criteria.
Remove Filled Blocks : Default: Disabled. When enabled, order blocks are removed once they’ve been mitigated by price action.
Volume Filter
Volume Filter Enabled : Default: Enabled. When activated, only shows order blocks formed with significant volume relative to recent average.
Volume SMA Period : Default: 15, Range: 1-50. Number of periods used to calculate the average volume baseline.
Min. Volume Ratio : Default: 1.5, Range: 0.5-10.0. Minimum volume ratio compared to average required to display an order block; higher values filter out more blocks.
✅ Best Use Cases
Identifying high-probability support and resistance zones for trade entries and exits
Finding optimal stop-loss placement behind significant order blocks
Detecting potential reversal areas where price may react after extended moves
Confirming breakout trades when price clears major order blocks
Building a comprehensive market structure map for medium to long-term trading decisions
Pinpointing areas where smart money may have positioned before major market moves
⚠️ Limitations
Most effective on higher timeframes (1H and above) where institutional activity is more clearly defined
Can generate multiple signals in choppy market conditions, requiring additional filtering
Volume filtering relies on accurate volume data, which may be less reliable for some securities
Recent market structure changes may invalidate older order blocks not yet automatically removed
Block identification is based on historical price action and may not predict future behavior with certainty
💡 What Makes This Unique
Volume Intelligence : Unlike basic order block indicators, this script incorporates volume analysis to identify only the most significant institutional zones, focusing on quality over quantity.
Structural Precision : Uses sophisticated break of structure algorithms to identify true market turning points, going beyond simple price pattern recognition.
Dynamic Block Management : Implements automatic block tracking, extension, and cleanup to maintain a clean and relevant chart display without manual intervention.
Institutional Focus : Designed specifically to highlight areas where smart money has likely positioned, helping retail traders align with institutional perspectives rather than retail noise.
🔬 How It Works
1. Structure Identification Process :
The indicator continuously scans price action to identify significant swing points and structure levels within the specified range, establishing a foundation for order block recognition.
2. Break Detection :
When price breaks an established structure level (crossing below a significant low for bearish breaks or above a significant high for bullish breaks), the indicator marks this as a potential zone for order block formation.
3. Volume Qualification :
For each potential order block, the algorithm calculates the relative volume compared to the configured period average. Only blocks formed with volume exceeding the minimum ratio threshold are displayed.
4. Block Creation and Management :
Valid order blocks are created, tracked, and managed as price continues to develop. Blocks extend to the right of the chart until they are either mitigated by price action or expire after the designated timeframe.
5. Continuous Monitoring :
The indicator constantly evaluates price interaction with existing blocks, determining when blocks have been tested, mitigated, or invalidated, and updates the visual representation accordingly.
💡 Note:
Order Blocks represent areas where institutional traders have likely established positions and may defend these zones during future price visits. For optimal results, use this indicator in conjunction with other confluent factors such as key support/resistance levels, trendlines, or additional confirmation indicators. The most reliable signals typically occur on higher timeframes where institutional activity is most prominent. Start with the default settings and adjust parameters gradually to match your specific trading instrument and style.

Smart Money Breakout & Order Block StrategySmart Money Breakout & Order Block Strategy
Created by Shubham
This strategy was developed by Shubham, designed to provide traders with a structured approach to smart money trading by combining breakout entries and order block reversals. It focuses on liquidity zones, volatility filters, and ATR-based stop management to adapt to different market conditions.
🔹 Strategy Overview
The Smart Money Breakout & Order Block Strategy is built for traders who want to identify institutional moves while avoiding false breakouts. This non-repainting strategy helps traders detect:
✅ Momentum Breakouts – Price breaking key support & resistance levels.
✅ Order Block Reversals – Institutional buying & selling zones.
✅ Dynamic Stop Management – No fixed SL/TP; uses ATR-based trailing stops.
✅ Volatility Filtering – Avoids choppy market conditions.
🔹 Trading Logic
1️⃣ Breakout Trading (Momentum Entries)
Long Entry: When price breaks above resistance with high volatility.
Short Entry: When price breaks below support with high volatility.
2️⃣ Order Block Reversals (Liquidity Entries)
Bullish Order Block: A strong price rejection after consecutive bearish candles signals smart money accumulation, triggering a long trade.
Bearish Order Block: A strong price rejection after consecutive bullish candles signals smart money distribution, triggering a short trade.
3️⃣ Volatility Filter (False Signal Prevention)
Uses normalized volatility to ensure breakouts are backed by strong momentum.
Helps filter out low-volume, choppy market conditions.
4️⃣ ATR-Based Position Management (Dynamic Stops & Trailing Stop)
No fixed SL/TP → Uses ATR-based stop-loss to adapt to market volatility.
Implements a trailing stop for maximizing potential profits in trending markets.
🔹 Key Features
✔️ Developed by Shubham – Designed for precision trading with institutional techniques.
✔️ Smart Money Concept – Identifies liquidity zones, breakouts, and order blocks.
✔️ Volatility Filter – Prevents false breakouts by analyzing market momentum.
✔️ ATR-Based Dynamic Stops – No fixed SL/TP, making it more adaptive.
✔️ Trailing Stop Functionality – Allows profits to run while reducing risk.
✔️ Fully Automated Execution – Uses TradingView’s strategy functions for automatic trade placement and exits.
✔️ Commission-Adjusted Backtesting – Includes realistic commission settings to ensure accurate results.
📊 Backtesting & Realistic Expectations
✅ Best for Higher Timeframes (1H, 4H, Daily) – Avoids market noise.
✅ Most Effective in Trending & Volatile Markets – Crypto, forex, indices, and commodities.
✅ Performance Varies with Market Conditions – Works best in strong trends.
✅ No Unrealistic Promises – Strategy performance is dependent on market behavior and risk management.
📌 IMPORTANT DISCLAIMER:
This strategy is provided for educational purposes only and should not be considered financial advice. Past performance in backtesting does not guarantee future results. Users should conduct their own research before applying this strategy in live markets.
🚀 Developed by Shubham – Test it yourself and see how it performs! 🚀

Smarter Money Concepts - FVGs [PhenLabs]📊 Smarter Money Concepts - FVGs
Version: PineScript™ v6
📌 Description
Smarter Money Concepts - FVGs is a sophisticated indicator designed to identify and track Fair Value Gaps (FVGs) in price action. These gaps represent market inefficiencies where price moves quickly, creating imbalances that often attract subsequent price action for mitigation. By highlighting these key areas, traders can identify potential zones for reversals, continuations, and price targets.
The indicator employs volume filtering ideology to highlight only the most significant FVGs, reducing noise and focusing on gaps formed during periods of higher relative volume. This combination of price structure analysis and volume confirmation provides traders with high-probability areas of interest that institutional smart money may target during future price movements.
🚀 Points of Innovation
Volume-Filtered Gap Detection : Eliminates low-significance FVGs by requiring a minimum volume threshold, focusing only on gaps formed with institutional participation
Equilibrium Line Visualization : Displays the midpoint of each gap as a potential precision target for trades
Automated Gap Mitigation Tracking : Monitors when price revisits and mitigates gaps, automatically managing visual elements
Time-Based Gap Management : Intelligently filters gaps based on a configurable timeframe, maintaining chart clarity
Dual Direction Analysis : Simultaneously tracks both bullish and bearish gaps, providing a complete market structure view
Memory-Optimized Design : Implements efficient memory management for smooth chart performance even with numerous FVGs
🔧 Core Components
Fair Value Gap Detection : Identifies price inefficiencies where the current candle’s low is higher than the previous candle’s high (bearish FVG) or where the current candle’s high is lower than the previous candle’s low (bullish FVG).
Volume Filtering Mechanism : Calculates relative volume compared to a moving average to qualify only gaps formed during significant market activity.
Mitigation Tracking : Continuously monitors price action to detect when gaps get filled, with options to either hide or maintain visual representation of mitigated gaps.
🔥 Key Features
Customizable Gap Display : Toggle visibility of bullish and bearish gaps independently to focus on your preferred market direction
Volume Threshold Control : Adjust the minimum volume ratio required for gap qualification, allowing fine-tuning between sensitivity and significance
Flexible Mitigation Methods : Choose between “Wick” or “Close” methods for determining when a gap has been mitigated, adapting to different trading styles
Visual Customization : Full control over colors, transparency, and style of gap boxes and equilibrium lines
🎨 Visualization
Gap Boxes : Rectangular highlights showing the exact price range of each Fair Value Gap. Bullish gaps indicate potential upward price targets, while bearish gaps show potential downward targets.
Equilibrium Lines : Dotted lines running through the center of each gap, representing the mathematical midpoint that often serves as a precision target for price movement.
📖 Usage Guidelines
General Settings
Days to Analyze : Default: 15, Range: 1-100. Controls how many days of historical gaps to display, balancing between comprehensive analysis and chart clarity
Visual Settings
Bull Color : Default:(#596fd33f). Color for bullish Fair Value Gaps, typically using high transparency for clear chart visibility
Bear Color : Default:(#d3454575). Color for bearish Fair Value Gaps, typically using high transparency for clear chart visibility
Equilibrium Line : Default: Enabled. Toggles visibility of the center equilibrium line for each FVG
Eq. Line Color : Default: Black with 99% transparency. Sets the color of equilibrium lines, usually kept subtle to avoid chart clutter
Eq. Line Style : Default: Dotted, Options: Dotted, Solid, Dashed. Determines the line style for equilibrium lines
Mitigation Settings
Mitigation Method : Default: Wick, Options: Wick, Close. Determines how gap mitigation is calculated - “Wick” uses high/low values while “Close” uses open/close values for more conservative mitigation criteria
Hide Mitigated : Default: Enabled. When enabled, gaps become transparent once mitigated, reducing visual clutter while maintaining historical context
Volume Filter
Volume Filter : Default: Enabled. When enabled, only shows gaps formed with significant volume relative to recent average
Min Ratio : Default: 1.5, Range: 0.1-10.0. Minimum volume ratio compared to average required to display an FVG; higher values filter out more gaps
Periods : Default: 15, Range: 5-50. Number of periods used to calculate the average volume baseline
✅ Best Use Cases
Identifying potential reversal zones where price may react after extended moves
Finding precise targets for take-profit placement in trend-following strategies
Detecting institutional interest areas for potential breakout or breakdown confirmations
Plotting significant support and resistance zones based on structural imbalances
Developing fade strategies at key market structure points
Confirming trade entries when price approaches significant unfilled gaps
⚠️ Limitations
Works best on higher timeframes where gaps reflect more significant market inefficiencies
Very choppy or ranging markets may produce small gaps with limited predictive value
Volume filtering depends on accurate volume data, which may be less reliable for some symbols
Performance may be affected when displaying a very large number of historical gaps
Some gaps may never be fully mitigated, particularly in strongly trending markets
💡 What Makes This Unique
Volume Intelligence : Unlike basic FVG indicators, this script incorporates volume analysis to identify the most significant structural imbalances, focusing on quality over quantity.
Visual Clarity Management : Automatic handling of mitigated gaps and memory management ensures your chart remains clean and informative even over extended analysis periods.
Dual-Direction Comprehensive Analysis : Simultaneously tracks both bullish and bearish gaps, providing a complete market structure picture rather than forcing a directional bias.
🔬 How It Works
1. Gap Detection Process :
The indicator examines each candle in relation to previous candles, identifying when a gap forms between the low of candle and high of candle (bearish FVG) or between the high of candle and low of candle (bullish FVG). This specific candle relationship identifies true structural imbalances.
2. Volume Qualification :
For each potential gap, the algorithm calculates the relative volume compared to the configured period average. Only gaps formed with volume exceeding the minimum ratio threshold are displayed, ensuring focus on institutionally significant imbalances.
3. Equilibrium Calculation :
For each qualified gap, the script calculates the precise mathematical midpoint, which becomes the equilibrium line - a key target that price often gravitates toward during mitigation attempts.
4. Mitigation Tracking :
The indicator continuously monitors price action against existing gaps, determining mitigation based on the selected method (wick or close). When price reaches the equilibrium point, the gap is considered mitigated and can be visually updated accordingly.
💡 Note:
Fair Value Gaps represent market inefficiencies that often, but not always, get filled. Use this indicator as part of a complete trading strategy rather than as a standalone system. The most valuable signals typically come from combining FVG analysis with other confirmatory indicators and overall market context. For optimal results, start with the default settings and gradually adjust parameters to match your specific trading timeframe and style.

FVG Detector by SZEMEK>>> DESCRIPTION IN ENGLISH
An advanced indicator for the TradingView platform designed to detect and visualize Fair Value Gaps (FVG) and Inversion Fair Value Gaps (iFVG) on charts.
Main Features:
1. FVG Detection:
- The script identifies both bullish and bearish Fair Value Gaps.
- Users can choose which types of FVG to display (Bullish, Bearish, both, or none).
2. FVG Visualization:
- Gaps are represented as rectangular boxes on the chart.
- The color and transparency of the boxes are configurable separately for bullish and bearish FVG.
- The option to add a frame to FVG boxes with separate color settings.
- FVG labels are available with configurable colors and sizes.
3. Dynamic Tracking of FVG Fill:
- The script monitors the extent to which each gap has been filled by subsequent price movements.
- The fill level is visualized using gray overlay on the original FVG box.
- The percentage fill is updated on the label.
4. Automatic Removal of FVG:
- The ability to set a percentage threshold (100%, 75%, 50%, or no removal) after which FVG is removed from the chart.
5. iFVG Detection:
- The script also identifies Inversion Fair Value Gaps (iFVG), which can be displayed as separate boxes.
- iFVG are available in bullish and bearish versions.
- Users can choose which types of iFVG to display (Bullish, Bearish, both, or none).
- iFVG can also have labels and frames.
6. Limitation of Checked Candles:
- Users can specify the maximum number of candles back that the script will analyze for FVG and iFVG.
- Alerts: The indicator allows setting alerts for detected iFVG, both bullish and bearish.
Advanced Features:
- Accurate calculation of FVG fill percentage, considering both wicks and candle bodies.
- Dynamic updating of FVG boxes and their labels in real-time.
- Flexible memory management through the removal of outdated or filled FVG.
- The ability to customize the appearance of iFVG, including colors, labels, and frames.
This script serves as an advanced tool for technical analysis, enabling traders to identify potential support and resistance areas based on the concept of Fair Value Gaps and their inverted versions.
>>> DESCRIPTION IN ENGLISH
Zaawansowany wskaźnik dla platformy TradingView, który służy do wykrywania i wizualizacji luk wartości godziwej (Fair Value Gaps, FVG) oraz odwróconych luk wartości godziwej (Inversion Fair Value Gaps, iFVG) na wykresie.
Główne cechy
1. Wykrywanie FVG:
- Skrypt identyfikuje zarówno bycze (Bullish), jak i niedźwiedzie (Bearish) luki wartości godziwej.
- Użytkownik może wybrać, które typy FVG mają być wyświetlane (Bullish, Bearish, oba lub żadne).
2. Wizualizacja FVG:
- Luki są przedstawiane jako prostokątne boxy na wykresie.
- Kolor i przezroczystość boxów są konfigurowalne osobno dla FVG byczych i niedźwiedzich.
- Możliwość dodania ramki do boxów FVG z osobnymi ustawieniami kolorów.
- Etykiety FVG są dostępne z konfigurowalnymi kolorami i rozmiarami.
3. Dynamiczne śledzenie wypełnienia FVG:
- Skrypt monitoruje, w jakim stopniu każda luka została wypełniona przez późniejsze ruchy ceny.
- Stopień wypełnienia jest wizualizowany za pomocą szarego koloru nakładanego na oryginalny box FVG.
- Procent wypełnienia jest aktualizowany na etykiecie.
4. Automatyczne usuwanie FVG:
- Możliwość ustawienia progu procentowego (100%, 75%, 50% lub brak usuwania), po którego przekroczeniu FVG jest usuwany z wykresu.
5. Wykrywanie iFVG:
- Skrypt dodatkowo identyfikuje odwrócone luki wartości godziwej (iFVG), które mogą być wyświetlane jako osobne boxy.
- iFVG są dostępne w wersji byczej i niedźwiedziej.
- Użytkownik może wybrać, które typy iFVG mają być wyświetlane (Bullish, Bearish, oba lub żadne).
- iFVG również mogą mieć etykiety i ramki.
6. Ograniczenie sprawdzanych świec:
- Użytkownik może określić maksymalną liczbę świec wstecz, które skrypt będzie analizował w poszukiwaniu FVG i iFVG.
- Alerty: Wskaźnik umożliwia ustawienie alertów dla wykrytych luk iFVG, zarówno bullish, jak i bearish.
Zaawansowane funkcje
- Dokładne obliczanie procentu wypełnienia FVG, uwzględniające zarówno knoty, jak i ciała świec.
- Dynamiczne aktualizowanie boxów FVG i ich etykiet w czasie rzeczywistym.
- Elastyczne zarządzanie pamięcią poprzez usuwanie nieaktualnych lub wypełnionych FVG.
- Możliwość dostosowania wyglądu iFVG, w tym kolorów, etykiet i ramki.
Skrypt ten stanowi zaawansowane narzędzie do analizy technicznej, umożliwiające traderom identyfikację potencjalnych obszarów wsparcia i oporu bazujących na koncepcji luk wartości godziwej i ich odwróconych wersjach.

Multi-Timeframe Open LinesThe Multi-Timeframe Open Lines indicator is designed to help traders visualize key price levels at the open of specific time intervals. It draws horizontal lines at the open of 5-minute, 15-minute, 30-minute, and hourly candles, extending these lines to the start of the next respective interval. Traders can now control which timeframes are displayed and how many past opening lines are shown, ensuring a clean and organized chart.
Key Features:
Customizable Lines:
5-Minute Lines: Highlight the open of every 5-minute candle, ending at the start of the next 5-minute candle.
15-Minute Lines: Highlight the open of every 15-minute candle, ending at the start of the next 15-minute candle.
30-Minute Lines: Highlight the open of every 30-minute candle, ending at the start of the next 30-minute candle.
Hourly Lines: Highlight the open of every hourly candle, ending at the start of the next hourly candle.
Each timeframe's lines can be customized in terms of color, line style, and thickness.
Toggle Options:
Easily turn on or off the display of lines for each timeframe (5m, 15m, 30m, 1h) using checkboxes in the settings.
User-Defined Limits:
Control the number of past opening lines displayed for each timeframe (5m, 15m, 30m, 1h).
Prevents chart clutter by limiting the number of visible lines.
Multi-Timeframe Analysis:
Enables traders to analyze price action across multiple timeframes simultaneously, providing a clearer picture of market structure and key levels.
User-Friendly Inputs:
Easy-to-use settings for customizing line appearance and behavior, ensuring the indicator fits seamlessly into any trading strategy.
How to Use:
Apply the indicator to your chart to visualize the open price levels for 5-minute, 15-minute, 30-minute, and hourly candles.
Use the lines as dynamic support/resistance levels or to identify potential breakout/breakdown points.
Customize the colors, styles, and the number of visible lines to match your chart theme or trading preferences.
Toggle specific timeframes on or off to focus on the most relevant price levels.
Ideal For:
Traders who use multi-timeframe analysis.
Those who rely on key price levels for decision-making.
Anyone looking to enhance their chart with clear, customizable reference lines while avoiding clutter.

Peak Reaction Zones [BigBeluga]Peak Reaction Zones is an advanced Smart Money Concept (SMC) indicator that identifies the most recent swing high and swing low zones, helping traders determine premium and discount areas for optimal trade positioning.
🔵 Key Features:
Swing High & Low Zones:
Automatically detects the latest swing high and swing low levels.
Helps traders identify key reaction points where price is likely to respond.
Premium & Discount Concept:
The high zone represents a premium area, where price is overextended and may reverse.
The low zone represents a discount area, where price is undervalued and may bounce.
The midline dynamically marks the equilibrium of the range.
Adjustable Zone Width:
Users can fine-tune the width of the zones to match their trading style.
Wider zones capture broader reaction ranges, while narrower zones focus on precise levels.
Zone Retest Signals:
Blue markers appear when price retests the lower reaction zone, signaling potential support.
Orange markers appear when price retests the upper reaction zone, indicating possible resistance.
Price Labels for Key Levels:
Displays the price value of the swing high, swing low, and midline for quick reference.
Helps traders recognize major reaction points at a glance.
🔵 Usage:
Smart Money Trading: Utilize the premium and discount concept to align trades with institutional order flow.
Zone Reactions: Watch for price tests of reaction zones and use the retest signals to confirm potential reversals.
Midline Confirmation: If price holds above or below the midline, it can indicate directional bias.
Scalping & Swing Trading: Short-term traders can look for zone rejections, while swing traders can use the levels for trend continuation setups.
Peak Reaction Zones is a must-have tool for traders looking to trade with Smart Money Concepts, allowing for precise entries and exits based on key liquidity areas and market structure.
