Market Structure CHoCH/BOS (Fractal) [LuxAlgo]The Market Structure CHoCH/BOS (Fractal) indicator is an experimental take on classical market structure, whereas fractal patterns are used for their construction instead of swing points.
Compared to utilizing swing points for highlighting market structure like our Smart Money Concepts indicator , fractal-based market structure can appear as more adaptive, however, it can also be more restrictive when it comes to returning swing points which can cause the indicator to miss reversals in some cases.
If enabled from within the settings, users can see support and resistance levels returned from the detected market structure with breakouts highlighted on the chart. Alongside this feature, an additional dashboard showing the structure to fractal structure percentage is also provided.
🔶 SETTINGS
Length: Length of the fractal patterns to detect.
🔹 Style
Bullish Structures: Show bullish structures.
Bearish Structures: Show bullish structures.
Support: Show support levels.
Resistance: Show resistance levels.
🔹 Dashboard
Show Dashboard: Show structure to fractal percentage dashboard on the chart.
Location: Location of the dashboard on the chart.
Size: Dashboard size.
🔶 USAGE
Market structure is commonly used to determine trend direction by using price positions relative to prior swing points. Using fractal patterns to determine market structure can allow users to obtain shorter, more frequent structure labels.
Market structure is commonly classified as follows:
Change of Character (CHoCH), also referred to as Market Structure Shift (MSS)
Break of Structure (BOS), also referred to as Market Structure Break (MSB)
Change of Characters indicate a shift in the market trend, confirming trend reversals. Break of Structures on the other hand occur once a trend is already determined, confirming new higher highs/lower lows.
Using higher length values allow users to detect longer-term fractals, thus highlighting longer-term market structures. The image above detects fractal patterns made of 7 candles, even if the increment is only of 2 bars this significantly reduces the amount of detected market structure labels.
The result obtained by utilizing fractals and higher settings can be a more dynamic view of market structure, however, as seen in the image above this can introduce very significant delay compared to utilizing pure swing points.
🔹 Support/Resistance
The indicator also returns support/resistance levels constructed from the market structure, these levels are obtained similarly to order blocks, finding the minimum on the interval of a bullish market structure and the maximum of a bearish market structure.
Price reaching a support/resistance level can be expected to bounce from it. Once a level is broken, the support/resistance level will no longer extend, and a circle will be displayed highlighting the break.
While utilizing this script for fractal-based market structure, these levels can be useful to ensure all swing points are still considered by the user with the possibility of the indicator missing reversals due to its calculation not being based on swing points themselves.
🔹 Dashboard
The dashboard reports the structure to fractal percentage, that is the amount of bullish/bearish market structures relative to the total amount of detected bullish/bearish fractal patterns.
This allows us to see how often a detected fractal pattern is used to display a market structure.
🔶 DETAILS
🔹 Fractals
In the context of technical analysis, Fractals refer to specific patterns that exhibit self-similarity at different scales or timeframes.
The most commonly known fractal pattern consists of a consecutive sequence of candles (more commonly 5), with the central candle being the lowest (in case of a bullish fractal) or highest (in case of a bearish fractal).
A bullish fractal has candles on the right side of the central candle with increasing lows, while candles on the left side have decreasing lows.
A bearish fractal has candles on the right side of the central candle with decreasing highs, while candles on the left side have increasing highs.
🔶 RELATED SCRIPTS
🔹 Smart Money Concepts
🔹 Market Structure Trailing Stop
🔹 ICT Concepts
Smartmoneyconcept

Market Structure & Price Action Toolkit (Expo)█ Overview
This comprehensive Market Structure and Price Action toolkit integrates pioneering price action concepts, including fractal-based market structure, grid-price action system, retail and institutional levels/zones, liquidity concepts, and a plethora of advanced customization options to give you a trading advantage via price action automatically. Different from traditional technical indicators, which can be lagging, complex, and cluttered, this indicator focuses solely on raw price data to deliver accurate and real-time insights. All the features in this script originate exclusively from price action, concentrating on fractals-based swing highs, swing lows, and market structure. This enables users to automate their price action analysis across any market or timeframe.
The toolkit focuses on the real-time application of price data rather than historical data to ensure its usefulness for price action and smart money (ICT) traders. With this indicator, users can automate their price action analysis across various markets and timeframes, gaining a significant edge in their trading strategies.
█ Features and How They Work
█ Trading Systems
Market Structure:
Market Structure deals with the interpretation of price action that forms the market structure, focusing on understanding key shifts and changes in the market that may indicate where 'smart money' (large institutional investors and professional traders) might be moving in the market. This feature is based on real-time fractals instead of static pivot points. Fractals are based on the idea that markets are patterned, and those patterns repeat themselves on all scales – hence, the term "fractal", which means "fraction of the whole". The function uses fractal zones that refer to areas where the price is likely to experience a change in direction. These zones are identified by observing a series of fractal points.
Grid:
The grid system works similarly to the market structure but displays the data as a grid of support and resistance zones. This is a new and unique approach to understanding market structure. It might be a more convenient way for traders to understand how to act.
█ Retail Zones
Support/Resistance:
Support and Resistance zone are often seen and displayed with a delay. This feature is 100% real-time and displays SR levels as the price reacts and forms new highs and lows.
Confirmed Support/Resistance:
As the name suggests, the confirmed zone is first displayed on the chart when the price has reacted to a high/low formation over x period of time. This feature is handy to trade retest after breakouts of the zone.
We wanted to keep the retail zones simple regarding how they work and function to help all kinds of traders understand how to use them.
█ Institutional Zones
Supply/Demand:
Calculating supply and demand in its raw form is challenging due to the complexity and dynamism of financial markets. However, the function uses several concepts to gauge supply and demand levels.
Buying and Selling pressure: The buying pressure represents the highest price point (over x period and volume), while the selling pressure price represents the lowest price point (over x period and volume). The gap between the two is known as the buying/selling pressure spread. A narrow spread often signifies high liquidity and balanced supply and demand, while a wider spread might indicate imbalances.
Price Trends: Upward price movements indicate higher demand, while downward trends may suggest increased supply.
Order blocks:
Order blocks are similar to supply/demand, and the main difference is that an order block is created at specific price action and market structure patterns.
█ How to use the Market Structure Toolkit
Market Structure
Market Structure + Confirmed S/R
Grid System
Demand Zone
Supply Zone
Order Block
Support/Resistance Zones
Confirmed Support/Resistance Zone
Retest of SR Levels
█ Why Use Price Action and Market Structure
A comprehensive trading strategy often involves using both price action and market structure. Traders can use price action to understand the immediate behavior of the price and market structure to understand the broader context within which the price is moving.
Market Structure combined with Price Action refers to the observable pattern of price movement. Traders use this structure to identify trend direction (up, down, or sideways), market phase (trend or range), and key price levels (like support and resistance).
Here are some core concepts within price action trading:
Trend Identification: This is a fundamental aspect of price action trading. By simply looking at the raw price data on a chart, traders can identify whether the instrument is in an uptrend (making higher highs and higher lows), a downtrend (making lower highs and lower lows), or ranging sideways.
Support and Resistance Levels: These are horizontal lines drawn on a chart where the price has historically had difficulty moving beyond. Support is a price level where buying pressure is strong enough to prevent the price from falling further, while resistance is a level where selling pressure is strong enough to prevent further price increases.
Candlestick Patterns: Price action traders rely heavily on candlestick patterns, which can provide a lot of information about market sentiment.
Chart Patterns: In addition to individual candlestick patterns, price action traders often look for larger chart patterns like double tops/bottoms, triangles, wedges, head and shoulders patterns, and more. These patterns can take longer to form but can also provide insight into potential price movement.
Price Zones: Rather than exact price levels, many price action traders consider zones of support and resistance, understanding that market behavior isn't always perfectly precise. A zone might cover a small range of prices at which the market has repeatedly reversed in the past.
The idea behind price action trading is that the price itself can provide clues to what the market might do next. Traders who follow this approach believe that price is the final determinant of value and contains all the information needed.
█ Any Alert Function Call
This function allows traders to combine any feature and create customized alerts. These alerts can be set for various conditions and customized according to the trader's strategy or preferences.
█ In conclusion, This toolkit is particularly useful for price action and smart money traders, as it prioritizes real-time application of price data, which in turn allows a more responsive and informed decision-making process in trading.
-----------------
Disclaimer
The information contained in my Scripts/Indicators/Ideas/Algos/Systems does not constitute financial advice or a solicitation to buy or sell any securities of any type. I will not accept liability for any loss or damage, including without limitation any loss of profit, which may arise directly or indirectly from the use of or reliance on such information.
All investments involve risk, and the past performance of a security, industry, sector, market, financial product, trading strategy, backtest, or individual's trading does not guarantee future results or returns. Investors are fully responsible for any investment decisions they make. Such decisions should be based solely on an evaluation of their financial circumstances, investment objectives, risk tolerance, and liquidity needs.
My Scripts/Indicators/Ideas/Algos/Systems are only for educational purposes!
Skrip berbayar

Volume Profile Bar-Magnified Order Blocks [MyTradingCoder]Introducing "Volume Profile Bar-Magnified Order Blocks", an innovative and unique trading indicator designed to provide traders with a comprehensive understanding of market dynamics. This tool takes the concept of identifying order blocks on your chart and elevates it by integrating a detailed volume profile within each order block zone.
Unlike standard order block indicators, Volume Profile Bar-Magnified Order Blocks pulls data from lower timeframe bars and assigns it to various segments of the order block. By providing this volume profile inside the order block, the indicator supplies a deeper, multi-dimensional view of market activity that can enhance your trading decisions.
Crucially, users have the ability to fine-tune the detection of order blocks. This is made possible through a single input setting called "Tuning". This integer value allows you to control the significance and frequency of the order blocks. Higher numbers will produce more significant order blocks, though they will appear less frequently. Lower numbers, on the other hand, will yield less significant order blocks, but they will occur more often. This enables you to adjust the sensitivity of the indicator according to your specific trading strategy and style.
Key Settings:
Number of Segments: Customize the level of detail in your volume profile by selecting the number of segments you want inside each order block.
Tuning: Adjust the sensitivity of order block detection to align with your trading strategy. Higher values produce more significant but less frequent order blocks, while lower values yield less significant but more frequent order blocks.
Color Inputs: Personalize the look of your chart by selecting the colors for various elements of the indicator. This ensures a seamless integration with your current chart aesthetics and improves visual clarity.
Here is a s creenshot that beautifully demonstrates the power of this indicator. You'll see how the price rejects perfectly off the highest volume segment in an order block, showcasing the indicator's potential for pinpointing high-impact price levels.
While Volume Profile Bar-Magnified Order Blocks offers many unique features, it should be used in conjunction with other indicators and forms of analysis for a complete trading strategy. As with all tools, it does not guarantee profitable trades but is intended to give traders more information to base their decisions on. Use it to complement your existing analysis and enhance your understanding of market behavior.
Experience a new level of clarity in your trading with Volume Profile Bar-Magnified Order Blocks - an indicator that goes beyond the surface to help you navigate the markets more effectively.

SMC Toolkit |ASE|This indicator provides 10+ features all-in-one. Focusing on price action and Smart Money concepts, we have provided automated multi-timeframe features such as Market Structure(BOS / CHoCH) to identify trends, Fair Value Gaps to identify Imbalances, and much more.
Pure price action analysis is a preferred strategy over indicators due to their lag and noise. Many traders popularized SMC or “Smart Money” concepts to identify and trade like/with institutions or Smart Money traders. We have automated these features and made them multi-timeframe to simplify your charting process and advance your trading so you can efficiently trade.
Features:
The included price action features are listed below:
- Multi-Timeframe Market Structure (BOS, CHoCH, MSS, IDM)
- Trend based Candle Coloring
- Multichart (Extra time frame on the same chart)
- Multi-Timeframe Fair Value Gaps & Balanced Price Ranges
- Trapped Market Participants (Multi-Time Frame based on Orderblocks)
- SMT Divergences
- Volume Imbalances
- Premium Discount Array
- Displacement Candles
- Previous OHLC (Daily, Weekly, Monthly)
- VWAP and Std.Dev. Waves
Benefits & Examples:
In the image below we can see plenty of trade setups that formed in confluence with the features we were using. Displayed we have higher timeframe FVGs as our point of interests, Market Structure (Trend Bar Coloring) as our entry confirmation, and Liquidity Levels as our targets.
In this image we can see the same setup as before, higher timeframe FVG with Market Structure reversal targeting a Liquidity Level. In addition we can see the Trapped Market Participants feature showing trapped sellers at the low which provides additional confluence for our long position and offers a cleaner and safer entry on the pullback.
Our goal is to provide as many useful features as possible, automating the process to make it easier and quicker for us as traders. We want to spend less time charting and more time planning proper trades.
Model Indicator |ASE|The purpose of this indicator is to allow the user to build their own model. Each feature works cohesively together and depending on the filters you enable, the model gives less and more specific entries. This benefits the trader because they have complete control over the kinds of trades they want to take, while maintaining its automatic form.
We want to be as customizable as possible while still meeting our users’ needs. We started this indicator to propel us into our ultimate project, the ASE Algo.
Features:
SMC Display
Current Structure:
Liquidity Levels:
Daily Premium Discount Array
SMT Divergence
Displacement Candles:
Entry Factors
FVG
Continuation FVGs
MTF FVGs
Order Blocks
MTF Order Blocks
Confluence Filters
MS Reversal
Liquidity Level Raid
Inducement
Daily Prem/Disc Array
Target Factors
Liquidity Level Targets
Current Structure Targets
Trade Management
Trade Overlay
Risk:Reward Target
Benefits & Examples:
In the image below the indicator signaled multiple entries based on two simple confluence filters, a MS reversal (CHoCH/MSS) and a Liquidity Raid. Going from left to right we can see a short entry at the highs with a supporting Order Block. Liquidity levels are taken before we see a double IDM right below the respected OB that leads to the next signaled entry. In the middle of the chart we see a long entry that leads right into a short entry showing the effectiveness of such a simple model.
In this supporting image we are showcasing the first implementation of the Trade Overlay feature. This feature displays the Entry and Stop Loss to make it more visible and adds a risk to reward target. Additionally displayed is the SMC Toolkit indicator showing us additional confirmation with our signaled entries playing right out of a higher timeframe FVG.
An additional entry feature is the MTF zone. Setups can form on all timeframes and subjecting yourself to only one may lead you to miss out on some perfect setups or a larger move. In the image below we are on the 1 minute timeframe. We can see the Initial Reversal Entry which played out beautifully and filled a higher timeframe SFVG. With the MTF zone we can see a 3 minute and 5 minute Zone which produces the rest of the trend reaching another higher timeframe SFVG after filling the previous one. Once again showing the benefit of the Toolkit indicator but the plotted entries from such a simple model.
In addition to the model indicators filtered out entry zone, we can use additional confluences to confirm these entries. In the image below we can see a short entry printed after a move out of the Std. Dev. vwap wave which shows over extension. Taking the entry we can have a tight stop loss at the vwap wave or the recent high where we have a liquidity level, targeting a lower liquidity level or higher timeframe FVG.
For this example we are only filtering based on MS Reversals (CHoCH/MSS) to get our entries. Because of this we need additional confirmation to be confident in taking the plotted entry. In the image below you can see a long signal printed, confirmation being the previous Failed Reversal.

Market Dynamics Pro [ChartPrime]ChartPrime Market Dynamics Pro is designed to cater to those traders who are more interested in market structures, price action and fundermentals. Analysing volume, key levels in the market, market phases and multi-timeframe can help a trader build a clearer and more actionable view of the market. ChartPrime performs analysis on data in a unique way therefore attempting to give insights into the market otherwise unseen.
Major Features:
Order blocks: The ChartPrime order blocks provide sleek and clear levels in the market where the price might find support and resistance. It is important to note this data isn't availible currently therefore these are derived from data outside of order books. Order blocks are segmented into 4 sections reflecting the volume at a given levels. Low, Medium, High and very high based on relevant and dynamic averages. This allows a trader to identify how significant a level is in the market in a simpler method. Bearish order blocks have a red color bias and bullish order blocks have a green color bias allowing a trader to identify what type of order block it is. The order blocks also dynamically show the remaining volume at that given level.
Pattern Detection: ChartPrime leverages unique pattern identification methods providing earlier and cleaner chart formations. Patterns are commonly used in trading to assess whether bulls or bears are performing optimally in a market or losing strength. ChartPrime identifies; Ascending wedges, descending wedges, symmetrical Triangles, H&S, iH&S, broadening wedges and double tops/bottoms. Patterns often have associated theory behind them for entries and targets that we suggest a trader covers before using this feature. ChartPrime also allow for the user to adjust where a pattern is drawn from. In pattern theory there are 2 main approaches to drawing a formation; from candle body and candle wick. ChartPrime allows for this to be adjusted by a user and also allow for alerts to be set on these patterns.
MTF SR: Taking into account multi timeframes when trading is a key idea. Having ideas of the larger market moves can provide deeper context when trading. ChartPrime Market Dynamics Pro allows for 3 varying SR plots from 3 varying user desired timeframes. These are graded via pivot analysis and grid analysis. This rank is on a 1-10 scale with 1 being the highest rank and 10 is the lowest.
Market Stucutures : These labels are commonly found and used by the Smart Money community. They denote a break of stucture and a chance of character. BOS are labelled when the price breaks a lower low or higher high (in the trending markets) and a CoC occurs when price breaks a trending market pivot. These break a market into clearer breakouts of price action and can help a trader deduce relevant moves. The indicator allows for the user to adjust the detection length of these structures.
Premium and Discount Zones: Premium and Discount zones are underpinned by a simple piece of logic. A premium zone is taken from a higher swing point and the discount from a lower swing point. Although a very generic approach this can show areas in the market that could see a reaction. An asset being in a discount zone implies the price is undervalued. An asset being in a premium zone implies the asset is overpriced or overextended. These are excellent when used in confluence with other SR methods. These naturally will have a delay as they are derived from swing points in a market but still are extremely relevant levels.
Fair Value Gaps: These are gaps in the market where price has seen a highly volatile move and they are assumed to act as magnets in the market. The price may come back and visit these 'gaps' after the move has occured. These are a common technique now used by traders and added to this toolkit for convinience.
Settings:
Order Blocks: Select the scale of the order blocks displayed
BoS/CoC: Toggle these on/off and adjust the lookback on these market structures
Premium/Discount Zones: Toggle on/off and adjust lookback
Enable FVG: Toggle on/off FVGs
Swing Levels: Enable basic swing levels in market
MTF Support/Resistance: Enable and select the relevant timeframe to obtain MTF SR levels on your chart. Up to 3 timeframes at a time.
Predictive Ranges: Toggle on/off
Trend Lines Detection: Toggle on/off trendlines
Wedge Detection: Adjust how patterns are detected; whether from wick or candle body
Toggles provided for relevant patterns.
Example usecases:
ChartPrime order blocks give a deeper insight into market support and resistance levels. Looking for order blocks labelled with High can indicate this level being a significant support or resistance in the market. Adding in further confluences here can assist further in deciding where the price may see a reaction. Take the screenshot below:
Adding in confluences from other timeframes can also help give a broader view. Using the multi time frame graded frame support and resistance levels we can use these to further assist us in finding significant levels in the market.
ChartPrime also provides breaker blocks. These are still significant levels in the market despite being "broken" prior. These too can be used in a classical manor and act as relevant areas in the market. These are particularly effective when used in confluence with Premium and discount zones. We can see in the example below price sees a strong reaction and bounces at these levels.
Market Dynamics Pro provides a comprehensive toolkit of unique features and mixes in the classical concepts allowing for a cleaner charting experience.
All content and indicators provided by ChartPrime are purely for informational & educational purposes only. Past performance does not guarantee future results.
Skrip berbayar

ICT Donchian Smart Money Structure (Expo)█ Concept Overview
The Inner Circle Trader (ICT) methodology is focused on understanding the actions and implications of the so-called "smart money" - large institutions and professional traders who often influence market movements. Key to this is the concept of market structure and how it can provide insights into potential price moves.
Over time, however, there has been a notable shift in how some traders interpret and apply this methodology. Initially, it was designed with a focus on the fractal nature of markets. Fractals are recurring patterns in price action that are self-similar across different time scales, providing a nuanced and dynamic understanding of market structure.
However, as the ICT methodology has grown in popularity, there has been a drift away from this fractal-based perspective. Instead, many traders have started to focus more on pivot points as their primary tool for understanding market structure.
Pivot points provide static levels of potential support and resistance. While they can be useful in some contexts, relying heavily on them could provide a skewed perspective of market structure. They offer a static, backward-looking view that may not accurately reflect real-time changes in market sentiment or the dynamic nature of markets.
This shift from a fractal-based perspective to a pivot point perspective has significant implications. It can lead traders to misinterpret market structure and potentially make incorrect trading decisions.
To highlight this issue, you've developed a Donchian Structure indicator that mirrors the use of pivot points. The Donchian Channels are formed by the highest high and the lowest low over a certain period, providing another representation of potential market extremes. The fact that the Donchian Structure indicator produces the same results as pivot points underscores the inherent limitations of relying too heavily on these tools.
While the Donchian Structure indicator or pivot points can be useful tools, they should not replace the original, fractal-based perspective of the ICT methodology. These tools can provide a broad overview of market structure but may not capture the intricate dynamics and real-time changes that a fractal-based approach can offer.
It's essential for traders to understand these differences and to apply these tools correctly within the broader context of the ICT methodology and the Smart Money Concept Structure. A well-rounded approach that incorporates fractals, along with other tools and forms of analysis, is likely to provide a more accurate and comprehensive understanding of market structure.
█ Smart Money Concept - Misunderstandings
The Smart Money Concept is a popular concept among traders, and it's based on the idea that the "smart money" - typically large institutional investors, market makers, and professional traders - have superior knowledge or information, and their actions can provide valuable insight for other traders.
One of the biggest misunderstandings with this concept is the belief that tracking smart money activity can guarantee profitable trading.
█ Here are a few common misconceptions:
Following Smart Money Equals Guaranteed Success: Many traders believe that if they can follow the smart money, they will be successful. However, tracking the activity of large institutional investors and other professionals isn't easy, as they use complex strategies, have access to information not available to the public, and often intentionally hide their moves to prevent others from detecting their strategies.
Instantaneous Reaction and Results: Another misconception is that market movements will reflect smart money actions immediately. However, large institutions often slowly accumulate or distribute positions over time to avoid moving the market drastically. As a result, their actions might not produce an immediate noticeable effect on the market.
Smart Money Always Wins: It's not accurate to assume that smart money always makes the right decisions. Even the most experienced institutional investors and professional traders make mistakes, misjudge market conditions, or are affected by unpredictable events.
Smart Money Activity is Transparent: Understanding what constitutes smart money activity can be quite challenging. There are many indicators and metrics that traders use to try and track smart money, such as the COT (Commitments of Traders) reports, Level II market data, block trades, etc. However, these can be difficult to interpret correctly and are often misleading.
Assuming Uniformity Among Smart Money: 'Smart Money' is not a monolithic entity. Different institutional investors and professional traders have different strategies, risk tolerances, and investment horizons. What might be a good trade for a long-term institutional investor might not be a good trade for a short-term professional trader, and vice versa.
█ Market Structure
The Smart Money Concept Structure deals with the interpretation of price action that forms the market structure, focusing on understanding key shifts or changes in the market that may indicate where 'smart money' (large institutional investors and professional traders) might be moving in the market.
█ Three common concepts in this regard are Change of Character (CHoCH), and Shift in Market Structure (SMS), Break of Structure (BMS/BoS).
Change of Character (CHoCH): This refers to a noticeable change in the behavior of price movement, which could suggest that a shift in the market might be about to occur. This might be signaled by a sudden increase in volatility, a break of a trendline, or a change in volume, among other things.
Shift in Market Structure (SMS): This is when the overall structure of the market changes, suggesting a potential new trend. It usually involves a sequence of lower highs and lower lows for a downtrend, or higher highs and higher lows for an uptrend.
Break of Structure (BMS/BoS): This is when a previously defined trend or pattern in the price structure is broken, which may suggest a trend continuation.
A key component of this approach is the use of fractals, which are repeating patterns in price action that can give insights into potential market reversals. They appear at all scales of a price chart, reflecting the self-similar nature of markets.
█ Market Structure - Misunderstandings
One of the biggest misunderstandings about the ICT approach is the over-reliance or incorrect application of pivot points. Pivot points are a popular tool among traders due to their simplicity and easy-to-understand nature. However, when it comes to the Smart Money Concept and trying to follow the steps of professional traders or large institutions, relying heavily on pivot points can create misconceptions and lead to confusion. Here's why:
Delayed and Static Information: Pivot points are inherently backward-looking because they're calculated based on the previous period's data. As such, they may not reflect real-time market dynamics or sudden changes in market sentiment. Furthermore, they present a static view of market structure, delineating pre-defined levels of support and resistance. This static nature can be misleading because markets are fundamentally dynamic and constantly changing due to countless variables.
Inadequate Representation of Market Complexity: Markets are influenced by a myriad of factors, including economic indicators, geopolitical events, institutional actions, and market sentiment, among others. Relying on pivot points alone for reading market structure oversimplifies this complexity and can lead to a myopic understanding of market dynamics.
False Signals and Misinterpretations: Pivot points can often give false signals, especially in volatile markets. Prices might react to these levels temporarily but then continue in the original direction, leading to potential misinterpretation of market structure and sentiment. Also, a trader might wrongly perceive a break of a pivot point as a significant market event, when in fact, it could be due to random price fluctuations or temporary volatility.
Over-simplification: Viewing market structure only through the lens of pivot points simplifies the market to static levels of support and resistance, which can lead to misinterpretation of market dynamics. For instance, a trader might view a break of a pivot point as a definite sign of a trend, when it could just be a temporary price spike.
Ignoring the Fractal Nature of Markets: In the context of the Smart Money Concept Structure, understanding the fractal nature of markets is crucial. Fractals are self-similar patterns that repeat at all scales and provide a more dynamic and nuanced understanding of market structure. They can help traders identify shifts in market sentiment or direction in real-time, providing more relevant and timely information compared to pivot points.
The key takeaway here is not that pivot points should be entirely avoided or that they're useless. They can provide valuable insights and serve as a useful tool in a trader's toolbox when used correctly. However, they should not be the sole or primary method for understanding the market structure, especially in the context of the Smart Money Concept Structure.
█ Fractals
Instead, traders should aim for a comprehensive understanding of markets that incorporates a range of tools and concepts, including but not limited to fractals, order flow, volume analysis, fundamental analysis, and, yes, even pivot points. Fractals offer a more dynamic and nuanced view of the market. They reflect the recursive nature of markets and can provide valuable insights into potential market reversals. Because they appear at all scales of a price chart, they can provide a more holistic and real-time understanding of market structure.
In contrast, the Smart Money Concept Structure, focusing on fractals and comprehensive market analysis, aims to capture a more holistic and real-time view of the market. Fractals, being self-similar patterns that repeat at different scales, offer a dynamic understanding of market structure. As a result, they can help to identify shifts in market sentiment or direction as they happen, providing a more detailed and timely perspective.
Furthermore, a comprehensive market analysis would consider a broader set of factors, including order flow, volume analysis, and fundamental analysis, which could provide additional insights into 'smart money' actions.
█ Donchian Structure
Donchian Channels are a type of indicator used in technical analysis to identify potential price breakouts and trends, and they may also serve as a tool for understanding market structure. The channels are formed by taking the highest high and the lowest low over a certain number of periods, creating an envelope of price action.
Donchian Channels (or pivot points) can be useful tools for providing a general view of market structure, and they may not capture the intricate dynamics associated with the Smart Money Concept Structure. A more nuanced approach, centered on real-time fractals and a comprehensive analysis of various market factors, offers a more accurate understanding of 'smart money' actions and market structure.
█ Here is why Donchian Structure may be misleading:
Lack of Nuance: Donchian Channels, like pivot points, provide a simplified view of market structure. They don't take into account the nuanced behaviors of price action or the complex dynamics between buyers and sellers that can be critical in the Smart Money Concept Structure.
Limited Insights into 'Smart Money' Actions: While Donchian Channels can highlight potential breakout points and trends, they don't necessarily provide insights into the actions of 'smart money'. These large institutional traders often use sophisticated strategies that can't be easily inferred from price action alone.
█ Indicator Overview
We have built this Donchian Structure indicator to show that it returns the same results as using pivot points. The Donchian Structure indicator can be a useful tool for market analysis. However, it should not be seen as a direct replacement or equivalent to the original Smart Money concept, nor should any indicator based on pivot points. The indicator highlights the importance of understanding what kind of trading tools we use and how they can affect our decisions.
The Donchian Structure Indicator displays CHoCH, SMS, BoS/BMS, as well as premium and discount areas. This indicator plots everything in real-time and allows for easy backtesting on any market and timeframe. A unique candle coloring has been added to make it more engaging and visually appealing when identifying new trading setups and strategies. This candle coloring is "leading," meaning it can signal a structural change before it actually happens, giving traders ample time to plan their next trade accordingly.
█ How to use
The indicator is great for traders who want to simplify their view on the market structure and easily backtest Smart Money Concept Strategies. The added candle coloring function serves as a heads-up for structure change or can be used as trend confirmation. This new candle coloring feature can generate many new Smart Money Concepts strategies.
█ Features
Market Structure
The market structure is based on the Donchian channel, to which we have added what we call 'Structure Response'. This addition makes the indicator more useful, especially in trending markets. The core concept involves traders buying at a discount and selling or shorting at a premium, depending on the order flow. Structure response enables traders to determine the order flow more clearly. Consequently, more trading opportunities will appear in trending markets.
Structure Candles
Structure Candles highlight the current order flow and are significantly more responsive to structural changes. They can provide traders with a heads-up before a break in structure occurs
-----------------
Disclaimer
The information contained in my Scripts/Indicators/Ideas/Algos/Systems does not constitute financial advice or a solicitation to buy or sell any securities of any type. I will not accept liability for any loss or damage, including without limitation any loss of profit, which may arise directly or indirectly from the use of or reliance on such information.
All investments involve risk, and the past performance of a security, industry, sector, market, financial product, trading strategy, backtest, or individual's trading does not guarantee future results or returns. Investors are fully responsible for any investment decisions they make. Such decisions should be based solely on an evaluation of their financial circumstances, investment objectives, risk tolerance, and liquidity needs.
My Scripts/Indicators/Ideas/Algos/Systems are only for educational purposes!

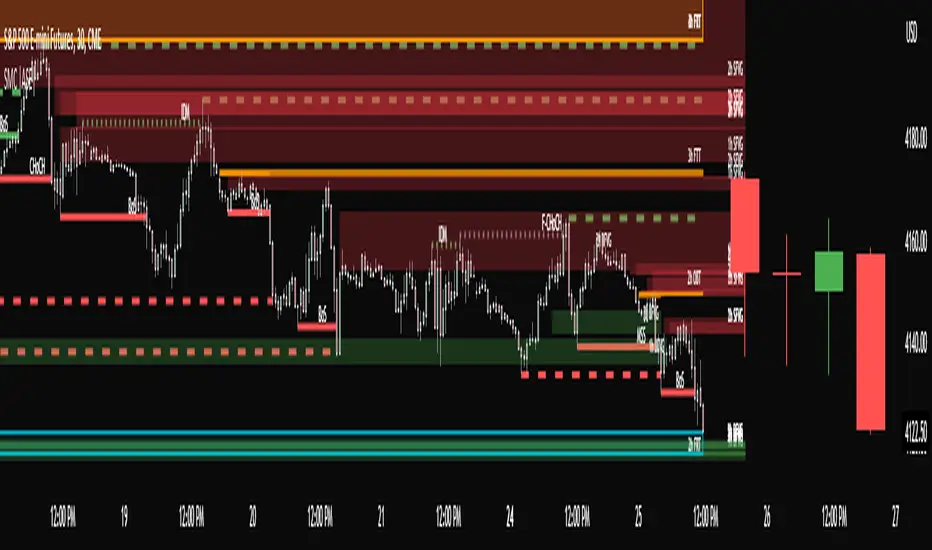
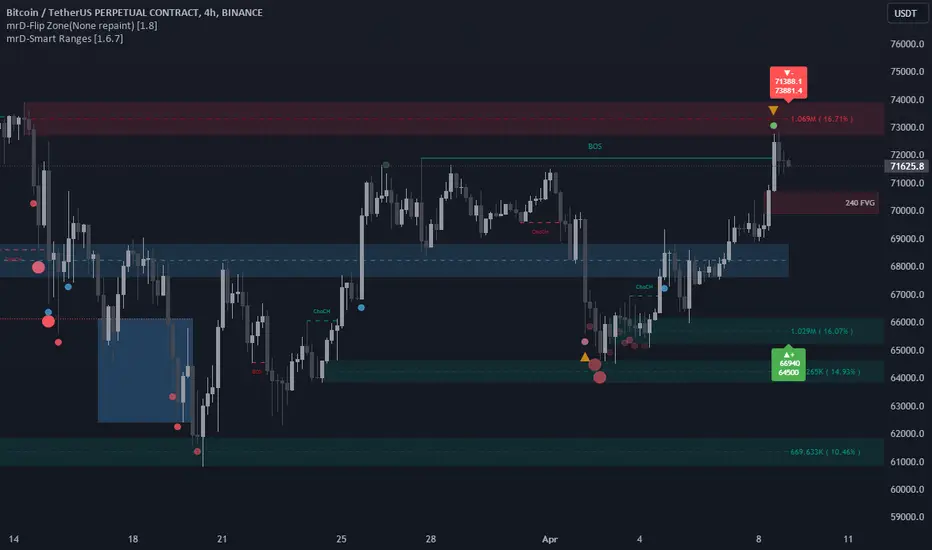
mrD-Smart RangesmrD-Smart Ranges aims to offer a complete strategy based on Order Blocks. Ranges signals based on order volume are highlighted, from which smart ranges are suggested to provide potential entries.
This script also includes warnings for each signal marked.
🔶 SETTINGS
Pair Strategy: Select the desired from the list. Change the chart to the one specified in the Strategy.
Current TF Order Blocks: Allows the user to select how many most recent Internal Order Blocks appear in the current time frame on the chart.
Order Block Filter: Allows the user to select how the script mitigates an Order Block.
Hide Overlap: Allows the user to display overlapping Order Blocks.
Show Metrics: Allows the user to display volume % metrics within the Order Blocks.
Show Volume Box: Allows the user to display buy/sell activity within Order Blocks.
High Timeframe: Allows the user to choose a higher or lower timeframe to find the Signals.
Show Failed Buy Sell: Allows the user to display the Signals.
Show HTF Box: Allows the user to display a higher or lower timeframe Order Blocks.
🔶 DETAILS
Order blocks are formed after a slight bearish order block, these can provide an opportunity to change polarity, thus acting as a potential support/resistance level.
A retest/retrace on the order block, combined with order volume between the current timeframe and from the higher timeframe will establish the conditions for smart ranges are suggested to provide potential entries.
🔶 USAGE
mrD-Smart Ranges aims to provide users with a minimalistic screen next to the optimal ranges to keep in mind to find trading setups as shown below.
Here we can see a suggested Sell range and display a label to confirm this range
Signal(s) that can be used for potential entries only during range retest are order blocks.
Users can search for more potential entry ranges based on larger timeframes in the settings: High Timeframe
In the image above, we can see that the price has generated potential orange and bearish entry signals. A confirmation signal with a red label is displayed on the chart when the price retests the Sell range.
Note: While range retests can still work well if they occur later in price action, it's best to look for signals only when price retests the range at the outset rather than retesting it. second price.
The logic of generating signal ranges using different rules is described below:
- Define order blocks in the current timeframe.
- Define the order blocks with the largest volume in the current timeframe.
- Define order blocks in larger timeframes in High Timeframe settings
- Define order blocks with the largest volume in larger timeframes in High Timeframe settings
Entry Range: The combination of the highest volume order blocks in the current timeframe and the highest volume order blocks in the larger timeframe.
🔶General disclaimer:
Trading stocks, futures, forex, options, ETFs, cryptocurrency, or any other financial instrument has huge potential rewards and risks.
You must be aware of the risks and willing to accept them to invest in stocks, futures, forex, options, ETFs, or cryptocurrencies.
Don't trade with money you can't afford to lose.
This is not an offer or an offer to Buy/Sell stocks, futures, Forex, options, ETFs, cryptocurrencies, or any other financial instrument.
Do not represent that any account will or is likely to achieve profit or loss of any kind.
The past performance of any trading system or method is not necessarily indicative of future results.
My Scripts/Indicators/Ideas/Algos/Systems are only for educational purposes!
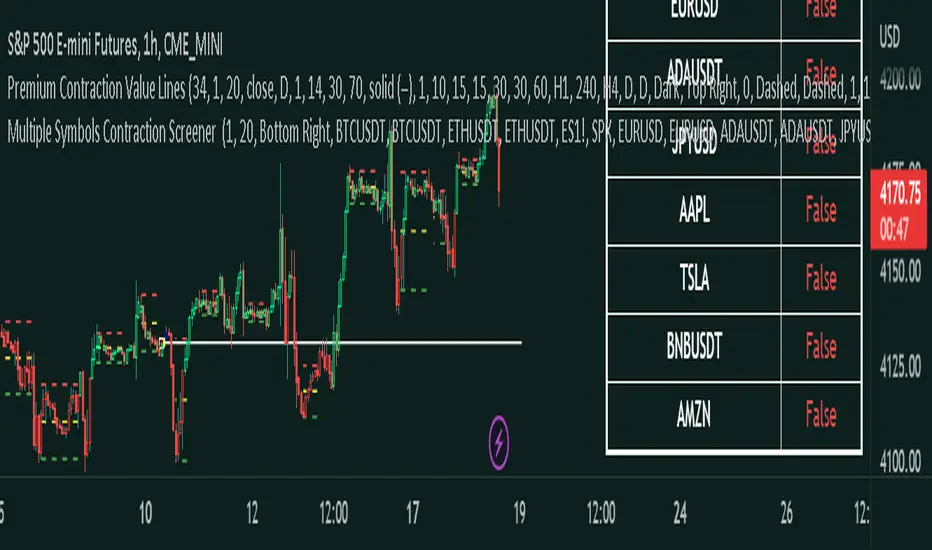
Master Pattern ScreenerMaster Pattern Screener
This is an indicator based on the concept known as the Forex Master Pattern, which contains three phases. The contraction, expansion, and trend phases This indicator, based on your current timeframe, finds out if there is a contraction on 10 symbols that you can customize to suit your needs.
How does it work?
The indicator is a table, and it finds 10 different symbols on the current timeframe that you have selected. Then it does volume and volatility calculations to determine if a contraction is occurring, which is the first phase and probably the most important phase in the FOREX MASTER PATTERN .
This indicator is meant to be used in conjunction with our contraction plotter. We would have placed this indicator in the contraction and expansion plotter, but there were memory limitation issues, so we placed it in a separate indicator.
How traders can use this indicator
The contraction phase is extremely important because once a contraction is occurring, what always happens is an expansion. Some traders will avoid placing trades in the contraction phase, while others will enter to use the momentum for their trades. This indicator just makes it more convenient to identify the contraction phases.
Examples of the indicator:
Things you should know
The symbols can be customized to whatever you want. You can choose your own stocks, cryptocurrencies, currencies, etc.
Make sure that it's exactly the same; if you use, for example, BTCUSDT Coinbase but check on BTCUSDT Binance, then it may show inaccurate results.
Since this script involves a decent amount of calculations, it may not work properly in low timeframes, like anything less than a minute.
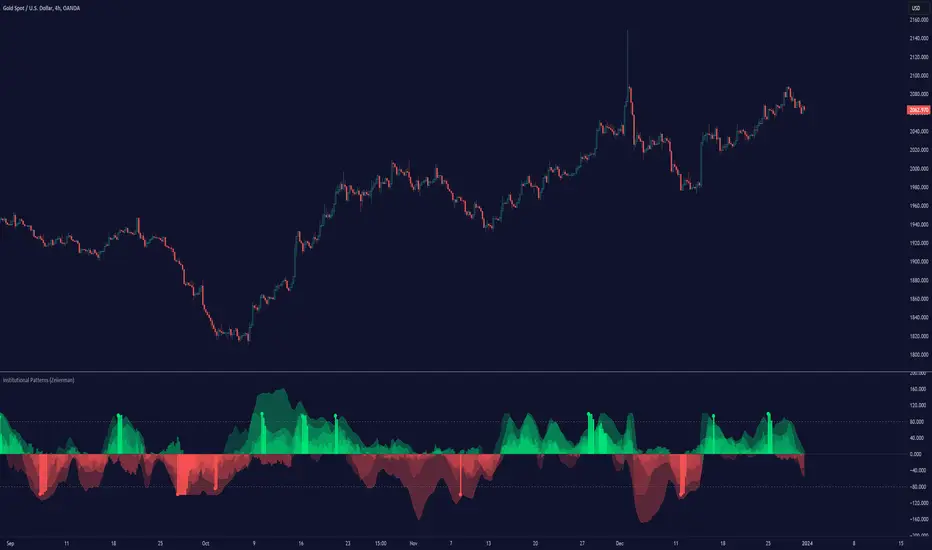
Institutional Patterns (Zeiierman)█ Overview
Institutional Patterns (Zeiierman) reveals how large participants quietly shape market structure. It transforms price, volume, and momentum into a unified view of institutional activity, helping traders see beyond surface volatility to understand where meaningful capital is entering or exiting the market.
The indicator operates through two primary layers:
Pre-Institutional Activity, which highlights early accumulation or distribution before trends emerge, and Institutional Activity , which visualizes active participation once those trends are underway. Each layer combines flow signals from momentum, trend, and volume domains into an adaptive map of market behavior. The result is a fluid representation of how professional money interacts with price, showing when participation is strengthening, fading, or shifting direction.
⚪ Why This One Is Unique
Traditional “smart money” indicators focus on one aspect of market behavior. Institutional Patterns blends multiple adaptive models into a single, self-adjusting framework that evaluates participation strength and direction dynamically.
Its internal flow engine rebalances several momentum and volume dimensions based on changing volatility and structure. This allows it to remain stable in trending environments while still sensitive to early signs of accumulation or exhaustion. Traders gain a clear sense of whether the underlying flow supports or contradicts visible price action.
█ Main Features
⚪ Smart Money Flow
Smart Money Flow provides a multi-dimensional view of how institutional participation evolves beneath price action. It combines several adaptive models that represent different aspects of market behavior—momentum, volatility balance, trend inertia, and volume displacement—into a single synchronized flow structure.
When the flows move together, it shows unified institutional behavior; when they diverge, it signals redistribution, exhaustion, or hidden accumulation. The flow visualization reacts dynamically to volatility shifts, helping traders detect the strength or fragility behind visible price trends.
⚪ Institutional Activity Layer
The Institutional Activity Layer transforms the collective signals of Smart Money Flow into a coherent measure of institutional intent. It visualizes where capital is entering or exiting positions in real time.
Each activity pulse represents the depth of institutional engagement, filtered through adaptive volatility scaling. Green regions highlight expansion phases when capital is building into strength, while red regions indicate contraction or controlled distribution.
This layer bridges the gap between short-term trader behavior and long-term professional positioning, providing a clear and adaptable view of where meaningful market participation truly resides.
⚪ Key Terms
Accumulation vs. Distribution
These terms describe what large participants are doing, not necessarily whether price is going up or down at that moment:
Accumulation: Institutions are building long exposure—quietly buying over time, often during a sideways or suppressed market phase, before a larger uptrend.
Distribution: Institutions are building short exposure or unloading longs—selling gradually into strength, often during or near the end of an uptrend.
In a Uptrend Context
During an uptrend, institutions often accumulate early and distribute later.
Accumulation occurs when large players are building long positions during consolidation or pullbacks, preparing for the next upward leg.
Distribution takes place when they begin offloading those long positions into strength, gradually selling to retail demand near or after market peaks.
In a Downtrend Context
Even in a downtrend, both processes can still occur.
When large players are adding short positions at higher levels, this represents distribution, as they are distributing supply into the market as the price attempts to rally.
When institutions begin covering shorts or quietly building new long exposure for a future recovery, that marks accumulation, reflecting strategic buying while price remains weak and undervalued.
█ How to Use
⚪ Trend Following
The simplest way to use the indicator is to look for alignment across the Smart Money Flow components.
When most of the flows align in green, it signals strong buying pressure and confirms that institutional participation supports the uptrend. This is the ideal environment for trend-following trades in the direction of strength.
When most flows align in red, it indicates dominant selling pressure and active distribution, suggesting short opportunities aligned with the prevailing downtrend.
⚪ Pullbacks
Pullbacks can be identified when the Leading Flow begins to diverge from the primary Smart Money Flow.
If the main flow remains bullish (green) but the leading flow temporarily turns bearish (red), it often marks a short-term retracement within an uptrend. This phase can offer re-entry opportunities for long positions once the flows realign.
In a downtrend, the opposite applies. If the main flow remains bearish (red) and the leading flow turns bullish (green), it signals a temporary countertrend bounce that may provide short re-entry points after the correction fades.
⚪ Breakouts
Breakouts are best confirmed by the Institutional Activity Layer.
A bullish breakout occurs when institutional activity spikes above a breakout level with clear green intensity, confirming active capital expansion and strong follow-through potential.
Conversely, a bearish breakout is confirmed when institutional activity rises below a breakdown level with strong red intensity, signaling renewed distribution and a potential continuation of the downtrend.
⚪ Reversals
Institutional activity can also reveal potential reversal zones.
If red or pink activity appears after an extended downtrend or near a lower trading range, it may indicate accumulation and an upcoming bullish reversal.
If green or aqua activity forms after a prolonged uptrend or near upper resistance levels, it may signal distribution and the beginning of a bearish reversal.
Note: These signals can be the first sign of a potential reversal, but they still need confirmation before taking action.
⚪ Squeeze Detections
Squeeze conditions occur when volume flow begins to diverge from the primary trend, showing early signs of trapped positioning.
If volume flow turns bullish while price and trend flow remain bearish, it suggests buyers are stepping in early. If the price then accelerates downward, longs get trapped and start closing positions, triggering a long liquidation that further fuels the drop.
If volume flow turns bearish while price and trend flow remain bullish, it signals early selling pressure. If the price then pushes higher, shorts begin exiting to limit losses, causing a short squeeze that amplifies the upward move.
█ How It Works
⚪ Flow Integration Framework
The indicator combines several flow components into a single activity field using advanced normalization and smoothing logic. Each flow—trend, momentum, oscillator, and volume bias—contributes a weighted directional influence. These are blended into a balanced structure that represents the strength and direction of institutional behavior across time.
Calculation: Employs multi-domain normalization and weighted signal blending to synchronize phase, reduce noise, and maintain a coherent directional bias across all flow sources.
⚪ Institutional Activity Core
At the core of the system is a volatility-adaptive activity model that interprets both price displacement and volume footprint asymmetry. It measures how trade flow diverges from recent equilibrium and translates that divergence into a refined intensity signal. The model reacts dynamically to imbalances between buying and selling pressure (delta), revealing whether institutional flow is accumulating into strength or distributing into weakness.
Calculation: Utilizes a dynamic volatility envelope combined with delta-weighted response mapping to translate footprint imbalances into a smooth, self-adjusting participation curve.
⚪ Pre-Institutional Detection Engine
The early detection engine isolates latent footprint formations and delta transitions that occur before price movement becomes visible. It examines structural variance, order-flow dispersion, and volatility compression to pinpoint areas where large participants begin to build or unwind positions.
Calculation: Applies entropy-weighted variance mapping and flow compression analysis to reveal pre-breakout regions of capital absorption or release.
-----------------
Disclaimer
The content provided in my scripts, indicators, ideas, algorithms, and systems is for educational and informational purposes only. It does not constitute financial advice, investment recommendations, or a solicitation to buy or sell any financial instruments. I will not accept liability for any loss or damage, including without limitation any loss of profit, which may arise directly or indirectly from the use of or reliance on such information.
All investments involve risk, and the past performance of a security, industry, sector, market, financial product, trading strategy, backtest, or individual's trading does not guarantee future results or returns. Investors are fully responsible for any investment decisions they make. Such decisions should be based solely on an evaluation of their financial circumstances, investment objectives, risk tolerance, and liquidity needs.
Skrip berbayar
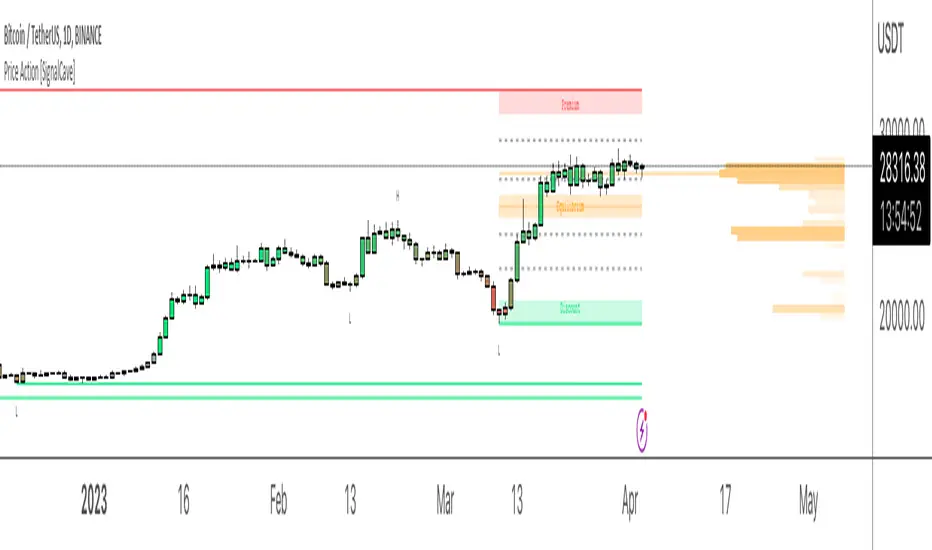
Price Action [SignalCave]Liquidation prices are calculated with Higher Timeframe usage of "Williams Fractals" indicator.
Sell side liquidity levels are shown with "L" text and a green solid lines.
Buy side liquidity levels are shown with "H" text and a red solid lines.
Premium and Discount zones are determined with latest untested buy/sell liquidity levels.
"Premium" means the asset price is overvalued, "Discount" means the asset is undervalued.
Once price hits any active liquidity level, "Premium and Discount" zone will be recalculated.
Premium and Discount have "Equilibrium" area which is center area of the whole zone.
Extra Support & Resistance levels calculation are based on Fibonacci. Levels are 23.6%, 38.2%, 61.8% and 78.6% .
Bars are painted based on asset's momentum. The asset momentum is calculated by the RSI and ADX indicators.
Volume profile shows trade activity during the "Premium and Discount" zone.
Smart Money Concepts Probability (Expo)█ Overview
The Smart Money Concept Probability (Expo) is an indicator developed to track the actions of institutional investors, commonly known as "smart money." This tool calculates the likelihood of smart money being actively engaged in buying or selling within the market, referred to as the "smart money order flow."
The indicator measures the probability of three key events: Change of Character ( CHoCH ), Shift in Market Structure ( SMS ), and Break of Structure ( BMS ). These probabilities are displayed as percentages alongside their respective levels, providing a straightforward and immediate understanding of the likelihood of smart money order flow.
Finally, the backtested results are shown in a table, which gives traders an understanding of the historical performance of the current order flow direction.
█ Calculations
The algorithm individually computes the likelihood of the events ( CHoCH , SMS , and BMS ). A positive score is assigned for events where the price successfully breaks through the level with the highest probability, and a negative score when the price fails to do so. By doing so, the algorithm determines the probability of each event occurring and calculates the total profitability derived from all the events.
█ Example
In this case, we have an 85% probability that the price will break above the upper range and make a new Break Of Structure and only a 16.36% probability that the price will break below the lower range and make a Change Of Character.
█ Settings
The Structure Period sets the pivot period to use when calculating the market structure.
The Structure Response sets how responsive the market structure should be. A low value returns a more responsive structure. A high value returns a less responsive structure.
█ How to use
This indicator is a perfect tool for anyone that wants to understand the probability of a Change of Character ( CHoCH ), Shift in Market Structure ( SMS ), and Break of Structure ( BMS )
The insights provided by this tool help traders gain an understanding of the smart money order flow direction, which can be used to determine the market trend.
█ Any Alert function call
An alert is sent when the price breaks the upper or lower range, and you can select what should be included in the alert. You can enable the following options:
Ticker ID
Timeframe
Probability percentage
-----------------
Disclaimer
The information contained in my Scripts/Indicators/Ideas/Algos/Systems does not constitute financial advice or a solicitation to buy or sell any securities of any type. I will not accept liability for any loss or damage, including without limitation any loss of profit, which may arise directly or indirectly from the use of or reliance on such information.
All investments involve risk, and the past performance of a security, industry, sector, market, financial product, trading strategy, backtest, or individual's trading does not guarantee future results or returns. Investors are fully responsible for any investment decisions they make. Such decisions should be based solely on an evaluation of their financial circumstances, investment objectives, risk tolerance, and liquidity needs.
My Scripts/Indicators/Ideas/Algos/Systems are only for educational purposes!

Trade Entry Check list - Smart Money ConceptThe indicator you see is written to evaluate the input parameters for a trade. Since my own style is smart money, and I always used to write on paper or mentally calculate the necessary inputs for a trade, I wrote this indicator to prevent mental or paper calculations.
This indicator is made up of different sections that you can see in the table and make the necessary changes in the Options section.
The first section is your instrument, which is automatically displayed on every chart.
The next section is the current market, which is written based on smart money and divided into Asia Time, Frankfurt Time, London Time, Lunch Time, and New York Time sections. Depending on our style, we usually do not trade during the Frankfurt Time and Lunch Time sections.
The next section is about the ascending or descending structure of the 4-hour and 15-minute timeframes, which of course, you can change this structure to your desired one.
These two sections have both manual and automatic modes. I went through a lot of trouble for the automatic section, so don't easily skip it and be sure to test it.
The following sections relate to other reasons for entering a trade, which are divided into several sections. The first section is the entry reasons related to my personal strategy, which is completely defined and shows the input calculation in the Calculation section. The second section is your inputs without calculation in the Counter section, and the third section is your personal inputs including the Counter. You have deep access to customizing this table.

BIAS NotesUsage: This indicator allows you to note on your desired pair what is the current state of the trends.
!! How to use: You have to input the values for each table case to your desire in the indicator settings. !!
With this indicator you can note :
-what is the timeframe Bias
-which supply or demand we`ve just hit
I use this as a tool for my analysis with Insitutional Orderflow/SMC (Smart Money Concepts).

ICT Anchored IPDA RangesThis script is an anchored variation of my "ICT IPDA Look Back" script. Similarly, it calculates ICT's daily IPDA look back time intervals and their respective discount / equilibrium / premium; however, it also applies the Forward Cast IPDA daily ranges.
The Forward Cast can be used to estimate the time at which IPDA might initiate a change in institutional order flow. This depends on several factors such as time of the year, and time of daily structure break.
> IPDA Basics:
IPDA stands for Interbank Price Delivery Algorithm. Said algorithm appears to be referencing the past 20, 40 , and 60 days intervals as points of reference to define ranges and related PD arrays.
Intraday traders can find most value in the 20 Day Look Back box, by observing imbalances and points of interest.
Longer term traders can reference the 40 and 60 Day Look Back boxes for a clear indication of current market conditions.
Thanks to @atradesdaily for the suggestion.

Smart Money Concepts (SMC) [LuxAlgo]This all-in-one indicator displays real-time market structure (internal & swing BOS / CHoCH), order blocks, premium & discount zones, equal highs & lows, and much more...allowing traders to automatically mark up their charts with widely used price action methodologies. Following the release of our Fair Value Gap script, we received numerous requests from our community to release more features in the same category.
"Smart Money Concepts" (SMC) is a fairly new yet widely used term amongst price action traders looking to more accurately navigate liquidity & find more optimal points of interest in the market. Trying to determine where institutional market participants have orders placed (buy or sell side liquidity) can be a very reasonable approach to finding more practical entries & exits based on price action.
The indicator includes alerts for the presence of swing structures and many other relevant conditions.
Features
This indicator includes many features relevant to SMC, these are highlighted below:
Full internal & swing market structure labeling in real-time
Break of Structure (BOS)
Change of Character (CHoCH)
Order Blocks (bullish & bearish)
Equal Highs & Lows
Fair Value Gap Detection
Previous Highs & Lows
Premium & Discount Zones as a range
Options to style the indicator to more easily display these concepts
Settings
Mode: Allows the user to select Historical (default) or Present, which displays only recent data on the chart.
Style: Allows the user to select different styling for the entire indicator between Colored (default) and Monochrome.
Color Candles: Plots candles based on the internal & swing structures from within the indicator on the chart.
Internal Structure: Displays the internal structure labels & dashed lines to represent them. (BOS & CHoCH).
Confluence Filter: Filter non-significant internal structure breakouts.
Swing Structure: Displays the swing structure labels & solid lines on the chart (larger BOS & CHoCH labels).
Swing Points: Displays swing points labels on chart such as HH, HL, LH, LL.
Internal Order Blocks: Enables Internal Order Blocks & allows the user to select how many most recent Internal Order Blocks appear on the chart.
Swing Order Blocks: Enables Swing Order Blocks & allows the user to select how many most recent Swing Order Blocks appear on the chart.
Equal Highs & Lows: Displays EQH/EQL labels on chart for detecting equal highs & lows.
Bars Confirmation: Allows the user to select how many bars are needed to confirm an EQH/EQL symbol on chart.
Fair Value Gaps: Displays boxes to highlight imbalance areas on the chart.
Auto Threshold: Filter out non-significant fair value gaps.
Timeframe: Allows the user to select the timeframe for the Fair Value Gap detection.
Extend FVG: Allows the user to choose how many bars to extend the Fair Value Gap boxes on the chart.
Highs & Lows MTF: Allows the user to display previous highs & lows from daily, weekly, & monthly timeframes as significant levels.
Premium/Discount Zones: Allows the user to display Premium, Discount, and Equilibrium zones on the chart
Usage
Users can see automatic CHoCH and BOS labels to highlight breakouts of market structure, which allows to determine the market trend. In the chart below we can see the internal structure which displays more frequent labels within larger structures. We can also see equal highs & lows (EQH/EQL) labels plotted alongside the internal structure to frequently give indications of potential reversals.
In the chart below we can see the swing market structure labels. These are also labeled as BOS and CHoCH but with a solid line & larger text to show larger market structure breakouts & trend reversals. Users can be mindful of these larger structure labels while trading internal structures as displayed in the previous chart.
Order blocks highlight areas where institutional market participants open positions, one can use order blocks to determine confirmation entries or potential targets as we can expect there is a large amount of liquidity at these order blocks. In the chart below we can see 2 potential trade setups with confirmation entries. The path outlined in red would be a potential short entry targeting the blue order block below, and the path outlined in green would be a potential long entry, targeting the red order blocks above.
As we can see in the chart below, the bullish confirmation entry played out in this scenario with the green path outlined in hindsight. As price breaks though the order blocks above, the indicator will consider them mitigated causing them to disappear, and as per the logic of these order blocks they will always display 5 (by default) on the chart so we can now see more actionable levels.
The Smart Money Concepts indicator has many other features and here we can see how they can also help a user find potential levels for price action trading. In the screenshot below we can see a trade setup using the Previous Monthly High, Strong High, and a Swing Order Block as a stop loss. Accompanied by the Premium from the Discount/Premium zones feature being used as a potential entry. A potential take profit level for this trade setup that a user could easily identify would be the 50% mark labeled with the Fair Value Gap & the Equilibrium all displayed automatically by the indicator.
Conclusion
This indicator highlights all relevant components of Smart Money Concepts which can be a very useful interpretation of market structure, liquidity, & more simply put, price action. The term was coined & popularized primarily within the forex community & by ICT while making its way to become a part of many traders' analysis. These concepts, with or without this indicator do not guarantee a trader to be trading within the presence of institutional or "bank-level" liquidity, there is no supporting data regarding the validity of these teachings.

FXC Order Block Finder █ OVERVIEW
The FXC Order Bock Finder finds and draws institutional order blocks according to the Smart Money Concept. Order blocks are zones where institutions have most likely left some orders that need to be filled at a later point in time. In These order blocks or POIs can be used to either place limit orders or to look for instant entries as price comes to retest the zone. It works on all time frames but higher time frames tend to be more precise.
█ HOW DOES IT WORK?
The indicator waits for a break of structure (BOS) and then prints a zone if there's an engulfing pattern and an open imbalance. Basically it draws zones where a fake move followed by aggressive buying or selling happened and Imbalances were left open.
█ WHAT MAKES IT UNIQUE?
Apart from the fact that I haven’t found any indicator that is able to properly draw order blocks most indicators do re-paint which doesn’t make any sense in the case of the Smart Money Concept.
Furthermore does this indicator have settings that let’s you adjust how the order blocks are drawn. From wick to end of the imbalance or candle close to imbalance. Also you can set how many candles it takes into consideration for the imbalance in case the imbalance starts after the engulfing pattern has formed. And you can set how many candles have to checked to determine a BOS or an internal BOS by using fractal breaks.
█ HOW TO USE IT?
Either place sell limits at the lower end of the order block with SL slightly above the OB and buy limits at the upper end of the OB with SL slightly below the OB. Target a fixed Risk Reward Ratio or trade it to the next order block. By using multi time frame analysis you can determine the overall direction of the market and prevent low probability trades. Also worth mentioning is that order blocks that have been created during high volume sessions tend to result in way better trades than with order blocks that have been printed during the Asia session.
█ ADDITIONAL INFO
As soon as price retested an order block the order block is mitigated and therefore not valid anymore. Also order blocks that are too far back in time are less probable to deliver good trades. In general the win rate tends not to be too high using this method but more often than not there's a reaction as price taps into an order block and trades with high RRR are quite often. As always in trading, proper money management and risk management is key.
█ DISCLAIMER
This is not financial advice. The Indicator spots these zones according to the smart money concept . However there's absolutely no guarantee that a nice order blocks results in a good trade.
█ Examples

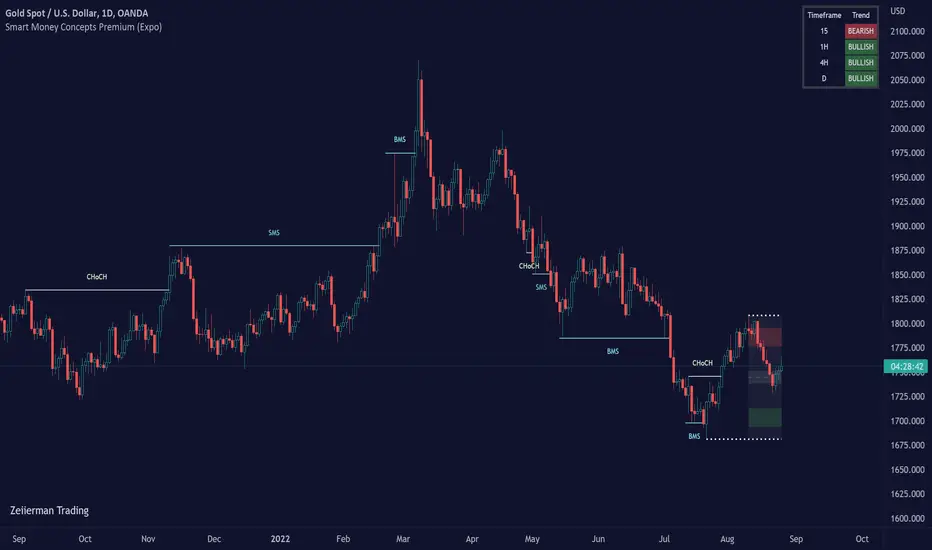
Smart Money Concepts Premium (Expo)Are you a professional Smart Money Concept Trader?
█ This premium version of our SMC indicator includes all advanced Smart Money Concept Trading techniques. The indicator includes all the important concepts such as Market Structure, Change of Character, Current Trading Range, Premium & Discount , Fractals, and Swing Structure. The indicator includes the popular SMC Market Structure Trend to help traders analyze the trend.
In addition to these features, this version adds the following:
Multitimeframe option
Predicted Structure and Range
Backtesting option
External Range Liquidity
Internal Range Liquidity
Liquidity Grab
Fair Value Gap (FVG)
True Fair Value Gap
Imbalance
Order block
Orderflow
Supply & Demand
Equal Highs and Equal Lows
Point of Interest
An alert function that allows you to set any combination of alerts.
This indicator aims to be an all-in-one SMC indicator that helps Smart Money Traders automate their analyzes.
█ HOW TO USE
Use the indicator to trade advanced SMC Trading techniques.
█ Settings
The indicator is fully customized and can be adjusted to fit Swing Trading, Trend Trading, Day Trading, or Scalping.
The indicator works in any market and timeframe.
-----------------
Disclaimer
Copyright by Zeiierman.
The information contained in my Scripts/Indicators/Ideas/Algos/Systems does not constitute financial advice or a solicitation to buy or sell any securities of any type. I will not accept liability for any loss or damage, including without limitation any loss of profit, which may arise directly or indirectly from the use of or reliance on such information.
All investments involve risk, and the past performance of a security, industry, sector, market, financial product, trading strategy, backtest, or individual's trading does not guarantee future results or returns. Investors are fully responsible for any investment decisions they make. Such decisions should be based solely on an evaluation of their financial circumstances, investment objectives, risk tolerance, and liquidity needs.
My Scripts/Indicators/Ideas/Algos/Systems are only for educational purposes!
Skrip berbayar
Smart Money Concept (Expo)Are you Trading SMC? - Are you willing to learn how to apply SMC techniques? - Great, this indicator is for you!
█ This Smart Money Concept ( SMC ) indicator is a sophisticated and highly innovative indicator that combines all the necessary features to trade SMC trading techniques. It is built off of Smart Money Concepts inspired by inner trader circle (ICT) teachings. Smart Money is considered the capital allocated by institutional investors, funds, and other larger financial market participants. This indicator takes the Institutional trading behavior and makes it accessible to retail investors. By using an SMC indicator, you get professional insights into the market.
█ This indicator provides you with all of the most important SMC principles in one indicator. Fully automated and real-time Break of Market Structure, Change of Character, Current Trading Range, Premium & Discount , Fractals, and Swing Structure. In addition to the most important features, we have added a highly unique SMC Market Structure Trend based on the market structure principle. A confirmed swing structure trend background enhances the trend feature even more.
Swing Structure
Identifying major market structures with the indicator.
Current Trading Range
The Range feature ensures that traders always know where the current range is and where to find Premium and Discount within that range. In addition, the range is updated in real-time without any delay.
Premium & Discount Zones
Identifying Premium and Discounts zones automatically for you.
Structure break
Break of Market Structure ( BMS ) and Change of Character ( CHoCH ) - are automatically identified and plotted in real-time.
Supply and Demand
Use our Supply/Demand indicator to identify high probabilities trading zones.
█ HOW TO USE
Use the indicator to trade SMC Trading techniques.
Use the indicator to understand the current market structure.
Use the indicator to identify the current range and premium and discount levels.
█ Settings
The Market structure period is fully customized and can be adjusted to fit Swing Trading, Trend Trading, Day Trading, or Scalping.
The indicator works in any market and timeframe.
█ Basic Terminology
S&D - Supply & Demand
S2D - Supply to Demand
D2S - Demand to Supply
OB - Orderblock
AOI - Area of Interest
POI - Point of Interest
LOR - Level of Respect
FLOR - First Level of Respect
IMB - Imbalance
INF - Inefficiency
FVG - Fair Value Gap
IRL - Internal Range Liquidity
ERL - External Range Liquidity
HH - Higher High
HL - Higher Low
LL - Lower Low
LH - Lower High
BOS - Break of Structure
BMS - Break of Market Structure
mBOS - Minor Break of Structure
SMS - Shift in Market Structure
CHoCH - Change of Character
mCHoCH - minor Change of Character
EQH - Equal Highs
EQL - Equal Lows
BSL - Buy Side Liquidity
SSL - Sell Side Liquidity
LQ - Liquidity
EQ - Equilibrium
PA - Price Action
MTF - Multi Timeframe
HTF - Higher Timeframe
LTF - Lower Timeframe
PT - Protrend
CT - Counter trend
OF - Orderflow
EOF - Expectational Orderflow
LOD - Low of the Day
HOD - High of the Day
HOW - High of the Week
LOW - Low of the week
RE - Risk Entry
CE - Confirmation Entry
DCE - Double Confirmation Entry
SL - Stop loss
RR - Risk Reward
BFI - Banks & Financial Institutions
Hedgies - Hedge Funds
-----------------
Disclaimer
Copyright by Zeiierman.
The information contained in my Scripts/Indicators/Ideas/Algos/Systems does not constitute financial advice or a solicitation to buy or sell any securities of any type. I will not accept liability for any loss or damage, including without limitation any loss of profit, which may arise directly or indirectly from the use of or reliance on such information.
All investments involve risk, and the past performance of a security, industry, sector, market, financial product, trading strategy, backtest, or individual's trading does not guarantee future results or returns. Investors are fully responsible for any investment decisions they make. Such decisions should be based solely on an evaluation of their financial circumstances, investment objectives, risk tolerance, and liquidity needs.
My Scripts/Indicators/Ideas/Algos/Systems are only for educational purposes!

Smart Money ConceptSmart Money Concept is being used to understand the Market Structure, Demand/Supply, and Risk Management.
- Lines represent BoS and CHoCH.
- X-cross and Diamond shapes represent Peak and Trough.
- Numbers represent the Spread Percentages.

SMC RulesThis script allowes you to have a plan always shown on the chart.
You know how it is, sometimes you miss things and if you dont see your plan then you miss maybe an important part... so for this i wrote that simple script here.
So far it has 5 Sections you can edit in the settings to your liking.
On top you can also edit the swing structure you are seeing, so you dont have to always swap timeframes.
Also implemented are the Session times for Frankfurt, London, New York and Asia.
Its not enabled on default, but i find it quiet handy to have..
(including alerts)
I will update it from time to time, if you wish for something just let me know.
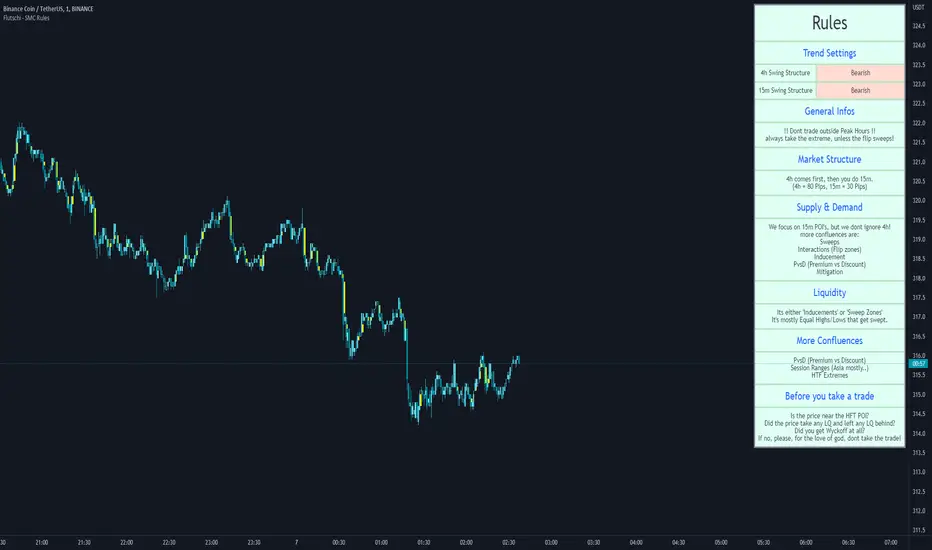
Smart Money BusterAfter daytrading for a while i came into conclusion that price action trading is the most successful way to trade for me and this project was for me to simplify my way of trading at the beginning. Eventually it got big and turned into a very useful helper indicator for me to setup on different pairs for alerts and only look at the charts to decide for entry when the alerts come from 120 different pairs that i set it up. Since i always looked at indicators for a way to make my job simpler and give me more time to do more important things for me rather than drawing lines on different pairs eveyday i think it got to a point where it works to my liking and making me gain time, thus more money.
This indicator uses smart money concepts like Market Structure, Order Blocks, Quassimodo Levels, Structure Breaks, Pumps and Dumps, Imbalances(In the works will be added in first update) to help trader catch what the whales are thinking and how to enter in the right time for swing trading, catching bottoms and tops.
Here are some of the features as of release:
Detects Market Structure and draws zig-zag lines and keeps note of pivot points.
Detects Order blocks and draws boxes when the conditions met
Detects the quassimodo levels and changes the color of the box to signal double confluence meaning stronger signal
Draws structure break lines
Setting to set structure break percentage before drawing boxes to get the boxes drawn if you want to be more 'sure' about the Order Block Levels.
Setting to change depth and backstep values for zigzags to be able to let you fit the system for different time frames.
Setting to set MSB trigger point between High and Low, Close and Open or hl2 values.
Setting to set Signal Triggering Range between Start, Middle and End meaning eg. if you set it to Middle it will wait for MSB trigger point to hit the middle of the box before giving you a signal.
Setting for changing HH-LL pivot points lookback count, 5 as default. Increasing this value will make you compare your pivot points with more data, really useful in lower time frames where will be a lot of zig-zags and highs and lows giving you a method to avoid false signals. Recommended to keep it lower values on 30 min and higher and increase it in lower Timeframes according to market volatility.
Setting to add a Box limit where the box of order block will be set invalid after certain candles and it still didn't trigger. Default value of 0 means it's disabled.
Setting to set Candle volatility percentage value to avoid big candles getting opposite signals on fast pump or dump schemes and bust those market makers schemes. Gotta say this came out really handy in crypto markets :)
As an end you can set alerts for 'Buy' , ' Sell ', ' Buy and Sell' together or if you wish you can connect it to bots via webhook as an entry. Although haven't connected to any bots myself as i think the best method of trading is human and machine working together. Since we have the creativity and out of the box thinking and machines have the ability to brute force calculation and huge bandwith that we don't currently have. At least until Elon Musk turns is into a cyborg, which i am not very eager about.
Planned Features:
- Add ability to detect imbalances(fair value gaps) to add third confluence to detect dragon fruit entries. This will make the system work with triple confluence.
- Add more settings so humans can command the ai better.
- Maybe a strategy version after i write my own dynamic take profit algorithm to give system ability make quantitative decisions based on current position profit levels.
- Although i think i fixed almost all the important bugs if there ever comes up one bugs will take priority for updates.
- And some things i may decide to add later. I will keep working on this project since it works well for me.
And like always, happy trading.

[VC] Cumulative Delta PLUS It is a Merged Version of our following two indicators.
V.C Box Chart Histogram
&
V.C Cumulative Delta Histogram.
We merged them at the user's request & convenience. This merged version also helps to save space for other indicators.
Description & Usage
Description & Usage will remain the same as described in individual descriptions of the above-mentioned parent indicators. Only one additional input is added to adjust the scale, named "Scale_Setting''.
Because now it's a merged version of 2 different indicators & both indicators have their different scale levels. To bring both indicators on an equal scale so that they can be visualised better, we have added scale adjustment settings that are easy to understand. Let's elaborate it.
Scale adjustment settings belong to the Cumulative length of the ' 'Cumulative Delta Indicator'' . Keep in mind that the best scale setting is keeping the scale setting values near or equal to cumulative length.
For example:
If you set cumulative length 20, the scale setting value should also be 20 or near 20 (like 17, 18, 19 etc.). (It depends on you, how large cumulative columns you want to see relative to Box chart Histogram)
Note: Any scale setting value can be used, it only affects visuals, not the actual calculations.
Disclaimer Note:
V.C Cumulative Delta Histogram It is purely Volume, Delta, Demand & Supply imbalance and comparative analysis-based tool. Before applying this Indicator to your study, you should clear your concepts about Volume, Delta & Spread, Demand & Supply, and Aggressive & Passive behaviour of buyers/sellers.
Some basic understanding of Sir Richerd Wyckoff's Theory can also be helpful.
