Dominance Signal Apex [CHE]]Dominance Signal Apex — Triple-confirmed entry markers with stateful guardrails
Summary
This indicator focuses on entry timing by plotting markers only when three conditions align: a closed-bar Heikin-Ashi bias, a monotonic stack of super-smoother filters, and the current HMA slope. A compact state machine provides guardrails: it starts a directional state on closed-bar Heikin-Ashi bias, maintains it only while the smoother stack remains ordered, and renders a marker only if HMA slope agrees. This design aims for selective signals and reduces isolated prints during mixed conditions. Markers fade over time to visualize the age and persistence of the current state.
Motivation: Why this design?
Common triggers flip frequently in noise or react late when regimes shift. The core idea is to gate entry markers through a closed-bar state plus independent filter alignment. The state machine limits premature prints, removes markers when alignment breaks, and uses the HMA as a final directional gate. The result is fewer mixed-context entries and clearer clusters during sustained trends.
What’s different vs. standard approaches?
Reference baseline: Single moving-average slope or classic MA cross signals.
Architecture differences:
Multi-length two-pole super-smoother stack with strict ordering checks.
Closed-bar Heikin-Ashi bias to start a directional state.
HMA slope as a final gate for rendering markers.
Time-based alpha fade to surface state age.
Practical effect: Entry markers appear in clusters during aligned regimes and are suppressed when conditions diverge, improving selectivity.
How it works (technical)
Measurements: Four recursive super-smoother series on price at short to medium horizons. Up regime means each shorter smoother sits below the next longer one; down regime is the inverse.
State machine: On bar close, positive Heikin-Ashi bias starts a bull state and negative bias starts a bear state. The state terminates the moment the smoother ordering breaks relative to the prior bar.
Rendering gate: A marker prints only if the active state agrees with the current HMA slope. The HMA is plotted and colored by slope for context.
Normalization and clamping: Marker transparency transitions from a starting to an ending alpha across a fixed number of bars, clamped within the allowed range.
Initialization: Persistent variables track state and bar-count since state start; Heikin-Ashi open is seeded on the first valid bar.
HTF/security: None used. State updates are closed-bar, which reduces repaint paths.
Bands: Smoothed high, low, centerline, and offset bands are computed but not rendered.
Parameter Guide
Show Markers — Toggle rendering — Default: true — Hides markers without changing logic.
Bull Color / Bear Color — Visual colors — Defaults: bright green / red — Aesthetic only.
Start Alpha / End Alpha — Transparency range — Defaults: one hundred / fifty, within zero to one hundred — Controls initial visibility and fade endpoint.
Steps — Fade length in bars — Default: eight, minimum one — Longer values extend the visual memory of a state.
Smoother Length — Internal band smoothing — Default: twenty-one, minimum two — Affects computed bands only; not drawn.
Band Multiplier — Internal band offset — Default: one point zero — No impact on markers.
Source — Input for HMA — Default: close — Align with your workflow.
Length — HMA length — Default: fifty, minimum one — Larger values reduce flips; smaller values react faster.
Reading & Interpretation
Entry markers:
Bull marker (below bar): Closed-bar Heikin-Ashi bias is positive, smoother stack remains aligned for up regime, and HMA slope is rising.
Bear marker (above bar): Closed-bar Heikin-Ashi bias is negative, smoother stack remains aligned for down regime, and HMA slope is falling.
Fade: Transparency progresses over the configured steps, indicating how long the current state has persisted.
Practical Workflows & Combinations
Trend following: Focus on marker clusters aligned with HMA color. Add structure filters such as higher highs and higher lows or lower highs and lower lows to avoid counter-trend entries.
Exits/Stops: Consider exiting or reducing risk when smoother ordering breaks, when HMA color flips, or when marker cadence thins out.
Multi-asset/Multi-TF: Suitable for liquid crypto, FX, indices, and equities. On lower timeframes, shorten HMA length and fade steps for faster response.
Behavior, Constraints & Performance
Repaint/confirmation: State transitions and marker eligibility are decided on closed bars; live bars do not commit state changes until close.
security()/HTF: Not used.
Resources: Declared max bars back of one thousand five hundred; recursive filters and persistent states; no explicit loops.
Known limits: Some delay around sharp turns; brief states may start in noisy phases but are quickly revoked when alignment fails; HMA gating can miss very early reversals.
Sensible Defaults & Quick Tuning
Start here: Keep defaults.
Too many flips: Increase HMA length and raise fade steps.
Too sluggish: Decrease HMA length and reduce fade steps.
Markers too faint/bold: Adjust start and end alpha toward lower or higher opacity.
What this indicator is—and isn’t
A selective entry-marker layer that prints only under triple confirmation with stateful guardrails. It is not a full system, not predictive, and does not handle risk. Combine with market structure, risk controls, and position management.
Disclaimer
The content provided, including all code and materials, is strictly for educational and informational purposes only. It is not intended as, and should not be interpreted as, financial advice, a recommendation to buy or sell any financial instrument, or an offer of any financial product or service. All strategies, tools, and examples discussed are provided for illustrative purposes to demonstrate coding techniques and the functionality of Pine Script within a trading context.
Any results from strategies or tools provided are hypothetical, and past performance is not indicative of future results. Trading and investing involve high risk, including the potential loss of principal, and may not be suitable for all individuals. Before making any trading decisions, please consult with a qualified financial professional to understand the risks involved.
By using this script, you acknowledge and agree that any trading decisions are made solely at your discretion and risk.
Best regards and happy trading
Chervolino
Smoothed

Heikin Ashi Overlay SuiteHeikin Ashi Overlay Suite is designed to give traders more control and clarity when working with Heikin Ashi candles — whether you're analyzing trend strength, reducing chart noise, or simply improving your visual read of market momentum. It works by layering multiple types of HA overlays and color systems on top of your standard candlestick chart — without switching chart types. With dynamic gradient coloring, smoothing options, and a predictive line tool, this script helps you see not just what the current trend is, but how strong it is, and what it would take to reverse it.
Heikin Ashi candles help reduce noise but this script goes further by:
➡️adding color intelligence that shows trend strength using a streak counter
➡️uses smoothing logic to clean up chop and whipsaws
➡️introduces a predictive close line — a subtle but powerful guide for anticipating trend flips before they happen
Everything is configurable: colors, candle sources, overlays, predictive tools, and line styles. It’s built for traders who want visual speed, but don’t want to sacrifice signal quality.
At its core, the script offers two powerful dropdown controls:
💥HA Color Scheme (Colors Regular Candles) — Applies Heikin Ashi-derived coloring to your regular candles based on trend direction or streak strength. This gives you instant visual context without switching to a separate chart type.
💥HA Candle Overlay Mode — Overlays actual Heikin Ashi-style candles directly on top of your chart, using your preferred source:
➡️Custom HA candles using internal formula logic
➡️TradingView’s built-in Heikin Ashi source with your own colors
➖➖➖➖➖➖➖➖➖➖➖➖➖➖➖➖➖➖➖➖➖➖➖➖➖➖➖➖➖➖➖
🎨 Custom + Gradient HA Coloring🎨
See trend strength at a glance:
➡️1–4 bar streaks → lighter tone
➡️5–8 bars → medium tone
➡️9+ bars → bold tone, ideal for momentum-based entries, exits, or scaling strategies
→ Choose from:
➡️Your own custom color set
➡️A simple 2-color base mode
➡️Or a 3-level gradient for progressive trend analysis (using the streak counter)
🏛️ TradingView Official Heikin Ashi Overlay
Prefer native HA candles but want your own colors?
This mode plots TradingView's Heikin Ashi source, with your personal bullish/bearish color scheme.
➡️Ensures consistency with built-in charts while still leveraging your visual style.
🌊 Smoothed Heikin Ashi Candles — Clarity in Chaos🌊
These aren’t your standard HA candles. Smoothed Heikin Ashi uses a two-step EMA process to transform chaotic price action into a cleaner, slower-moving trend structure:
🔹 First, it smooths the raw OHLC data using EMA — filtering out minor price fluctuations.
🔹 Then, it applies the Heikin Ashi transformation on top of the smoothed data.
🔹 Finally, it applies a second EMA smoothing pass to the HA values — creating ultra-smooth candles.
📈 What You See:
Trends appear more fluid and consistent.
Choppy ranges and fakeouts are visually suppressed.
Minor pullbacks within a trend are de-emphasized, helping you avoid premature exits.
🎯 Best For:
Swing traders looking to stay in positions longer.
Intraday traders dealing with volatile or noisy instruments.
Anyone who wants a "trend map" overlay without the distractions of raw price action.
✅ Reduces whipsaws
✅ Delivers high-contrast trend zones
✅ Makes reversals more visually apparent (but with a slight lag)
📍 Predictive Close Line📍
Shows where the real close must land to flip the current HA candle's color.
✅ Use it like predictive support/resistance
✅ Know if the trend is actually at risk
✅Visualize potential fakeouts or confirmation
Color-coded based on current HA direction (bullish, bearish, or neutral).
📈 Tick by tick & bar-to-bar Plots📈
Provides 2 plot types:
1)1 plot that tracks a bar tick by tick
2)another plot that tracks the close from bar to bar
For the bar to bar plot, you can choose between 2 options:
✅Full Plot — continuous line colored by HA trend
✅Recent Segments — color just the last few bars (configurable) to reduce chart clutter
✅ Customize width, number of bars, and visibility
➖➖➖➖➖➖➖➖➖➖➖➖➖➖➖➖➖➖➖➖➖➖➖➖➖➖➖➖➖➖➖
📘 How to Use this script📘
Imagine you're watching a choppy 15-minute chart on a volatile crypto pair — price action is messy, and it’s hard to tell if a trend is forming or just noise.
Here’s how to cut through the chaos using Heikin Ashi Overlay Suite:
🔹 Step 1: Enable "Smoothed HA Candles"
Start by turning on the smoothed candles. You’ll immediately notice the noise fades, and broader directional moves become easier to follow. It's like switching from static to clean trend zones.
🧠 Why: Smoothed HA uses a double EMA process that filters out small reversals and lets larger moves stand out. Perfect for sideways or jittery charts.
🔹 Step 2: Watch the Color Gradient Build
As the smoothed candles begin to align in one direction, the gradient coloring (1–4, 5–8, 9+ streaks) gives you an at-a-glance visual of how strong the trend is.
✅ If you see 9+ same-colored candles? You’re likely in a mature trend.
✅ If it resets often? You’re in chop — consider staying out.
🔹 Step 3: Use the Predictive Close Line for Anticipation
Now here’s the edge — this line tells you where the candle would have to close to flip colors.
📉 If price is hovering just above it during a bullish run — momentum may be weakening.
📈 If price bounces off it — the trend may be strengthening.
This is excellent for confirming entries, exits, or spotting early warning signs.
🔹 Step 4: Switch Between Candle Modes as Needed
You can flip between:
✅ Custom HA: Gradient candles with your colors
✅ TradingView HA: The official source with your styling
✅ None: Just color regular candles using the HA logic
Use what fits your style — everything is modular.
🔹 Step 5: Tune It to Your Chart
Lastly, tweak streak thresholds (currently only can do this within the source code), smoothing lengths, and line styles to match your timeframe and strategy.
🎯 Tailor The Settings to Fit Your Trading Style🎯
🔹 🧪 Scalper (1–5 min charts)
If you’re trading fast intraday moves, you want quicker responsiveness and less lag.
Try these settings:
🔸Smoothing Lengths: Use lower values (e.g. len = 3, len2 = 5)
🔸Candle Mode: Use Custom HA or TV’s HA for real-time color flips
🔸Predictive Close Line: Great for ultra-fast anticipation of color reversals
🔸Line Mode: Use Recent Segments mode to track short bursts of trend
🔸Colors: Use high-contrast, opaque colors for clarity
✅ These settings help you catch micro-trends and flip signals faster, while still filtering out the worst of the noise.
🔹 🧪 Swing Trader (30m–4h charts and beyond)
If you’re looking for multi-hour or multi-day trend confirmation, prioritize clarity and staying in moves longer.
Recommended setup:
🔸Smoothing Lengths: Medium to high values (e.g. len = 8, len2 = 21)
🔸Candle Mode: Use Smoothed HA Candles to block out intrabar chop
🔸Gradient Colors: Enable to visualize trend maturity and strength
🔸Predictive Close Line: Helps confirm trend continuation or spot early reversals
🔸Line Mode: Use Full Plot Line for clean HA-based trend tracking
✅ These settings give you a calm, clean view of the bigger picture — ideal for holding positions longer and avoiding early exits.
🔧 This script isn’t just a chart overlay — it’s a visual trend engine.🔧
Ideal For:
🔶 Trend-followers who want clean, color-coded confirmation
🔶 Reversal traders spotting exhaustion via predictive flips
🔶 Scalpers filtering noise with lighter smoothing
🔶 Swing traders using smoothed visuals to hold longer
📌 Final Note
Heikin Ashi Overlay Pro is designed to help you see momentum, trend shifts, and market structure with greater clarity — not to predict price on its own. For best results:
✔️ Combine with support/resistance, moving averages, or price action patterns
✔️ Use Predictive Close as a confirmation tool, not a signal generator
✔️ Pair gradient colors with structure to gauge trend maturity
✔️ Always zoom out and check higher timeframes for context
🧠 Use this as part of a layered approach — not a standalone system.
🙏 Credits🙏
⚡HA logic based on SimpleCryptoLife
⚡Smoothed HA concept adapted from a script by Jackvmk
💡💡💡Turn logic into clarity. Structure into trades. And uncertainty into confidence.💡💡💡

Multi-Fibonacci Trend Average[FibonacciFlux]Multi-Fibonacci Trend Average (MFTA): An Institutional-Grade Trend Confluence Indicator for Discerning Market Participants
My original indicator/Strategy:
Engineered for the sophisticated demands of institutional and advanced traders, the Multi-Fibonacci Trend Average (MFTA) indicator represents a paradigm shift in technical analysis. This meticulously crafted tool is designed to furnish high-definition trend signals within the complexities of modern financial markets. Anchored in the rigorous principles of Fibonacci ratios and augmented by advanced averaging methodologies, MFTA delivers a granular perspective on trend dynamics. Its integration of Multi-Timeframe (MTF) filters provides unparalleled signal robustness, empowering strategic decision-making with a heightened degree of confidence.
MFTA indicator on BTCUSDT 15min chart with 1min RSI and MACD filters enabled. Note the refined signal generation with reduced noise.
MFTA indicator on BTCUSDT 15min chart without MTF filters. While capturing more potential trading opportunities, it also generates a higher frequency of signals, including potential false positives.
Core Innovation: Proprietary Fibonacci-Enhanced Supertrend Averaging Engine
The MFTA indicator’s core innovation lies in its proprietary implementation of Supertrend analysis, strategically fortified by Fibonacci ratios to construct a truly dynamic volatility envelope. Departing from conventional Supertrend methodologies, MFTA autonomously computes not one, but three distinct Supertrend lines. Each of these lines is uniquely parameterized by a specific Fibonacci factor: 0.618 (Weak), 1.618 (Medium/Golden Ratio), and 2.618 (Strong/Extended Fibonacci).
// Fibonacci-based factors for multiple Supertrend calculations
factor1 = input.float(0.618, 'Factor 1 (Weak/Fibonacci)', minval=0.01, step=0.01, tooltip='Factor 1 (Weak/Fibonacci)', group="Fibonacci Supertrend")
factor2 = input.float(1.618, 'Factor 2 (Medium/Golden Ratio)', minval=0.01, step=0.01, tooltip='Factor 2 (Medium/Golden Ratio)', group="Fibonacci Supertrend")
factor3 = input.float(2.618, 'Factor 3 (Strong/Extended Fib)', minval=0.01, step=0.01, tooltip='Factor 3 (Strong/Extended Fib)', group="Fibonacci Supertrend")
This multi-faceted architecture adeptly captures a spectrum of market volatility sensitivities, ensuring a comprehensive assessment of prevailing conditions. Subsequently, the indicator algorithmically synthesizes these disparate Supertrend lines through arithmetic averaging. To achieve optimal signal fidelity and mitigate inherent market noise, this composite average is further refined utilizing an Exponential Moving Average (EMA).
// Calculate average of the three supertends and a smoothed version
superlength = input.int(21, 'Smoothing Length', tooltip='Smoothing Length for Average Supertrend', group="Fibonacci Supertrend")
average_trend = (supertrend1 + supertrend2 + supertrend3) / 3
smoothed_trend = ta.ema(average_trend, superlength)
The resultant ‘Smoothed Trend’ line emerges as a remarkably responsive yet stable trend demarcation, offering demonstrably superior clarity and precision compared to singular Supertrend implementations, particularly within the turbulent dynamics of high-volatility markets.
Elevated Signal Confluence: Integrated Multi-Timeframe (MTF) Validation Suite
MFTA transcends the limitations of conventional trend indicators by incorporating an advanced suite of three independent MTF filters: RSI, MACD, and Volume. These filters function as sophisticated validation protocols, rigorously ensuring that only signals exhibiting a confluence of high-probability factors are brought to the forefront.
1. Granular Lower Timeframe RSI Momentum Filter
The Relative Strength Index (RSI) filter, computed from a user-defined lower timeframe, furnishes critical momentum-based signal validation. By meticulously monitoring RSI dynamics on an accelerated timeframe, traders gain the capacity to evaluate underlying momentum strength with precision, prior to committing to signal execution on the primary chart timeframe.
// --- Lower Timeframe RSI Filter ---
ltf_rsi_filter_enable = input.bool(false, title="Enable RSI Filter", group="MTF Filters", tooltip="Use RSI from lower timeframe as a filter")
ltf_rsi_timeframe = input.timeframe("1", title="RSI Timeframe", group="MTF Filters", tooltip="Timeframe for RSI calculation")
ltf_rsi_length = input.int(14, title="RSI Length", minval=1, group="MTF Filters", tooltip="Length for RSI calculation")
ltf_rsi_threshold = input.int(30, title="RSI Threshold", minval=0, maxval=100, group="MTF Filters", tooltip="RSI value threshold for filtering signals")
2. Convergent Lower Timeframe MACD Trend-Momentum Filter
The Moving Average Convergence Divergence (MACD) filter, also calculated on a lower timeframe basis, introduces a critical layer of trend-momentum convergence confirmation. The bullish signal configuration rigorously mandates that the MACD line be definitively positioned above the Signal line on the designated lower timeframe. This stringent condition ensures a robust indication of converging momentum that aligns synergistically with the prevailing trend identified on the primary timeframe.
// --- Lower Timeframe MACD Filter ---
ltf_macd_filter_enable = input.bool(false, title="Enable MACD Filter", group="MTF Filters", tooltip="Use MACD from lower timeframe as a filter")
ltf_macd_timeframe = input.timeframe("1", title="MACD Timeframe", group="MTF Filters", tooltip="Timeframe for MACD calculation")
ltf_macd_fast_length = input.int(12, title="MACD Fast Length", minval=1, group="MTF Filters", tooltip="Fast EMA length for MACD")
ltf_macd_slow_length = input.int(26, title="MACD Slow Length", minval=1, group="MTF Filters", tooltip="Slow EMA length for MACD")
ltf_macd_signal_length = input.int(9, title="MACD Signal Length", minval=1, group="MTF Filters", tooltip="Signal SMA length for MACD")
3. Definitive Volume Confirmation Filter
The Volume Filter functions as an indispensable arbiter of trade conviction. By establishing a dynamic volume threshold, defined as a percentage relative to the average volume over a user-specified lookback period, traders can effectively ensure that all generated signals are rigorously validated by demonstrably increased trading activity. This pivotal validation step signifies robust market participation, substantially diminishing the potential for spurious or false breakout signals.
// --- Volume Filter ---
volume_filter_enable = input.bool(false, title="Enable Volume Filter", group="MTF Filters", tooltip="Use volume level as a filter")
volume_threshold_percent = input.int(title="Volume Threshold (%)", defval=150, minval=100, group="MTF Filters", tooltip="Minimum volume percentage compared to average volume to allow signal (100% = average)")
These meticulously engineered filters operate in synergistic confluence, requiring all enabled filters to definitively satisfy their pre-defined conditions before a Buy or Sell signal is generated. This stringent multi-layered validation process drastically minimizes the incidence of false positive signals, thereby significantly enhancing entry precision and overall signal reliability.
Intuitive Visual Architecture & Actionable Intelligence
MFTA provides a demonstrably intuitive and visually rich charting environment, meticulously delineating trend direction and momentum through precisely color-coded plots:
Average Supertrend: Thin line, green/red for uptrend/downtrend, immediate directional bias.
Smoothed Supertrend: Bold line, teal/purple for uptrend/downtrend, cleaner, institutionally robust trend.
Dynamic Trend Fill: Green/red fill between Supertrends quantifies trend strength and momentum.
Adaptive Background Coloring: Light green/red background mirrors Smoothed Supertrend direction, holistic trend perspective.
Precision Buy/Sell Signals: ‘BUY’/‘SELL’ labels appear on chart when trend touch and MTF filter confluence are satisfied, facilitating high-conviction trade action.
MFTA indicator applied to BTCUSDT 4-hour chart, showcasing its effectiveness on higher timeframes. The Smoothed Length parameter is increased to 200 for enhanced smoothness on this timeframe, coupled with 1min RSI and Volume filters for signal refinement. This illustrates the indicator's adaptability across different timeframes and market conditions.
Strategic Applications for Institutional Mandates
MFTA’s sophisticated design provides distinct advantages for advanced trading operations and institutional investment mandates. Key strategic applications include:
High-Probability Trend Identification: Fibonacci-averaged Supertrend with MTF filters robustly identifies high-probability trend continuations and reversals, enhancing alpha generation.
Precision Entry/Exit Signals: Volume and momentum-filtered signals enable institutional-grade precision for optimized risk-adjusted returns.
Algorithmic Trading Integration: Clear signal logic facilitates seamless integration into automated trading systems for scalable strategy deployment.
Multi-Asset/Timeframe Versatility: Adaptable parameters ensure applicability across diverse asset classes and timeframes, catering to varied trading mandates.
Enhanced Risk Management: Superior signal fidelity from MTF filters inherently reduces false signals, supporting robust risk management protocols.
Granular Customization and Parameterized Control
MFTA offers unparalleled customization, empowering users to fine-tune parameters for precise alignment with specific trading styles and market conditions. Key adjustable parameters include:
Fibonacci Factors: Adjust Supertrend sensitivity to volatility regimes.
ATR Length: Control volatility responsiveness in Supertrend calculations.
Smoothing Length: Refine Smoothed Trend line responsiveness and noise reduction.
MTF Filter Parameters: Independently configure timeframes, lookback periods, and thresholds for RSI, MACD, and Volume filters for optimal signal filtering.
Disclaimer
MFTA is meticulously engineered for high-quality trend signals; however, no indicator guarantees profit. Market conditions are unpredictable, and trading involves substantial risk. Rigorous backtesting and forward testing across diverse datasets, alongside a comprehensive understanding of the indicator's logic, are essential before live deployment. Past performance is not indicative of future results. MFTA is for informational and analytical purposes only and is not financial or investment advice.

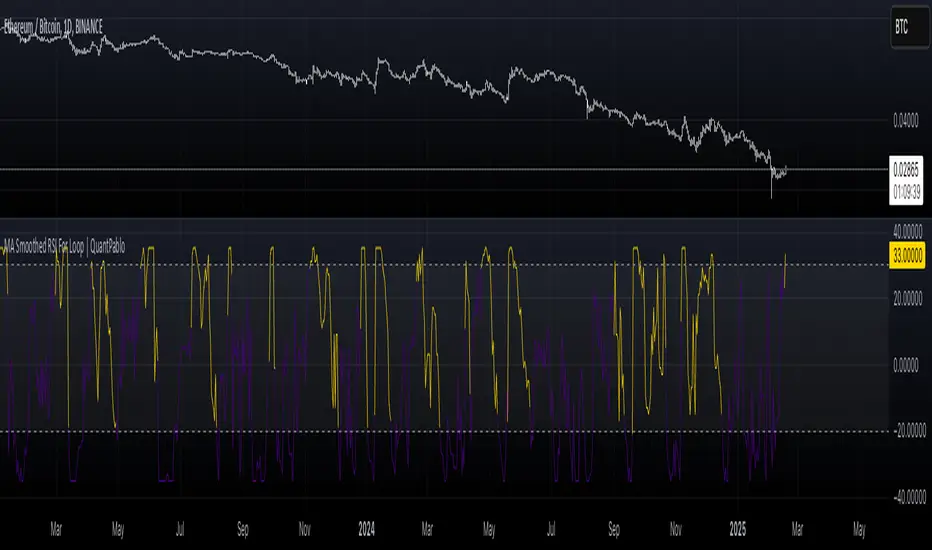
MA Smoothed RSI For Loop | QuantPabloMA Smoothed Source For RSI Loop | Crypto_Mercenary_
Conceptual Foundation and Innovation
The "MA Smoothed Source For RSI Loop" indicator developed by Crypto_Mercenary_ innovates by smoothing the source data used for RSI calculation with various moving averages before feeding it into a for-loop scoring system. Rather than smoothing the RSI itself, this approach focuses on pre-processing the price data to reduce noise, thereby providing a cleaner input for RSI computation. The for-loop then evaluates this smoothed RSI to generate momentum signals, offering traders a refined method for detecting market trends and potential reversals.
Technical Composition and Calculation
The indicator's functionality is divided into two main parts:
Source Smoothing: Before calculating RSI, the source data (typically close price) is smoothed using one of several moving averages (EMA, SMA, WMA, VWMA, HMA, RMA, DEMA, or none) as selected by the user. This smoothing aims to filter out short-term volatility, providing a more consistent base for RSI calculation.
RSI Calculation and For-Loop Scoring:
RSI: Calculated using the smoothed source data over a user-defined length.
For-Loop Mechanism: A loop runs from a to b, comparing the current RSI value with past values of this smoothed RSI. A score (counter) is generated, which increases or decreases based on whether the current RSI exceeds or falls below past values. If the weighted option is activated, this comparison gives more weight to recent data points, adjusting the score accordingly.
The final score is then potentially normalized for better interpretation, compared against thresholds to determine market momentum signals.
Features and User Inputs
This indicator is highly customizable, allowing traders to tailor its behavior:
Weighted Calculation: Option to adjust scoring to favor recent price action.
RSI Length: Sets the period for RSI calculation.
Source: The price data to be smoothed before RSI calculation, default is close.
MA Type: Choice from various moving averages to smooth the source data.
Smooth Length: Length of the moving average used for smoothing.
For Loop Range: Defines the historical range (a to b) for the scoring loop.
Thresholds: Custom thresholds to define when signals for uptrends or downtrends are generated.
Practical Applications
This indicator is particularly beneficial for:
Identifying Momentum Shifts: The scoring system helps in detecting potential changes in market momentum.
Noise Reduction: By smoothing the source data, it aims to provide more reliable RSI signals in volatile markets.
Trend Analysis: Assists in confirming or challenging the current market trend based on the smoothed RSI's performance.
Advantages and Strategic Value
The "MA Smoothed Source For RSI Loop" offers an advantage by focusing on cleaning the input data for RSI, which can lead to more accurate momentum readings. Its flexibility in configuration allows traders to adapt the indicator to different market conditions or asset volatilities, enhancing its strategic value in trading decisions.
Alerts and Visual Cues
Visual Signals: The indicator plots the loop score, with colors indicating uptrends (gold) or downtrends (blue). Horizontal lines at thresholds and shaded areas between them provide visual aids for trend analysis.
**No explicit alerts in the script, but users can set up custom alerts based on the signals.
Summary and Usage Tips
The "MA Smoothed Source For RSI Loop | Crypto_Mercenary_" provides a nuanced approach to RSI by smoothing the price data before its calculation, resulting in potentially more reliable signals. Traders can use this indicator to gain a clearer picture of market momentum, adjusting parameters to fit different market behaviors or trading strategies. Remember, the effectiveness of this tool largely depends on its customization to the specific market context.
Note: Backtests are based on past results and do not guarantee future performance.
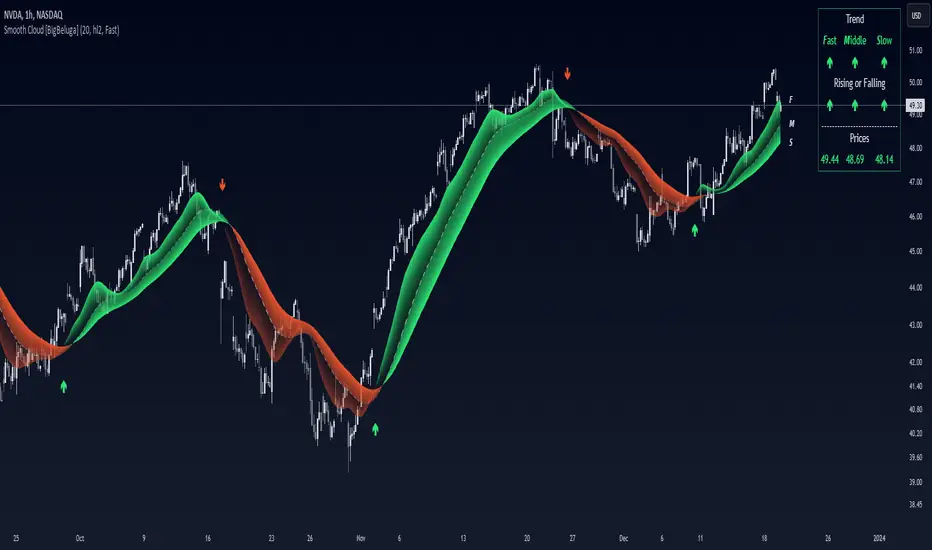
Smooth Cloud [BigBeluga]This trend-following indicator, called Smooth Cloud, is built on top of a SuperSmoother Filter of John Ehlers with small modification.
It consists of three smoothed lines—Fast, Middle, and Slow—that together form a cloud. These lines are based on different periods, helping traders analyze market changes over different timeframes (fast, mid, and slow). The indicator offers a color-coded visual cloud to depict trend direction, along with a detailed dashboard that shows the positioning of the lines, whether they are rising or falling, and their price levels.
🔵 IDEA
The Smooth Cloud indicator is designed to help traders quickly assess the market trend by using three smoothed lines with varying periods. The lines represent fast, mid, and slow market changes, and their relative positioning provides a clear view of trend shifts. The dashboard gives a more granular view by showing if the lines are rising or falling individually, without comparing them to each other, providing insights into potential trend changes before they are fully formed. The color-coded cloud further enhances the visual experience by allowing traders to see trend direction at a glance, making it easier to spot major and minor shifts in the market.
🔵 KEY FEATURES & USAGE
◉ Three Smoothed Lines (Fast, Mid, Slow):
The indicator consists of three smoothed lines, each representing a different periods. The Fast line reacts more quickly to price changes, while the Slow line reacts more slowly, allowing traders to capture both short-term and long-term trend information. The lines are based on different lengths, and their positioning relative to each other helps determine market direction.
◉ Color-Coded Cloud:
The cloud formed between the lines is color-coded to indicate trend direction. When the Fast line is above the Slow line, it signals an upward trend, and the cloud is green. When the Fast line is below the Slow line, the cloud turns red, indicating a downward trend. This color coding makes it easy to spot the overall trend direction visually without having to analyze the lines in detail.
◉ Dashboard for Line Positioning and Trend Direction:
A dashboard in the top right corner of the chart shows the positioning of the Fast, Middle, and Slow lines relative to each other. It displays arrows for each line to indicate whether the line is above or below the other lines. For exae determines its trend direction based on its position to mid line — if it's above, an upward arrow is displayed, and if it's below mid line, a downward arrow is shown.mple, if the Fast line is above the Slow line, the dashboard shows an upward arrow for the Fast line. The Slow lin
Up trend:
Up trend shift:
Down trend shift:
Down Trend:
◉ Rising and Falling Detection:
The dashboard also tracks whether the lines are rising or falling based solely on their own values. If a line rises or falls consistently over three bars, the dashboard shows an upward or downward arrow under the "Rising or Falling" section. This feature provides additional insight into the market's momentum, allowing traders to spot potential trend reversals more quickly.
◉ Price Levels for Fast, Middle, and Slow Lines:
The dashboard includes the price levels for the Fast, Middle, and Slow lines, displayed at the bottom. These levels give traders a quick reference for where the lines are currently positioned relative to the price, adding further context to the trend information displayed.
◉ Fast Signals:
The fast signals are diplayed when fast line crosses slow line. Gree arrows up shows fast line crossed over slow and when arrow down fast line crossed under slow one.
🔵 CUSTOMIZATION
Length Input: You can adjust the length parameter, which affects the smoothing period for the lines. A shorter length makes the lines react more quickly to price changes, while a longer length provides a smoother, more gradual response.
Source Input: The indicator uses the hl2 source (the average of the high and low prices), but you can change this to another source to better suit your trading strategy.
Signals Type: Select between "Fast" and "Slow". Fast signals - is interaction of fast and slow lines. Slow signals is interaction of mid and slow lines
Related script:
MTF Smoothable RSI Nexus [DarkWaveAlgo]🧾 Description:
A nexus is a connection, link, or neuronal junction where signals and information are transmitted between different elements.
The MTF Smoothable RSI Nexus indicator serves as a nexus between smoothable, MTF RSIs by facilitating the visualization and interaction of up to six multi-timeframe RSIs, each with its own customizable timeframe, period, coloring customization, and price source. By combining these various RSIs, it helps you create a comprehensive view of MTF momentum trends and dynamics.
It acts as a control center that brings together multiple MTF RSIs and allows you to visualize the interactions between them with exceptional ease-of-use and customizability, helping to provide you with valuable insights into potential trend reversals, momentum shifts, and trading opportunities.
💡 Originality and Usefulness:
While there are other multi-timeframe RSI indicators available, MTF Smoothable RSI Nexus' global smoothing settings offer a flexible take on the development of price momentum across various timeframes. Its semi-transparent overbought and oversold fill zones create a compounding opaqueness when RSIs from multiple timeframes coalesce - making visual assessment of momentum extremes incredibly easy. We also believe it stands above the rest with its sheer quantity and quality of settings, features, and usability.
✔️ Re-Published to Avoid Misleading Values
This script has been re-published to ensure that it does not use `request.security()` calls using lookahead_on to access future data when referencing RSIs from other timeframes. This decreases the likelihood that the indicator will provide deceiving values. This change has been made in accordance with the PineScript documentation: "Using barmerge.lookahead_on at timeframes higher than the chart's without offsetting the `expression` argument like in `close [ ]` will introduce future leak in scripts, as the function will then return the `close` price before it is actually known in the current context" and the Publishing Rule: "Do not use `request.security()` calls using lookahead to access future data". Historical and real-time values may differ when referencing timeframes other than the chart's.
💠 Features:
6 toggleable MTF Smoothable RSIs with customizable timeframes, periods, and price sources
Compounding overbought/oversold filled areas for easy MTF momentum analysis
Aesthetic and flexible coloring and color theme styling options
End-of chart labels and options for ease-of-use and legibility
⚙️ Settings:
Use a Color Theme: When this setting is enabled, all manual 'Bullish and Bearish Colors' are overridden. All plots will use the colors from your selected Color Theme - excepting those plots set to use the 'Single Color' coloring method.
Color Theme: When 'Use a Color Theme' is enabled, this setting allows you to select the color theme you wish to use.
Hide RSIs on Timeframes Lower Than the Chart: When this setting is enabled, any MTF RSI with a timeframe smaller than that of the chart the indicator is applied to will be hidden from view.
Overbought Level: Set the level value for the overbought line.
Oversold Level: Set the level value for the oversold line.
Overbought Color: When 'Use a Color Theme' is disabled, this will set the color for the Overbought Level line.
Oversold Color: When 'Use a Color Theme' is disabled, this will set the color for the Oversold Level line.
Fill Overbought/Oversold Areas: When enabled, the area between any MTF RSI and the Overbought/Oversold level will be filled with semi-transparent coloring if that RSI is above/below the respective level.
Smooth RSIs: When enabled, all MTF RSIs will be processed through an additional smoothing average calculation.
Smoothing Type: Set the calculation type for the smoothing process. Options include: Exponential, Simple, Weighted, Volume-Weighted, and Hull.
Enable: Show/hide a specific MTF RSI.
Timeframe: Set the timeframe for a specific MTF RSI.
Period: Set the lookback period for a specific MTF RSI.
Source Price: Set the source value used for a specific MTF RSI's calculation.
Coloring Method: Set the coloring method for this specific RSI. The coloring method defines how the RSI should be dynamically colored. Options include: 'Single Color' and 'Increasing/Decreasing'.
Bullish Color: When 'Use a Color Theme' is disabled, this will set the 'bullish color' for this specific MTF RSI.
Bearish Color: When 'Use a Color Theme' is disabled, this will set the 'bearish color' for this specific MTF RSI.
Single Color: When the 'Coloring Method' is set to Single Color for this specific RSI, this color option will set the RSI's color.
Enable Label: When enabled, a label will show at the end of the chart displaying the timeframe, period, smoothing type (if any), and current price value of this specific MTF RSI.
Size: Sets the font size of this specific MTF RSI's label.
Label Offset (in Bars): Sets the distance from the latest bar, in bars, at which this specific MTF RSI's label is displayed.
Show Label Line: When enabled, this specific MTF RSI's label will be accommodated by a dashed line connecting it to its plot.
📈 Chart:
The chart shown in this original publication displays the 15 minute chart on ETHUSDT. Displayed on the chart are 4 MTF RSIs: the 15m 14 WMA-Smoothed RSI, 1h 14 WMA-Smoothed RSI, 4h 14 WMA-Smoothed RSI, and the 1D 14 WMA-Smoothed RSI - offering an exemplary view of how you can easily use these MTF RSIs to your advantage in analyzing momentum relationship across multiple timeframes.

Multi SMI Ergodic OscillatorThe Multi SMI Ergodic Oscillator (Multi SMIEO) indicator can be used to identify potential buy and sell signals based on the relationship between the TSI and EMA lines.
The script is creating an indicator that plots multiple (3) sets of Time Series Indicator (TSI-Indicator) and Exponential Moving Average (EMA-Signal) lines as a single indicator.
The TSI is a momentum oscillator that helps identify overbought and oversold conditions. It is calculated using the close prices of an asset, a short-term moving average, and a long-term moving average. The script uses three different pairs of input values for the short-term and long-term periods, which can be adjusted by the user.
The EMA is a type of moving average that gives more weight to recent prices. It is calculated by applying a weighting factor to the most recent price, and then adding that weighted value to the previous EMA value. The script uses three different input values for the length of the EMA, which can also be adjusted by the user.
After calculating the TSI and EMA for each set, the script plots them on the same graph, with different colors and widths to differentiate them. The three sets of TSI and EMA lines are plotted to allow the user to compare the results of different periods. The script also plots a horizontal line at zero, which is used as a reference point for the oscillations of the indicator lines.
One way to use this indicator is to look for crossovers between the TSI and the EMA lines. A bullish crossover occurs when the TSI crosses above the EMA. This suggests that the buying pressure is increasing and a potential buy signal is generated. A bearish crossover occurs when the TSI crosses below the EMA. This suggests that the selling pressure is increasing and a potential sell signal is generated.
Some other ways that the indicator can be used include:
1. Identifying trends: The TSI and EMA lines can be used to identify the direction of the trend. An uptrend is present when the TSI and EMA lines are both trending upwards, while a downtrend is present when the TSI and EMA lines are both trending downwards.
2. Overbought and oversold conditions: The TSI can be used to identify overbought and oversold conditions. When the TSI is above the upper limit of the range, the asset is considered overbought and may be due for a price correction. Conversely, when the TSI is below the lower limit of the range, the asset is considered oversold and may be due for a price rebound.
3. Confirming price action: The Multi SMIEO indicator can be used to confirm price action. If a bullish divergence is present, it confirms a potential bullish reversal. If a bearish divergence is present, it confirms a potential bearish reversal.
4. Multiple time frame analysis: By using different periods for the TSI and EMA lines, the indicator can be used to analyze the asset on multiple time frames. It can be useful to compare the results of different periods to get a better understanding of the asset's price movements.
5. Risk management: This indicator can be used as an element of risk management strategy, it can help traders to identify overbought and oversold conditions to set stop loss or take profit levels.
The Multi SMI Ergodic Oscillator (Multi SMIEO) is a versatile indicator that can be used in a number of ways to analyze the price movements of an asset. It can be used to identify potential buy and sell signals, trends, overbought and oversold conditions, and to confirm price action. By using different periods for the TSI and EMA lines, the indicator can also be used to analyze the asset on multiple time frames. However, it is important to remember that indicators are based on historical data, and past performance does not guarantee future results.
It is important to use the indicator as part of a comprehensive trading strategy that includes risk management and other analysis techniques, such as fundamental and technical analysis. It is also important to keep in mind that indicators are not a standalone solution for trading, they should be used in conjunction with other market analysis and research techniques to generate better results.
Lastly, it is important to keep in mind that trading in financial markets comes with a certain level of risk and it is crucial to always have a proper risk management plan in place. Never invest more than you can afford to lose.

Smooth EMA/DEMA/TEMA/EHMA (SEMA)This is my attempt at smoothing the exponential moving average any its cousins. I literally just smoothed the source and alpha and this is what we got. I really like this because you get a nice smooth yet fast acting moving average that works better than a traditional simple moving average. This script also included directional alerts.
Smooth EMA
Smooth DEMA
Smooth TEMA
Smooth EHMA

Adaptive Fisherized CMOIntroduction
Heyo, here is another no-repaint adaptive fisherized indicator.
I added Inverse Fisher Transform, Ehlers dominant cycle analysis and smoothing to the Chande Momentum Oscillator (CMO).
Usage
The CMO is a momentum oscillator which shows the usual movement of an asset.
I recommend to use it from a lower timeframe with a higher timeframe set.
Signals
(Signal mode will come soon.)
Zero Line
CMO crosses above zero line => enter long
CMO cross below zero line => ente short
Overbought/Oversold
CMO crosses above bottom band => enter long
CMO crosses under top band => enter short
MA (Maybe this signals will vary. Then, check update notes.)
CMO crosses above MA => enter long
CMO crosses below MA => enter short
Enjoy and share your experience with it!
More to read: CMO Explanationsp

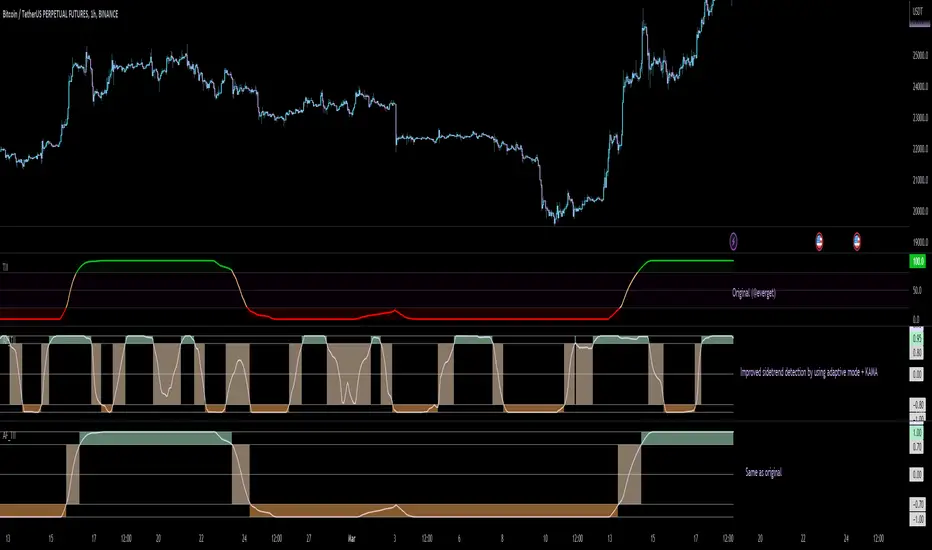
Adaptive Fisherized Trend Intensity Index Introduction
Here, I modified the script "Trend Intensity Index" (TII) of @everyget.
TTI was developed by M.H. Pee, who also published other trend analysis indicators like the Trend Trigger/Continuation Factor
It helps to determine how strong the current trend is.
The stronger the trend, the higher the chance the price may continue moving in the current direction.
Features
Adaptive mode (based on Ehlers dominant cycle determination) => automatically determines the length
Inverse Fisher Transform => gives sharper signals
Customizable MA Types => discover the impact of different ma bases
Hann Window and NET smoothing => state-of-the-art smoothing
Trend Visualization => shows you the up/down/side trend
Usage
This indicator here offers a perfect trend filtering system. It is capable of up/down/side trend detection.
There are a lot of trend indicators which don't respect sidetrends, which makes this indicator pretty useful.
A lot of traders use trend-following trading systems.
A trader will usually make his/her entry in the market during a strong trend and ride it, until the TII provides an indication of a reversal.
For mean-revertive trading systems, you could use TII to just trade in side trend.
A lot of mean-revertive signal emitters like Bollinger Bands or RSI work most of the times better in side trend.
Furthermore, every timeframe could be used, but higher timeframes have more impact because trends are stronger there.
Signals
Green zone (Top) => Etablished bullish trend
"Peachy" Zone (Middle) => Sidetrend/flat market
Red Zone (Bottom) => Etablished bearish trend
Enjoy guys!
(Let me know your opinions!)
--
Credits to:
@blackcat1402
@DasanC
@cheatcountry
@everget
Adaptive Fisherized CMFIntroduction
Heyo, here I made a normalized Chaikin Money Flow (CMF) indicator with Inverse Fisher Transform (IFT) and some smoothing techniques.
I had to normalize the indicator in order to fit it to the IFT range (-1 -> 1).
Moreover, the good old adaptive mode is also included in this indicator. It uses Ehlers superb dominant cycle techniques.
It also has divergence detection, several options for individualisation and doesn't repaint.
Usage
www.investopedia.com
Signals
CMF above 0 => bullish market
CMF below 0 => bearish market
(You can also use the inner bands instead of the zero line, to make these signals more precise)
Bullish regular/hidden divergence => long
Bearish regular/hidden divergence => short
Enjoy guys!
PS: I really would like to hear some feedback of you.
Adaptive Fisherized ROCIntroduction
Hello community, here I applied the Inverse Fisher Transform, Ehlers dominant cycle determination and smoothing methods on a simple Rate of Change (ROC) indicator
You have a lot of options to adjust the indicator.
Usage
The rate of change is most often used to measure the change in a security's price over time.
That's why it is a momentum indicator.
When it is positive, prices are accelerating upward; when negative, downward.
It is useable on every timeframe and could be a potential filter for you your trading system.
IMO it could help you to confirm entries or find exits (e.g. you have a long open, roc goes negative, you exit).
If you use a trend-following strategy, you could maybe look out for red zones in an in uptrend or green zones in a downtrend to confirm your entry on a pullback.
Signals
ROC above 0 => confirms bullish trend
ROC below 0 => confirms bearish trend
ROC hovers near 0 => price is consolidating
Enjoy! 🚀
Williams Fractals + SMMAwilliams fractail + smoothed moving average. moving average. williams fractails with moving average , williams fractails + MA, smma

Fisherized CCIIntroduction
This here is a non-repainting indicator where I use inverse Fisher transformation and smoothing on the well-known CCI (Commdity Channel Index) momentum indicator.
"The Inverse Fisher Transform" describes the calculation and use of the inverse Fisher transform by Dr . Ehlers in 2004. The transform is applied to any indicator with a known probability distribution function. It enables to transform an indicator signal into the range between +1 and -1. This can help to eliminate the noise of an indicator.
The CCI is an momentum indicator which describes the distance of the price to the average price.
For smoothing I used the Hann Window and NET (Noise Elimination Technique) methods.
Additional Features
Divergence Analysis
Trend-adaptive Histogram
Timeframe selection
Usage
It is usually used to spot potential trend reverals or mean-reversion (against the trend) trades on lower timeframes. IMO it can be even used to spot trend-following trades. It always depends on which settings you have, which timeframe do you use and which indicators you combine with it.
The suggested timeframe for this indicator is 15 min (with the length setting on 50).
The histogram with adaptive mode enabled could be used as filter applied on the buy and sell signals.
The divergence analysis can help to spot additional entries/exits or confirm the buy and sell signals.
Always try to find the best settings! This indicators has a lot of customization options you should take advantage of.
Signals
The indicator uses the following logic to generate the buy and sell signals:
Normal
Buy -> When CCI and MA go above the top band (usually +100) and cross
Sell -> When CCI and MA go below the the bottom band (usually -100) and cross
Fisherized
Buy -> When CCI and MA go above the the zero line and cross
Sell -> When CCI and MA go below the the zero line and cross
Have fun with the indicator! I am open for feedback and questions. :)

Jurik Smoothed Stochastic - TraderHalaiJurik Smoothed Stochastic
The stochastic indicator has been long used by traders to identify inflection points in the price and to give a direction on Bullish and Bearish bias.
This indicator aims to improve on the plots the %K value smoothed using a Jurik Filter instead of a simple moving average. This allows for a more adaptive K value average price, whilst also providing superior smoothing to traditional moving averages.
As the Jurik Filter is a proprietary and non-open-source implementation, this script uses a common filters library implementation of Jurik MA which is a suitable proxy to the actual Jurik MA filter.
Big thanks to LastGuru for making his version freely available. You can find his version of the Jurik Filters in the credits section below.
%K is the Jurik Smoothed Version of the original Stochastic Formula
%D is calculated using the following formula. This idea was borrowed from John Ehler’s stochastic implementation and can be seen below:
%D = 0.05 + 0.95 * K
Features
%K line, Overbought and Oversold level and Mid Line Level
Oversold / Overbought reversal indicators and signals - Shown in Red and Green
Bullish / Bearish Divergences – Including Hidden divergences to spot reversals and continuations of trend (Big thanks to the developers of the built-in RSI Divergence indicator) - Shown as below:
Bullish / Bearish crossover of %K with %D - Shown in Cyan and Fuschia
Alerts for all of the above conditions
Double Jurik smoothing mode - similar to slow Stochastic
Credits :
Massive shoutout to the following scripts:
LastGuru JurikMA implementation (Common Filters Library)
Divergence Indicator – Built into TradingView and coded by TradingView Developers
This script is published as open source to allow for criticism, further development of this strategy and use by the community. Feel free to use this indicator/source code as you see fit.
Enjoy! :)

Smoothed Heiken AshiIt is a Heiken Ashi candle overlay. It has a selectable moving average before HA calculation and another after HA calculation, to smooth original Heiken Ashi candles.
It can be used:
Detecting Short/Long term trend direction
Dynamic support/resistance, not just a line, but it has a height
Trailing stop
Trend reversal detection, when price cross above/below Heiken Ashi candle
A lot of moving averages can be selected to adjust it to the selected market.
It uses my TAExt library, so you can use it in your strategies as well.

Smoothed Heiken Ashi - SamXThis is my version of the Smoothed Heiken Ashi indicator. While there are a few versions of these out there (most notably "Modified Smoothed Heiken Ashi" by badshah_e_alam and "Smoothed Heiken Ashi Candles v1" by jackvmk), none matched what I was looking for.
1. All had hard-coded the smoothing to use the EMA calculation - in this indicator, these are user-configurable
2. Both applied the double-smoothing principle (Take a moving-average of price, apply the Heiken Ashi conversion, then apply a second moving average to the smoothed Heiken Ashi candles to calculate new candles). While this is the most common approach, I had a few issues with this:
Even if setting both moving average lengths to 1, the indicator did not correctly calculate what should be the actual corresponding Heiken Ashi candle values (as compared to the built-in Heiken Ashi chart on Tradingview)
They were inconsistent in operating on different chart types - indicator values for the same candle can differ between using a base Heiken Ashi or Renko chart vs a standard Candle or Bar chart.
I wanted the ability to easily enable/disable the second smoothing (which is now a configuration option)
I wanted the ability to configure different moving-average calculations for each smoothing iteration (e.g. EMA for the initial smoothing, and Smoothed Moving Average for the second smoothing)
3. Many of the inputs were not clearly or properly defined in the settings window - this script has far more refined user input settings, put in logical groupings, and with relevant help text.
4. Enhanced some visual styling (and added to the Settings) to make it easier for the user to enable/disable printing candle wicks, as well as customizing the bullish / bearish bar colors
5. Added alerts for bar color change to help users catch potential trend reversals
Reference paper on the original Smoothed HA formulas: www.researchgate.net
Reference on the more common implementation formulas (using double-smoothing): www.sierrachart.com
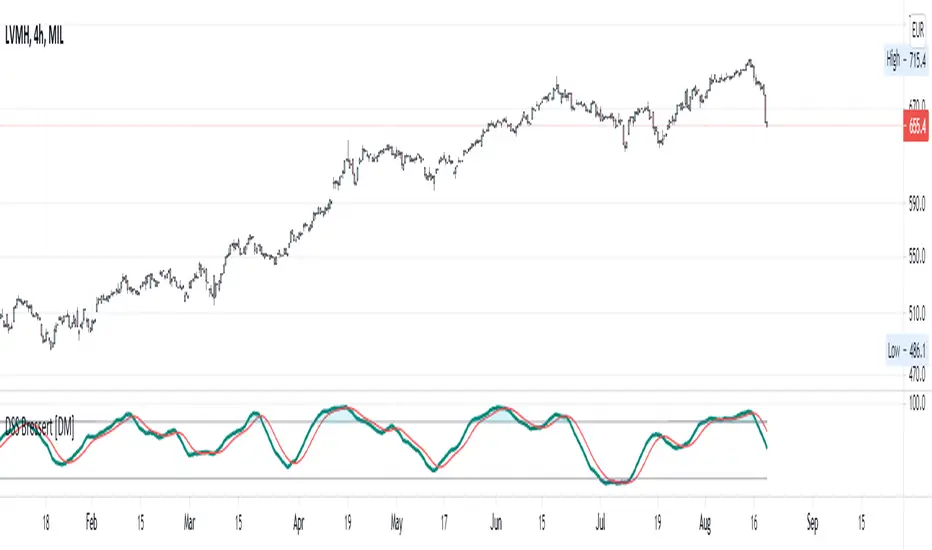
"DSS" Bessert Double Smooth Stochastic Alma Variant Hi colleagues I share this time DSS bressert.
As usual they have all the adjustable colors and signals. I hope you enjoy them and leave here below the length of signals that best suit your needs so that we can continue sharing content
Description
One after the other, William Blau and Walter Bressert each presented a version of the Double Smoothed Stochastics. Two exponentially smoothed MAs are used to even out the input values (H, L and C), in a similar way to the well-known stochastic formula.
Parameters
The adjustable period length can be chosen from 2 to 500. The most common settings will have a period length ranging from 5 to 30. In addition, the indicator can be smoothed in the interval from 1 to 50. Meaningful smoothing values lie in the short-term range.
Interpretation
The application of the DSS is comparable with that of the stochastic method. Accordingly, values above 70 or 80 must be regarded as overbought and values below 20 or 30 as oversold. A rise of the DSS above its center line should be viewed as bullish, and a fall of the DSS below its center line as bearish.
/// Quick Explained ALMA ///
//Window size: The window size is the look-back period and it is a basic setting of ALMA.
//Experienced traders can change this setting according to their preference.
//But if you are using this indicator for the first time, it is recommended to go with the default setting.
//Offset: The offset value is used to tweak the ALMA so that it will be more inclined
//towards responsiveness or smoothness. You can set the offset in decimals between the 0 to1.
//The value of 0.01 makes it smoother, while a setting of 0.99 makes the indicator more responsive.
//Sigma: The sigma is used for the filter. Any value less than 6 makes the indicator
//more focused, whereas the setting of 6 makes the filter large. According to Mr Arnaud,
//a sigma value of 6 is offer good performance.
/// Explain DSS ///
//Parameters
//The adjustable period length can be chosen from 2 to 500.
//The most common settings will have a period length ranging from 5 to 30.
//In addition, the indicator can be smoothed in the interval from 1 to 50.
//Meaningful smoothing values lie in the short-term range.
//Interpretation
//The application of the DSS is comparable with that of the stochastic method.
//Accordingly, values above 70 or 80 must be regarded as overbought and values below 20 or 30 as oversold.
//A rise of the DSS above its center line should be viewed as bullish,
//and a fall of the DSS below its center line as bearish
/// End Of The Code///
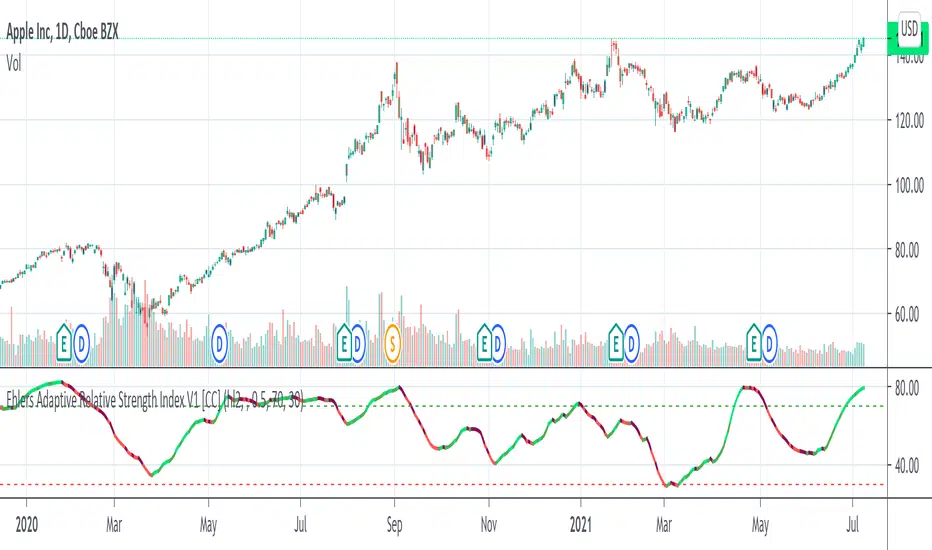
Ehlers Adaptive Relative Strength Index V1 [CC]The Adaptive Relative Strength Index was created by John Ehlers and this is his first version. I will of course publish his updated version at a later date along with publishing the final script from Jim Sloman's Ocean Theory book. I have changed his script to include extra smoothing to provide clear buy and sell signals. This is a version of a RSI that is very adaptive to changes by finding the length of the current cycle and using that to calculate the rsi and I use this same basic process to provide extra smoothing. A great strategy of course is to buy right after the indicator goes from below the oversold level to right above it and stay in until the indicator turns red or when it reaches the overbought level. I have included strong buy and sell signals in addition to normal ones and the darker colors mean strong signals and lighter colors are normal signals.
Let me know what other indicators you would like to see me publish!
Ehlers Smoothed Adaptive Momentum [CC]The Smoothed Adaptive Momentum indicator was created by John Ehlers and this indicator gives a lot of useful information. When the indicator is above 0 then there is very strong upward momentum and when the indicator falls below 0 then there is very strong downward momentum. A very profitable way to use this particular indicator is buy long when the indicator is below 0 and it crosses over it's signal line and then sell of course when you get the first sell signal. I have included strong buy and sell signals in addition to normal ones so darker colors mean strong signals and lighter colors are normal signals. Buy when the line turns green and sell when it turns red.
Let me know if you have any other scripts you would like to see me publish!

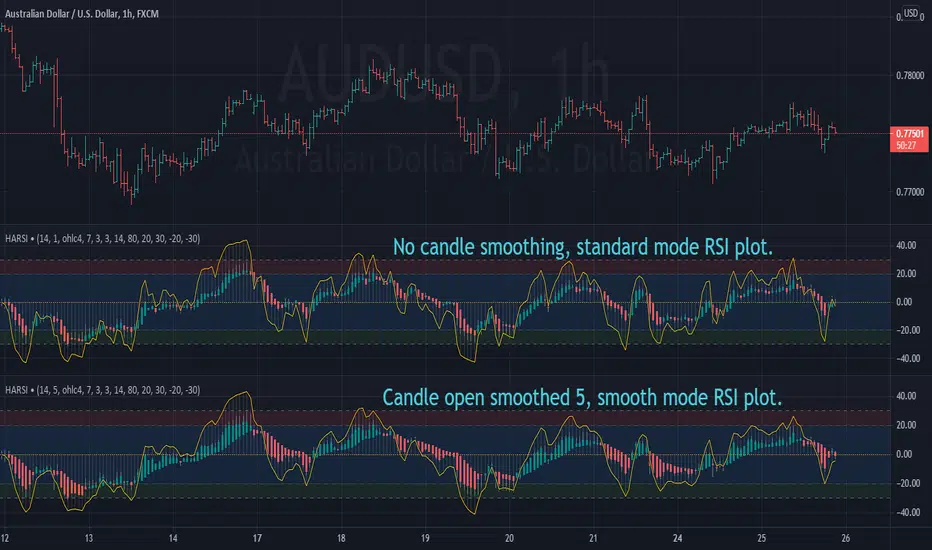
Heikin Ashi RSI OscillatorIntroducing HARSI - the RSI based Heikin Ashi candle oscillator.
...that's right, you read it correctly. This is Heikin Ashi candles in an oscillator
format derived from RSI calculations, aimed at smoothing out some of the
inherent noise seen with standard RSI indicators.
Science!
We likes it we does.
Included plot options for standard RSI plot overlay, and a smoothed variant with
it's own seperate length from the candles, oh and histogram option, for reasons.
Articles and further reading:
investopedia.com - RSI
investopedia.com - Heikin Ashi
This is a REALTIME indicator, so any values used for conditions should use
history 1, or alternatively, alerts should be called using once-per-bar-close.
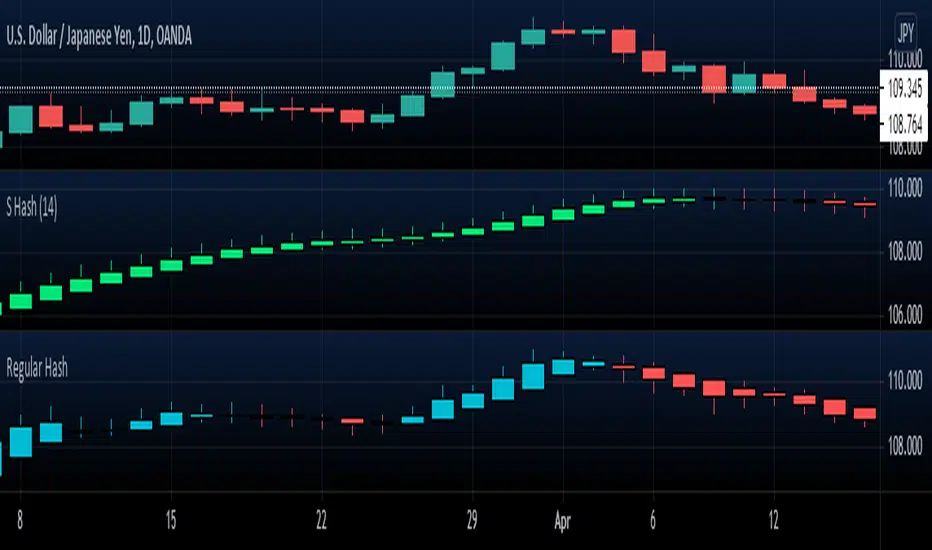
Smoothed Heiken AshiHeiken Ashi with price values smoothed via 14-EMA .
On the example chart you can compare it to a regular Hash using blue for upward trends
Bjorgum Triple EMA Strat-This script uses a triple EMA strategy to establish trend direction and reversal points
-Inputs are smoothed with Heiken Ashi values to reduce whipsaws, while providing timely execution
-Buy and sell indications are dictated by bar color
-Bar color is dictated by the candle close value in relation to the EMAs, specifically the faster of the 3
(If candle closes above or below the fast and intermediate averages, a buy or sell signal is indicated by bar color change)
-If the close falls between the two a cautionary signal is given. The viewer can hold, or take profit, or evaluate other indicators for clues
-Best results are obtained when coupled with Bjorgum TSI and Bjorgum RSI for confirmation of signals (see TradingView profile)
@Bjorgum on Stocktwits
