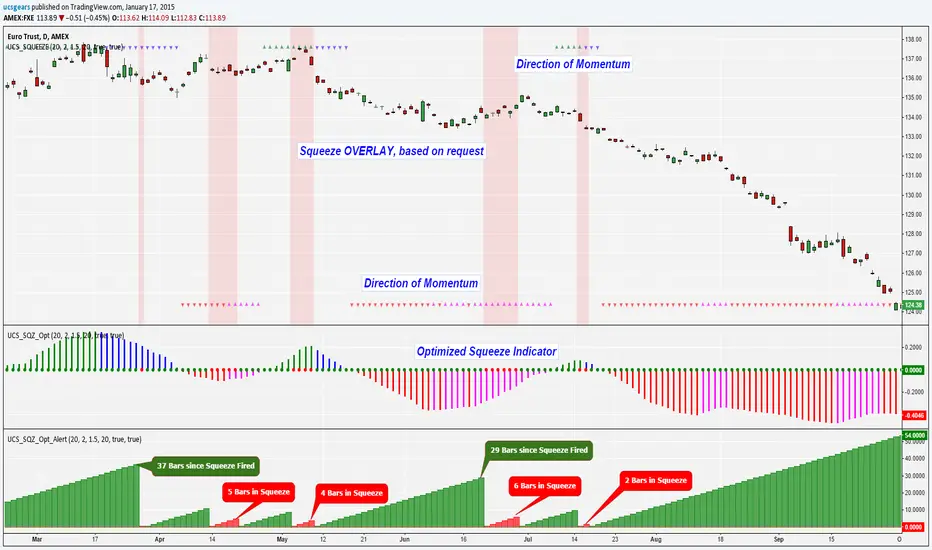
UCS_Squeeze_OptimizationSqueeze Momentum Indicator - Optimized
All Updates from Version 3 + Squeeze Optimized further.
Squeeze
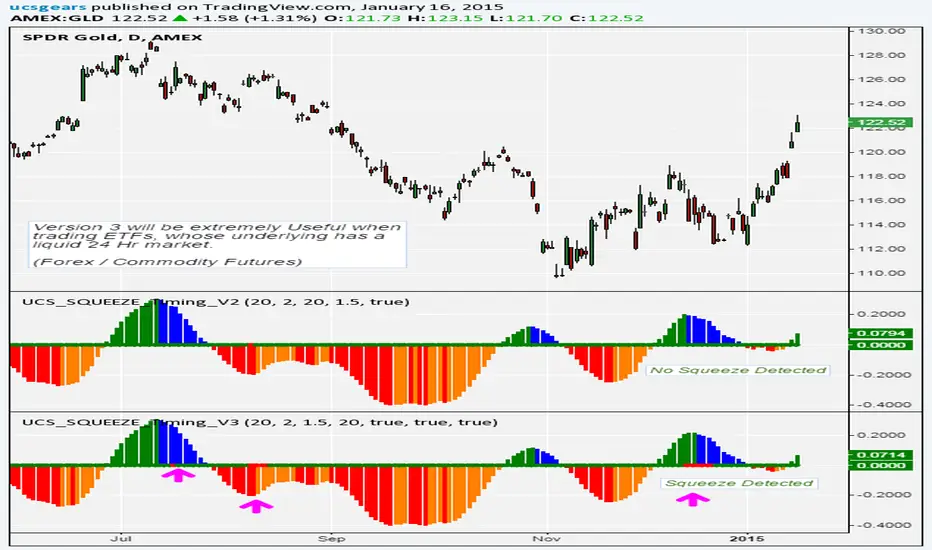
UCS_Squeeze_Timing-V3Another Version with More Features . I am confident enough this works fine now. I am Sure this will be a valuable tool for you guys who love squeezes.
///////////////// This can be further optimized, Let me know with a comment, if you still need this to be optimized. ////////////////////
This update includes
- Added Options to detect squeeze using Heikin Ashi Candle
- Added Options to use BBR or Momentum (ROC) for the Momentum Histogram
- Custom Momentum Smoothing time period
- Removed the Separate Look back periods for BB/KC - Since it doesn't really make sense using different lengths for KC and BB.
HA Closes can be really helpful in trading ETFs like FXE, GLD, FXY, SLV etc, which constantly gaps on daily basis. This helps in smoothing out. And most Importantly it Lines up with the Underlying's Squeeze.
[The Next Major Version is currently being Back tested with better timing triggers etc...... That will replace all other Squeeze indicators in the market - Some Major upgrades have been done to the squeezes to read the consolidation is with support or resistance. Also plan on adding best bet entries and pre-breakout signals. So far so good, this recent contradicting trends in daily / weekly in the market is making the indicator hard to work per theory]
The delay is because, I do not like to post any script (with signals) without sufficient back testing . I will not post these indicator with signals, unless I am sure it works per my theoretical derivations.
-
Thanks for Being Patient and all your support.
Until then - Good Luck Trading.
UCS_Squeeze_Timing-V2Statistically, Squeeze fires in the direction of strength (Up or Down). By replacing the Rate of Change with Bollinger Band % BB, allows us to easily pick the direction to trade the Squeeze. With the knowledge of Price Pattern, it makes it even easier.
I have identified 4 Setups that works wells with this. I will let you explore and comment. Could possibly initiate arguments and can identify a few more.
Nothing is perfect, but probable.
Using this with the Timing V1 Signals - It is easier to sneak in. More variations to this in future. Will need time to backtest other variations.

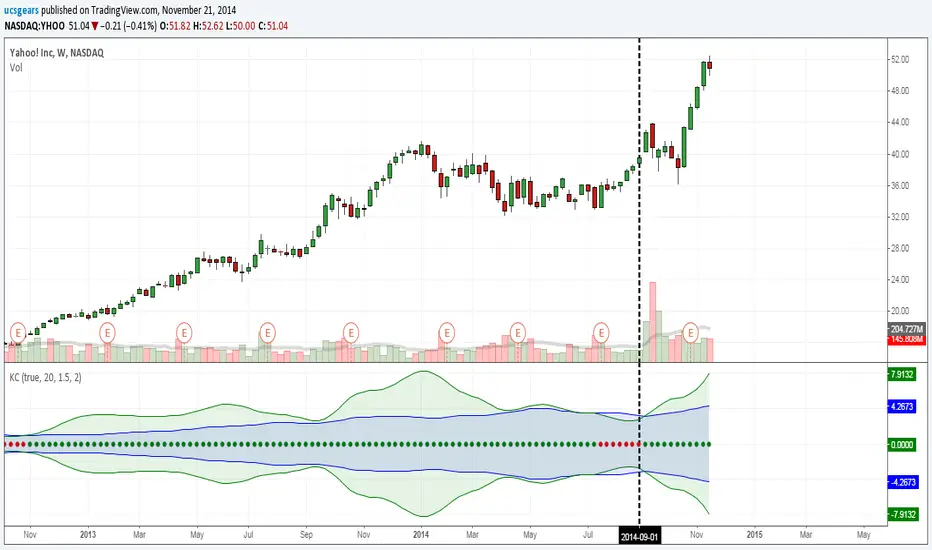
UCS_Squeeze_Timing-V1There is an important information the Squeeze indicator is missing, which is the Pre Squeeze entry. While the Bollinger band begins to curves out of the KC, The breakout usually happens. There are many instances that the Squeeze indicator will fire, after the Major move, I cant blame the indicator, thats the nature (lagging) of all indicators, and we have to live with it.
Therefore pre-squeeze-fire Entry can be critical in timing your entry. Timing it too early could result in stoploss if it turns against you, ( or serious burn on options premium), because we never know when the squeeze will fire with the TTM squeeze, But now We know. Its a little timing tool. Managing position is critical when playing options.
I will code the timing signal when I get some time.
Updated Versions -
Indicator: Custom COG channelThis is my custom channel (Bear Channel!? :)) derived from BB/STARC. It uses both ATR/STDEV for plotting the bounds.
I use COG (Center of Gravity) for deriving the baseline. This enables it to track the price action better than many other channels that make use of MAs or simply "close". Indicator also marks "squeezes" (stdev bands come inside ATR bands). Pay attention to these, as these usually indicate a move.
I am still exploring this indicator on different BTCUSD time frames, would love to hear your feedback / setups for other instruments.
Code for this indicator: pastebin.com
Code for COG fibs I mentioned in the comments: pastebin.com
