Gabriel's Relative Strength IndexGabriel’s RSI—The Reinvention of Relative Strength
Not your average RSI.
This is a fully reengineered Relative Strength Index that merges the power of advanced signal processing, adaptive smoothing, volume dynamics, and intelligent divergence detection into a single, modular toolkit designed for precision trading across all markets.
Whether you’re scalping crypto, swing trading equities, or dissecting futures contracts—Gabriel’s RSI adapts to your strategy with unrivaled control and clarity.
⚙️ 1. RSI Settings
RSI Length (Jurik): Set to 51 by default to mimic a 21-period standard RSI when Jurik smoothing is applied. Adjust lower (e.g., 22) to mimic a 9-period RSI. 32 would be almost ~14, 13.33 RSI.
RSI Source: The default is hlc3 for smoother RSI. Can be changed to any price-based series (close, open, etc.) for customization.
📡 VIX-Aware: Automatically switches to high/low/close during VIX spikes using a custom Z-score model if toggled. (I backtested it, and it catches bottoms better.) 📡
🎯 2. RSI Smoothing Options
MA Type: Smoothing applies to both RSI and its MA overlay simultaneously. I used to use the 56 EMA RSI, and it works well too.
Options: JMA, T3, Kalman, Laguerre, Super Smoother, ALMA, VWMA, LSMA, etc.
JMA: Best for adaptive recursive smoothing. A power of 2 and a phase of 50 are used.
T3: Smooth and lag-reduced, suitable for trend detection. The alpha is 0.7.
SMA + Bollinger Bands: Adds deviation-based envelopes for volatility spotting. BB StdDev: Only relevant if BBs are used. Controls bandwidth for overbought/oversold zones.
MA Length: Affects how smooth or reactive the RSI signal is.
📉 3. MACD Settings
Fast/Slow Length: Defaults (21/81) optimized for smoother MACD with SMA or T3. For Algo trading, EMA/JMA is best.
Signal Length: Shorter (e.g., 2) gives more reactive crossover signals; it can be increased.
Source: Default is close. Close works best for the settings I input. I also tuned some of the other MA types that worked for it.
MA Types: JMA and EMA reduce noise and increase signal generation. Select SMA for simplicity or T3 for trend-following.
Histogram: Bar colors signal strength and trend of MACD directly on your chart.
🔀 4. Directional Movement Index (DMI)
ADX Smoothing: High values (e.g., 100) offer strong trend confirmation with Hann Window smoothing 12, or 14 for either regular RMA or double smoothed.
DI Length: Affects DI+/- sensitivity. 100 ADX - 12/14 DI or 15 ADX - 35 DI are suggested, the latter for quicker boot time, as 100 bars is quite long.
Smoothing Type: Choose Hann Window for refined smoothing; RMA (SMMA) for simplicity. Double-smoothing is RMA -> Hann window, best of both types.
Volatility Type: ATR includes gaps for a full-range volatility; ADR is useful for gapless strategies, particularly OTC markets and intraday.
Plotted as area fills, 0 to 100 scaled.
Color-coded as Red (ADX), Orange (DI-), Blue (DI+).
📊 5. Volume Z-Score
%R Length: Normalizes volume to percentile range (73 swing, 112 exhaustion).
Z-Score Lengths: Compares short-term and long-term volume trends with Z-scores of volume.
Fast Z-Score < Slow Z-Score = Gives a Volume Squeeze.
Fast MA > Slow MA = Bullish Volume Divergence; volume has been fired. Not via Z-score, but instead via SMA, ALMA, and RMA of volume.
WPR Volume: Weighted %R used to highlight exhaustion/pivot points.
Plot volume bars after a volume squeeze has been fired; if bars aren't plotted, then it's under squeeze. Backtest on ES1! Prove it's good for catching bottoms below 15 minutes as well.
🧠 6. Divergence Engine
Pivot Settings: Pivot Period (12), Divergence minval Lookback (5), and max Lookback Bars (100) control sensitivity. Works well on any asset class; these are the optimal settings for the RSI.
Source Options: RSI, MACD, ADX, DI difference, or Volume %R.
Divergence Types: Regular (Mean Reversal), Hidden (Trend Continuation).
Heikin Ashi Mode: Enables use of HA candles on normal charts for smoother pivots. May distort values if your chart is H.A. so leave it unchecked then.
💥 7. Squeeze Momentum System (SQZMOM PRO)
Squeeze Types:
⚫ Wide (Black) — Regular Compression
🔴 Normal (Red) — Standard squeeze
🟡 Narrow (Yellow) — Golden squeeze
🟣 Very Narrow (Purple) — Extreme compression
🟢 Fired (Green) — Fired Squeeze = Breakout
Plotted on the very bottom of my indicator.
Momentum Bars:
🔷 Cyan = Rising
🔵 Blue = Pullback
🔴 Red = Falling
🟡 Yellow = Corrective
Plotted on the top of my indicator.
Reversal Signals: Dashed lines on momentum–JMA crossovers (DM-style pivot logic) ploted directly on the chart.
📈 8. Rate of Change (RoC)
RoC of Momentum: EMA-smoothed RoC on momentum for leading signals. Double smoothed, once and then another time for smoother signals.
RoC of Momentum → EMA → EMA → JMA Signal.
Signal Line: JMA used to filter noise and generate reversal signals.
Crossovers: Bullish/bearish signals based on RoC vs. signal line are plotted as triangles directly on your chart.
Optimized: Backtested for short-term setups like 1H or faster. Works on Daily timeframes as well for Futures and 24/7 Markets.
🕰️ 9. Multi-Timeframe Squeeze Settings
Each timeframe (Hourly, 4H, Daily, Weekly, Monthly) has:
Reversal Toggle: Enables dashed line DM-style pivots on crossovers.
MA Length: For Jurik MA smoothing on momentum.
BB/KC Thresholds: Define squeeze sensitivity per timeframe. A shorter BB/KC length, 17-14-12, responds better on lower timeframes.
Momentum Length: Tailors oscillator responsiveness; 20 is ideal.
🧮 10. BB Std. Deviation Scaling
Low-Pass Super Smoother : Smooths noise for BBs.
High-Pass Butterworth : Extracts cycles for BB Stdv. blend.
Root Mean Squared : Dynamic BB width adjustment based on market activity. True-range-based.
LP -> HP -> RMS -> Bollinger Band Multiplier (2.0)
Optional Intensify: Increases the squeeze rate * 4. Can be used for some option pricing strategies.
🧵 11. Moving Average Ribbon
4 optional MAs with full customization:
Choose from 13 MA types (incl. Kalman, Laguerre, T3, ALMA)
Color-coded for trend analysis (MA1–MA4 mimicking 9/21/50/200 periods)
Optional crossover alerts
🔔12. Alerts
RSI: Overbought/oversold reversals. Several types. (🦅 / 🕊️)
MACD: Histogram shift through zero line. (🐘 / 🐴)
DMI/ADX: Crossovers and strength conditions. The key level is the level where if DI/ADX is past this threshold, then it's considered to be trending. (🐬 / 🐋 / 🛡️)
Volume: Smart Money alerts on low-volume zones. May concentrate on ICT sessions. (🚨)
Squeeze: Alerts on all 5 squeeze states. (⚫, 🔴, 🟡, 🟣, 🟢)
Momentum: Momentum / JMA crosses and reversals. (🐂 / 🐻)
RoC: Bullish and bearish crosses. (📈 / 📉)
Divergences: Regular, hidden, and combined. (🐂 / 🐻 / 🐾 / 🐼)
MA Ribbon: Cross alert (⚔️)
VIX: VIX Z-Score past 2.0 (🏴☠️)
📊 13. Visual Output Summary
RSI Line + MA + Optional BB
MACD Histogram (Color Adaptive)
DMI/ADX Area Fills
%R Volume Bars (Smart Money)
Squeeze Dots (Circles)
Momentum Bars (Squares)
RoC Arrows (Cross Signals)
Pivot Break Lines (Dashed)
Auto-Divergence Lines & Labels
MA Ribbon Overlay (Optional)
✅ Best Practices ✅
Watch the slope of the RSI for pullbacks on a strong trend. Combine it with squeeze for exit timing.
Combine RSI Divergence with MACD histogram cross and Squeeze firing for precise entry.
Use Volume Z-Score to filter for institutional activity, and enter Long. Watch for reversals as well.
Watch RoC crossovers for fast, leading signals.
Enable Reversal Lines on 1H+ charts for breakout or breakdown pivots.
Use multi-timeframe thresholds for swing confirmation. The TFs I use the most are 2-5-15 minutes for futures and swinging with 1 hour daily and weekly. Those are the TFs I backtested.
An optional MA Ribbon is here as well; it supports 13 MA types.
🌎 Asset-Agnostic
MACD Automatically adjusts for Crypto, Forex, Stocks, Commodities, and Indices.
Custom ALMA, T3, Kalman, and Laguerre filters optimized per asset class and timeframe.
📚 Tech Highlights
Over 15,000 lines of modular, structured Pine Script v6 code.
Integration of Ehlers Cycle Theory and various other filters, one for each indicator.
Designed for visual clarity, multi-dimensional signal stacking, and low lag/high accuracy.
🌀 All 64 outputs are filled, so there might not be any more future updates. It's also a bit slow to load due to that.
Squeezemomentum

RSI-Adaptive T3 + Squeeze Momentum Strategy✅ Strategy Guide: RSI-Adaptive T3 + Squeeze Momentum Strategy
📌 Overview
The RSI-Adaptive T3 + Squeeze Momentum Strategy is a dynamic trend-following strategy based on an RSI-responsive T3 moving average and Squeeze Momentum detection .
It adapts in real-time to market volatility to enhance entry precision and optimize risk.
⚠️ This strategy is provided for educational and research purposes only.
Past performance does not guarantee future results.
🎯 Strategy Objectives
The main objective of this strategy is to catch the early phase of a trend and generate consistent entry signals.
Designed to be intuitive and accessible for traders from beginner to advanced levels.
✨ Key Features
RSI-Responsive T3: T3 length dynamically adjusts according to RSI values for adaptive trend detection
Squeeze Momentum: Combines Bollinger Bands and Keltner Channels to identify trend buildup phases
Visual Triggers: Entry signals are generated from T3 crossovers and momentum strength after squeeze release
📊 Trading Rules
Long Entry:
When T3 crosses upward, momentum is positive, and the squeeze has just been released.
Short Entry:
When T3 crosses downward, momentum is negative, and the squeeze has just been released.
Exit (Reversal):
When the opposite condition to the entry is triggered, the position is reversed.
💰 Risk Management Parameters
Pair & Timeframe: BTC/USD (30-minute chart)
Capital (simulated): $30,00
Order size: `$100` per trade (realistic, low-risk sizing)
Commission: 0.02%
Slippage: 2 pips
Risk per Trade: 5%
Number of Trades (backtest period): 181
📊 Performance Overview
Symbol: BTC/USD
Timeframe: 30-minute chart
Date Range: January 1, 2024 – July 3, 2025
Win Rate: 47.8%
Profit Factor: 2.01
Net Profit: 173.16 (units not specified)
Max Drawdown: 5.77% or 24.91 (0.79%)
⚙️ Indicator Parameters
Indicator Name: RSI-Adaptive T3 + Squeeze Momentum
RSI Length: 14
T3 Min Length: 5
T3 Max Length: 50
T3 Volume Factor: 0.7
BB Length: 27 (Multiplier: 2.0)
KC Length: 20 (Multiplier: 1.5, TrueRange enabled)
🖼 Visual Support
T3 slope direction, squeeze status, and momentum bars are visually plotted on the chart,
providing high clarity for quick trend analysis and execution.
🔧 Strategy Improvements & Uniqueness
Inspired by the RSI Adaptive T3 by ChartPrime and Squeeze Momentum Indicator by LazyBear ,
this strategy fuses both into a hybrid trend-reversal and momentum breakout detection system .
Compared to traditional trend-following methods, it excels at capturing early trend signals with greater sensitivity .
✅ Summary
The RSI-Adaptive T3 + Squeeze Momentum Strategy combines momentum detection with volatility-responsive risk management.
With a strong balance between visual clarity and practicality, it serves as a powerful tool for traders seeking high repeatability.
⚠️ This strategy is based on historical data and does not guarantee future profits.
Always use appropriate risk management when applying it.

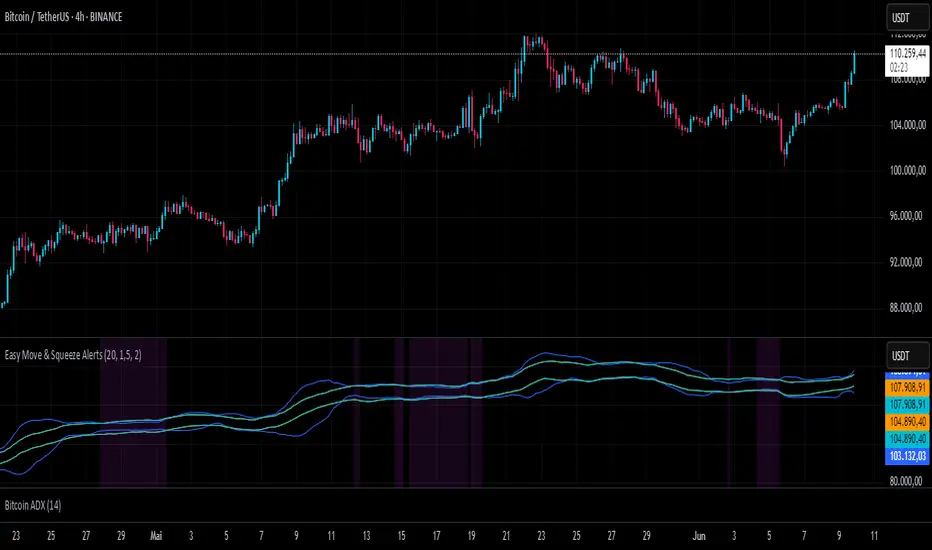
Easy Move & Squeeze Alerts1. Overview
The Easy Move & Squeeze Alerts indicator combines two proven techniques to help you anticipate major price swings and spot volatility compressions (long/short squeezes) early on. It offers:
Automated Alerts via TradingView’s alert engine
On-chart Visual Cues for immediate context
Flexible Inputs to fine-tune sensitivity, lookback length, and display options
2. TTM Squeeze (Volatility Compression)
Core Concept: Compares Bollinger Bands (standard deviation channels) with Keltner Channels (ATR-based channels).
Squeeze On: BBs lie completely inside Keltner Channels → volatility is compressed, signaling a potential buildup.
Squeeze Off: BBs break outside Keltner Channels → typically the start of a strong directional move.
Alert: When the squeeze releases, the indicator fires an alert:
💥 Squeeze Release – Volatility incoming!
Chart Label: A small, purple “🔒 Squeeze” label appears above the high of each bar while compression persists, giving you a real-time visual flag.
3. ATR Breakouts (Detecting Large Moves)
Core Concept: Builds a dynamic price channel around an EMA using ATR (Average True Range) multiplied by your chosen factor.
Cross Events:
Price crosses above the upper ATR band → potential bullish breakout.
Price crosses below the lower ATR band → potential bearish breakdown.
Alert Conditions: Separate alert triggers for “🚀 Move Up” and “📉 Move Down” fire the moment the close breaches the ATR-based bounds.
4. Visualization & Usage
Channel Plots:
Bollinger Bands in blue
Keltner Channels in orange
ATR Channels in aqua (optional)
Toggle all channel plots on or off with the showZones input.
Background Highlight: During a squeeze, the chart background lightly tints purple for quick visual confirmation.
Alerts Setup:
Simply click Create Alert in TradingView, select this indicator, and choose the event(s) you want (squeeze release, ATR breakouts).
You can route notifications via email, webhook, SMS, or platform pop-ups.
5. Deployment & Customization
Timeframes: Effective across all timeframes; most popular for day- and swing-trading.
Parameter Tuning:
Increase the len value to smooth channels and focus on only the most significant compressions/moves.
Adjust the ATR or BB multipliers to make alerts more or less sensitive.
With this indicator, you gain a clear, actionable framework for spotting both volatility squeezes and breakouts before they unfold—empowering you to enter trades ahead of the crowd. Enjoy customizing and putting it to work!
TTM Squeeze Momentum MTF [Cometreon]TTM Squeeze Momentum MTF combines the core logic of both the Squeeze Momentum by LazyBear and the TTM Squeeze by John Carter into a single, unified indicator. It offers a complete system to analyze the phase, direction, and strength of market movements.
Unlike the original versions, this indicator allows you to choose how to calculate the trend, select from 15 different types of moving averages, customize every parameter, and adapt the visual style to your trading preferences.
If you are looking for a powerful, flexible and highly configurable tool, this is the perfect choice for you.
🔷 New Features and Improvements
🟩 Unified System: Trend Detection + Visual Style
You can decide which logic to use for the trend via the "Show TTM Squeeze Trend" input:
✅ Enabled → Trend calculated using TTM Squeeze
❌ Disabled → Trend based on Squeeze Momentum
You can also customize the visual style of the indicator:
✅ Enable "Show Histogram" for a visual mode using Histogram, Area, or Column
❌ Disable it to display the classic LazyBear-style line
Everything updates automatically and dynamically based on your selection.
🟩 Full Customization
Every base parameter of the original indicator is now fully configurable: lengths, sources, moving average types, and more.
You can finally adapt the squeeze logic to your strategy — not the other way around.
🟩 Multi-MA Engine
Choose from 15 different Moving Averages for each part of the calculation:
SMA (Simple Moving Average)
EMA (Exponential Moving Average)
WMA (Weighted Moving Average)
RMA (Smoothed Moving Average)
HMA (Hull Moving Average)
JMA (Jurik Moving Average)
DEMA (Double Exponential Moving Average)
TEMA (Triple Exponential Moving Average)
LSMA (Least Squares Moving Average)
VWMA (Volume-Weighted Moving Average)
SMMA (Smoothed Moving Average)
KAMA (Kaufman’s Adaptive Moving Average)
ALMA (Arnaud Legoux Moving Average)
FRAMA (Fractal Adaptive Moving Average)
VIDYA (Variable Index Dynamic Average)
🟩 Dynamic Signal Line
Apply a moving average to the momentum for real-time cross signals, with full control over its length and type.
🟩 Multi-Timeframe & Multi-Ticker Support
You're no longer limited to the chart's current timeframe or ticker. Apply the squeeze to any symbol or timeframe without repainting.
🔷 Technical Details and Customizable Inputs
This indicator offers a fully modular structure with configurable parameters for every component:
1️⃣ Squeeze Momentum Settings – Choose the source, length, and type of moving average used to calculate the base momentum.
2️⃣ Trend Mode Selector – Toggle "Show TTM Squeeze Trend" to select the trend logic displayed on the chart:
✅ Enabled – Shows the trend based on TTM Squeeze (Bollinger Bands inside/outside Keltner Channel)
❌ Disabled – Displays the trend based on Squeeze Momentum logic
🔁 The moving average type for the Keltner Channel is handled automatically, so you don't need to select it manually, even if the custom input is disabled.
3️⃣ Signal Line – Toggle the Signal Line on the Squeeze Momentum. Select its length and MA type to generate visual cross signals.
4️⃣ Bollinger Bands – Configure the length, multiplier, source, and MA type used in the bands.
5️⃣ Keltner Channel – Adjust the length, multiplier, source, and MA type. You can also enable or disable the True Range option.
6️⃣ Advanced MA Parameters – Customize the parameters for advanced MAs (JMA, ALMA, FRAMA, VIDYA), including Phase, Power, Offset, Sigma, and Shift values.
7️⃣ Ticker & Input Source – Select the ticker and manage inputs for alternative chart types like Renko, Kagi, Line Break, and Point & Figure.
8️⃣ Style Settings – Choose how the squeeze is displayed:
Enable "Show Histogram" for Histogram, Area, or Column style
Disable it to show the classic LazyBear-style line
Use Reverse Color to invert line colors
Toggle Show Label to highlight Signal Line cross signals
Customize trend colors to suit your preferences
9️⃣ Multi-Timeframe Options - Timeframe – Use the squeeze on higher timeframes for stronger confirmation
🔟 Wait for Timeframe Closes -
✅ Enabled – Prevents multiple signals within the same candle
❌ Disabled – Displays the indicator smoothly without delay
🔧 Default Settings Reference
To replicate the default settings of the original indicators as they appear when first applied to the chart, use the following configurations:
🟩 TTM Squeeze (John Carter Style)
Squeeze
Length: 20
MA Type: SMA
Show TTM Squeeze Trend: Enabled
Bollinger Bands
Length: 20
Multiplier: 2.0
MA Type: SMA
Keltner Channel
Length: 20
Multiplier: 1.0
Use True Range: ON
MA Type: EMA
Style
Show Histogram: Enabled
Reverse Color: Enabled
🟩 Squeeze Momentum (LazyBear Style)
Squeeze
Length: 10
MA Type: SMA
Show TTM Squeeze Trend: Disabled
Bollinger Bands
Length: 20
Multiplier: 1.5
MA Type: SMA
Keltner Channel
Length: 10
Multiplier: 1.5
Use True Range: ON
MA Type: SMA
Style
Show Histogram: Disabled
Reverse Color: Disabled
⚠️ These values are intended as a starting point. The Cometreon indicator lets you fully customize every input to fit your trading style.
🔷 How to Use Squeeze Momentum Pro
🔍 Identifying Trends
Squeeze Momentum Pro supports two different methods for identifying the trend visually, each based on a distinct logic:
Squeeze Momentum Trend (LazyBear-style):
Displays 3 states based on the position of the Bollinger Bands relative to the Keltner Channel:
🔵 Blue = No Squeeze (BB outside KC and KC outside BB)
⚪️ White = Squeeze Active (BB fully inside KC)
⚫️ Gray = Neutral state (none of the above)
TTM Squeeze Trend (John Carter-style):
Calculates the difference in width between the Bollinger Bands and the Keltner Channel:
🟩 Green = BB width is greater than KC → potential expansion phase
🟥 Red = BB are tighter than KC → possible compression or pre-breakout
📈 Interpreting Signals
Depending on the active configuration, the indicator can provide various signals, including:
Trend color → Reflects the current compression/expansion state (based on selected mode)
Momentum value (above or below 0) → May indicate directional pressure
Signal Line cross → Can highlight momentum shifts
Color change in the momentum → May suggest a potential trend reversal
🛠 Integration with Other Tools
Squeeze Momentum Pro works well alongside other indicators to strengthen market context:
✅ Volume Profile / OBV – Helps confirm accumulation or distribution during squeezes
✅ RSI – Useful to detect divergence between momentum and price
✅ Moving Averages – Ideal for defining primary trend direction and filtering signals
☄️ If you find this indicator useful, leave a Boost to support its development!
Every piece of feedback helps improve the tool and deliver an even better trading experience.
🔥 Share your ideas or feature requests in the comments!

Borrow Fee & Squeeze TrackerSqueeze tracker.
This script helps identify potential short squeeze setups by detecting two key indicators: unusual volume and significant price changes.
The script combines both volume and price changes to give a more reliable indication of potential squeeze opportunities. When both criteria are met, it signals that there may be unusual market activity. The script also allows you to set up automatic alerts when both the volume and price change exceed thresholds, so you can react quickly to potential opportunities without constantly monitoring the charts.
Once added, you can set an alert:
Click on the Alert button
In the "Condition" dropdown, select the Squeeze Alert that was created.
Set the alert options
Now, when the script detects both a volume spike and a price change spike, it will trigger an alert based on your settings.
Enjoy!

Squeeze Momentum Indicator Strategy [LazyBear + PineIndicators]The Squeeze Momentum Indicator Strategy (SQZMOM_LB Strategy) is an automated trading strategy based on the Squeeze Momentum Indicator developed by LazyBear, which itself is a modification of John Carter's "TTM Squeeze" concept from his book Mastering the Trade (Chapter 11). This strategy is designed to identify low-volatility phases in the market, which often precede explosive price movements, and to enter trades in the direction of the prevailing momentum.
Concept & Indicator Breakdown
The strategy employs a combination of Bollinger Bands (BB) and Keltner Channels (KC) to detect market squeezes:
Squeeze Condition:
When Bollinger Bands are inside the Keltner Channels (Black Crosses), volatility is low, signaling a potential upcoming price breakout.
When Bollinger Bands move outside Keltner Channels (Gray Crosses), the squeeze is released, indicating an expansion in volatility.
Momentum Calculation:
A linear regression-based momentum value is used instead of traditional momentum indicators.
The momentum histogram is color-coded to show strength and direction:
Lime/Green: Increasing bullish momentum
Red/Maroon: Increasing bearish momentum
Signal Colors:
Black: Market is in a squeeze (low volatility).
Gray: Squeeze is released, and volatility is expanding.
Blue: No squeeze condition is present.
Strategy Logic
The script uses historical volatility conditions and momentum trends to generate buy/sell signals and manage positions.
1. Entry Conditions
Long Position (Buy)
The squeeze just released (Gray Cross after Black Cross).
The momentum value is increasing and positive.
The momentum is at a local low compared to the past 100 bars.
The price is above the 100-period EMA.
The closing price is higher than the previous close.
Short Position (Sell)
The squeeze just released (Gray Cross after Black Cross).
The momentum value is decreasing and negative.
The momentum is at a local high compared to the past 100 bars.
The price is below the 100-period EMA.
The closing price is lower than the previous close.
2. Exit Conditions
Long Exit:
The momentum value starts decreasing (momentum lower than previous bar).
Short Exit:
The momentum value starts increasing (momentum higher than previous bar).
Position Sizing
Position size is dynamically adjusted based on 8% of strategy equity, divided by the current closing price, ensuring risk-adjusted trade sizes.
How to Use This Strategy
Apply on Suitable Markets:
Best for stocks, indices, and forex pairs with momentum-driven price action.
Works on multiple timeframes but is most effective on higher timeframes (1H, 4H, Daily).
Confirm Entries with Additional Indicators:
The author recommends ADX or WaveTrend to refine entries and avoid false signals.
Risk Management:
Since the strategy dynamically sizes positions, it's advised to use stop-losses or risk-based exits to avoid excessive drawdowns.
Final Thoughts
The Squeeze Momentum Indicator Strategy provides a systematic approach to trading volatility expansions, leveraging the classic TTM Squeeze principles with a unique linear regression-based momentum calculation. Originally inspired by John Carter’s method, LazyBear's version and this strategy offer a refined, adaptable tool for traders looking to capitalize on market momentum shifts.

Squeeze Momentum Oscillator [AlgoAlpha]🎉📈 Introducing the Squeeze Momentum Oscillator by AlgoAlpha 📉🎊
Unlock the secrets of market dynamics with our innovative Squeeze Momentum Oscillator! Crafted for those who seek to stay ahead in the fast-paced trading environment, this tool amalgamates critical market momentum and volatility indicators to offer a multifaceted view of potential market movements. Here's why it's an indispensable part of your trading toolkit:
Key Features:
🌈 Customizable Color Schemes: Easily distinguish between bullish (green) and bearish (red) momentum phases for intuitive analysis.
🔧 Extensive Input Settings: Tailor the oscillator lengths for both Underlying and Swing Momentum to match your unique trading approach.
📊 Dedicated Squeeze Settings: Leverage precise volatility insights to identify market squeeze scenarios, signaling potential breakouts or consolidations.
🔍 Advanced Divergence Detection: Utilize sophisticated algorithms to detect and visualize both bullish and bearish divergences, pointing towards possible market reversals.
📈 Hyper Squeeze Detection: Stay alert to high-momentum market movements with our hyper squeeze feature, designed to extremely suppressed market volatility.
🔔 Comprehensive Alert System: Never miss a trading opportunity with alerts for momentum changes, squeeze conditions, and more.
Quick Guide to Using the Squeeze Momentum Oscillator:
🛠 Add the Indicator: Add the indicator to your favourites. Adjust the oscillator and squeeze settings to suit your trading preferences.
📊 Market Analysis: Keep an eye on the squeeze value and momentum z-score for insights into volatility and market direction. Hyper Squeeze signals are your cue for high momentum trading opportunities.
🔔 Alerts: Configure alerts for shifts in underlying and swing momentum, as well as entry and exit points for squeeze conditions, to capture market moves efficiently.
How It Works:
The Squeeze Momentum Oscillator by AlgoAlpha synergistically combines the principles of momentum tracking and market squeeze detection. By integrating the core logic of the Squeeze & Release indicator, it calculates the Squeeze Value (SV) through a comparison of the Exponential Moving Average (EMA) of the Average True Range (ATR) against the high-low price EMA. This SV is further analyzed alongside its EMA to pinpoint squeeze conditions, indicative of potential market breakouts or consolidations. In addition to this, the oscillator employs Hyper Squeeze Detection for identifying extremely low volatility. The momentum aspect of the oscillator evaluates the price movement relative to EMAs of significant highs and lows, refining these observations with a z-score normalization for short-term momentum insights. Moreover, the incorporation of divergence detection aids in identifying potential reversals, making this oscillator a comprehensive tool for traders looking to harness the power of volatility and momentum in their market analysis. The combination of the Squeeze & Release and the Momentum Oscillator allows traders to time their trades with more precision by entering when the market is in a squeeze and front running the volatility of a major move.
Elevate your trading strategy with the Squeeze Momentum Oscillator by AlgoAlpha and gain a competitive edge in deciphering market dynamics! 🌟💼 Happy trading!

Squeeze Momentum DeluxeThe Squeeze Momentum Deluxe is a comprehensive trading toolkit built with features of momentum, volatility, and price action. This script offers a suite for both mean reversion and trend-following analysis. Developed based on the original TTM Squeeze implementation by @LazyBear, this indicator introduces several innovative components to enhance your trading insights.
🔲 Components and Features
Momentum Oscillator - as rooted in the TTM Squeeze, quantifies the relationship between price and its extremes over a defined period. By normalizing the calculation, the values become comparable throughout time and across securities, allowing for a nuanced assessment of Bullish and Bearish momentum. Furthermore, by presenting it as a ribbon with a signal line we gain additional information about the direction of price swings.
Squeeze Bars - The original squeeze concept is based on the relationship between the Bollinger Bands and Keltner Channel , once the BB resides inside the KC a squeeze occurs. By understanding their fundamentals a new form of calculation can be inferred.
method bb(float src, simple int len, simple float mult) => method kc(float src, simple int len, simple float mult) =>
float basis = ta.sma (src, len) float basis = ta.sma (src, len)
float dev = ta.stdev(src, len) float rng = ta.atr ( len)
float upper = basis + dev * mult float upper = basis + rng * mult
float lower = basis - dev * mult float lower = basis - rng * mult
Both BB and KC are constructed upon a moving average with the addition of Standard Deviation and Average True Range respectively. Therefore, the calculation can be transformed to when the Stdev is lower than the ATR a squeeze occurs.
method sqz(float src, simple int len) =>
float dev = ta.stdev(src, len)
float atr = ta.atr ( len)
dev < atr ? true : false
This indicator uses three different thresholds for the ATR to gain three levels of price "Squeeze" for further analysis.
Directional Flux- This component measures the overall direction of price volatility, offering insights into trend sentiment. Presented as waves in the background, it includes an OverFlux feature to signal extreme market bias in a particular direction which can signal either exhaustion or vital continuation. Additionally, the user can choose if to base the calculation on Heikin-Ashi Candles to bias the tool toward trend assessment.
Confluence Gauges - Placed at the top and bottom of the indicator, these gauges measure confluence in the relationship between the Momentum Oscillator and Directional Flux. They provide traders with an easily interpretable visual aid for detecting market sentiment. Reversal doritos displayed alongside them contribute to mean reversion analysis.
Divergences (Real-Time) - Equipped with a custom algorithm, the indicator detects real-time divergences between price and the oscillator. This dynamic feature enhances your ability to spot potential trend reversals as they occur.
🔲 Settings
Directional Flux Length - Adjusts the period of which the background volatility waves operate on.
Trend Bias - Bases the calculation of the Flux to HA candles to bias its behavior toward the trend of price action.
Squeeze Momentum Length - Calibrates the length of the main oscillator ribbon as well as the period for the squeeze algorithm.
Signal - Controls the width of the ribbon. Lower values result in faster responsiveness at the cost of premature positives.
Divergence Sensitivity - Adjusts a threshold to limit the amount of divergences detected based on strength. Higher values result in less detections, stronger structure.
🔲 Alerts
Sell Signal
Buy Signal
Bullish Momentum
Bearish Momentum
Bullish Flux
Bearish Flux
Bullish Swing
Bearish Swing
Strong Bull Gauge
Strong Bear Gauge
Weak Bull Gauge
Weak Bear Gauge
High Squeeze
Normal Squeeze
Low Squeeze
Bullish Divergence
Bearish Divergence
As well as the option to trigger 'any alert' call.
The Squeeze Momentum Deluxe is a comprehensive tool that goes beyond traditional momentum indicators, offering a rich set of features to elevate your trading strategy. I recommend using toolkit alongside other indicators to have a wide variety of confluence to therefore gain higher probabilistic and better informed decisions.

Squeeze Momentum TD - A Revisited Version of the TTM SqueezeDescription:
The "Squeeze Momentum TD" is our unique take on the highly acclaimed TTM Squeeze indicator, renowned in the trading community for its efficiency in pinpointing market momentum. This script is a tribute and an extension to the foundational work laid by several pivotal figures in the trading industry:
• John Carter, for his creation of the TTM Squeeze and TTM Squeeze Pro, which revolutionized the way traders interpret volatility and momentum.
• Lazybear, whose original interpretation of the TTM Squeeze, known as the "Squeeze Momentum Indicator", provided an invaluable foundation for further development.
• Makit0, who evolved Lazybear's script to incorporate enhancements from the TTM Squeeze Pro, resulting in the "Squeeze PRO Arrows".
Our script, "Squeeze Momentum TD", represents a custom version developed after reviewing all variations of the TTM Squeeze indicator. This iteration focuses on a distinct visualization approach, featuring an overlay band on the chart for an user-friendly experience. We've distilled the essence of the TTM Squeeze and its advanced version, the TTM Squeeze Pro, into a form that emphasizes intuitive usability while retaining comprehensive analytical depth.
Features:
-Customizable Bollinger Bands and Keltner Channels: These core components of the TTM Squeeze.
-Dynamic Squeeze Conditions: Ranging from No Squeeze to High Compression.
-Momentum Oscillator: A linear regression-based momentum calculation, offering clear insights into market trends.
-User-Defined Color Schemes: Personalize your experience with adjustable colors for bands and plot shapes.
-Advanced Alert System: Alerts for key market shifts like Bull Watch Out, Bear Watch Out, and Momentum shifts.
-Adaptive Band Widths: Modify the band widths to suit your preference.
How to use it?
• Transition from Light Green to Dark Green: Indicates a potential end to the bullish momentum. This 'Bull Watch Out' signal suggests that traders should be cautious about continuing bullish trends.
• Transition from Light Red to Dark Red: Signals that the bearish momentum might be fading, triggering a 'Bear Watch Out' alert. It's a hint for traders to be wary of ongoing bearish trends.
• Shift from Dark Green to Light Green: This change suggests an increase in bullish momentum. It's an indicator for traders to consider bullish positions.
• Change from Dark Red to Light Red: Implies that bearish momentum is picking up. Traders might want to explore bearish strategies under this condition.
• Rapid Change from Light Red to Light Green: This swift shift indicates a quick transition from bearish to bullish sentiment. It's a strong signal for traders to consider switching to bullish positions.
• Quick Shift from Light Green to Light Red: Demonstrates a speedy change from bullish to bearish momentum. It suggests that traders might want to adjust their strategies to align with the emerging bearish trend.
Acknowledgements:
Special thanks to Beardy_Fred for the significant contributions to the development of this script. This work stands as a testament to the collaborative spirit of the trading community, continuously evolving to meet the demands of diverse trading strategies.
Disclaimer:
This script is provided for educational and informational purposes only. Users should conduct their own due diligence before making any trading decisions.

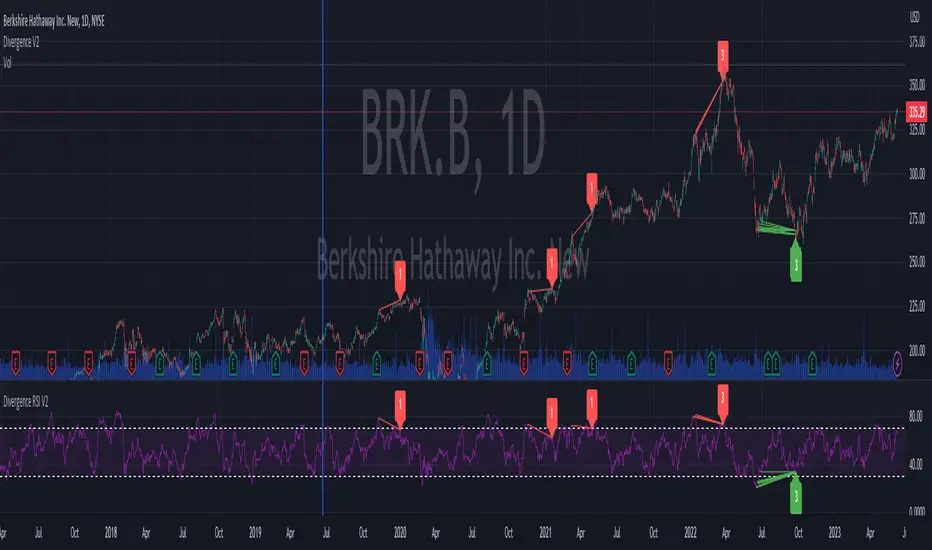
Divergence RSI V2This indicator is based on the concept of divergence. I recommend that you find out and study about this yourself as the concept of divergence will not be explained in depth in this description.
This indicator will show divergences between the asset price and the RSI oscillator. The indicator will look for divergent points between the rising highs and falling lows of the asset; and the rising lows and falling highs of the RSI.
The trend of the asset tends to follow the behavior of the oscillator when a divergence occurs. So if we find a divergence between the two, the price of the asset is likely to follow the trend of the oscillator.
This indicator looks for these types of divergences and will show (based on the RSI) if there is a bullish or bearish divergence.
If it is bullish, it will show a line joining those points in green and if it is bearish in red. In addition, it will show a label where you can see the number of occurrences that have been found from a certain point to another.
Note: this indicator can be complemented with the “Divergence V2” indicator which is also found in my library.
Settings
Backtesting Bars : is the number of bars back that the indicator will check. No more than 1000 is recommended as this will slow down the search.
Tolerance: number of times a divergent line can cross a bar. If you place 0, no bar can be crossed by a diverging line.
Min Bars To detect: will only search for divergences (or lines) that have the minimum number of bars selected in this option. Default option is 30.
Min Bars To detect: it will only search for divergences (or lines) that have the maximum number of bars selected in this option. Default option is 100.
Source Highs: The high points will be based on the close of each bar. You can use as another alternative.
Source Lows: The low points will be based on the close of each bar. You can use as another alternative.
Use squeeze parameter: only look for divergences (bullish or bearish) at times when such an indicator is in favor of the trend or coincides with the corresponding RSI divergence.
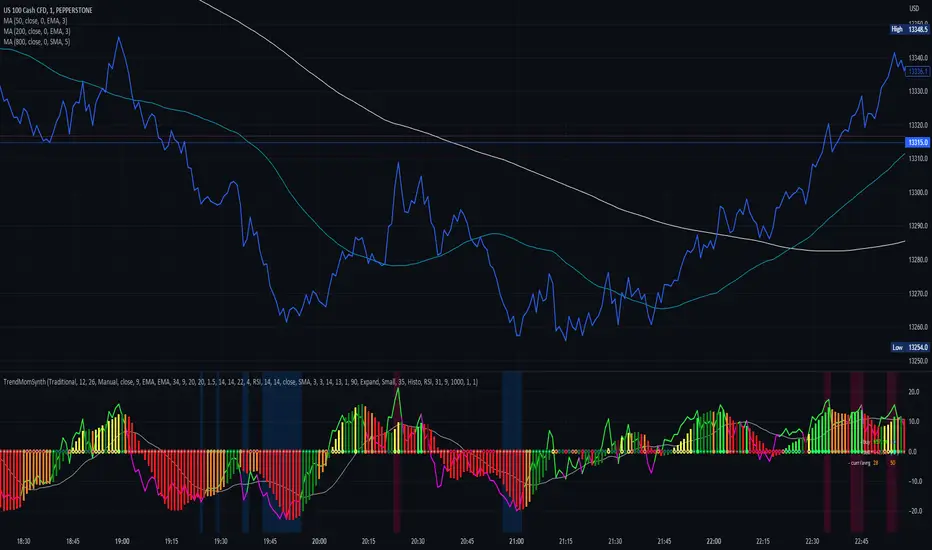
Trend Momentum SynthesizerBy analyzing the MACD (Moving Average Convergence Divergence) and Squeeze Momentum indicators, this indicator helps identify potential bullish, bearish, or undecided market conditions.
The algorithm within considers the positions of the MACD and Squeeze Momentum indicators to determine the overall market sentiment. When the indicators align and indicate a bullish market condition, the indicator's plot color will be either dark green, green, yellow, or lime, indicating a potential bullish trend. Conversely, if the indicators align and indicate a bearish market condition, the plot color will be maroon or red, denoting a potential bearish trend. When the indicators are inconclusive, the plot color will be orange, suggesting an undecided market.
The ADX is an addon component of this indicator, helping to assess the strength of a trend. By analyzing the ADX, the indicator determines whether a trend is strong enough, providing additional confirmation for potential trade signals. The ADX smoothing and DI (Directional Index) length parameters can be customized to suit individual trading preferences.
By combining these indicators, the algorithm provides traders with a comprehensive view of the market, helping them make informed trading decisions. It aims to assist traders in identifying potential market opportunities and aligns with the objective of maximizing trading performance.
How to use the indicator:
Note: I used back-testing for fine tuning do not base your trades on signals from the testing framework.
Strategy Myth-Busting #11 - TrendMagic+SqzMom+CDV - [MYN]This is part of a new series we are calling "Strategy Myth-Busting" where we take open public manual trading strategies and automate them. The goal is to not only validate the authenticity of the claims but to provide an automated version for traders who wish to trade autonomously.
Our 11th one is an automated version of the "Magic Trading Strategy : Most Profitable Indicator : 1 Minute Scalping Strategy Crypto" strategy from "Fx MENTOR US" who doesn't make any official claims but given the indicators he was using, it looked like on the surface that this might actually work. The strategy author uses this on the 1 minute and 3 minute timeframes on mostly FOREX and Heiken Ashi candles but as the title of his strategy indicates is designed for Crypto. So who knows..
To backtest this accurately and get a better picture we resolved the Heiken Ashi bars to standard candlesticks . Even so, I was unable to sustain any consistency in my results on either the 1 or 3 min time frames and both FOREX and Crypto. 10000% Busted.
This strategy uses a combination of 3 open-source public indicators:
Trend Magic by KivancOzbilgic
Squeeze Momentum by LazyBear
Cumulative Delta Volume by LonesomeTheBlue
Trend Magic consists of two main indicators to validate momentum and volatility. It uses an ATR like a trailing Stop to determine the overarching momentum and CCI as a means to validate volatility. Together these are used as the primary indicator in this strategy. When the CCI is above 0 this is confirmation of a volatility event is occurring with affirmation based upon current momentum (ATR).
The CCI volatility indicator gets confirmation by the the Cumulative Delta Volume indicator which calculates the difference between buying and selling pressure. Volume Delta is calculated by taking the difference of the volume that traded at the offer price and the volume that traded at the bid price. The more volume that is traded at the bid price, the more likely there is momentum in the market.
And lastly the Squeeze Momentum indicator which uses a combination of Bollinger Bands, Keltner Channels and Momentum are used to again confirm momentum and volatility. During periods of low volatility, Bollinger bands narrow and trade inside Keltner channels. They can only contract so much before it can’t contain the energy it’s been building. When the Bollinger bands come back out, it explodes higher. When we see the histogram bar exploding into green above 0 that is a clear confirmation of increased momentum and volatile. The opposite (red) below 0 is true when there are low periods. This indicator is used as a means to really determine when there is premium selling plays going on leading to big directional movements again confirming the positive or negative momentum and volatility direction.
If you know of or have a strategy you want to see myth-busted or just have an idea for one, please feel free to message me.
Trading Rules
1 - 3 min candles
FOREX or Crypto
Stop loss at swing high/low | 1.5 risk/ratio
Long Condition
Trend Magic line is Blue ( CCI is above 0) and above the current close on the bar
Squeeze Momentum's histogram bar is green/lime
Cumulative Delta Volume line is green
Short Condition
Trend Magic line is Red ( CCI is below 0) and below the current close on the bar
Squeeze Momentum's histogram bar is red/maroon
Cumulative Delta Volume line is peach

1st Gray Cross Signals ━ Histogram SQZMOM [whvntr][LazyBear]This is the Histogram Version of one of my other indicators named: SQZ Momentum + 1st Gray Cross Signals (with arrows) Which is a modification of "Squeeze Momentum Indicator" by user: "LazyBear". In that indicator of his he described, and suggested, the use of his gray cross signals to find points of interest for trading based on the direction of momentum when the first gray cross appears... I have programmed these points, and highlighted them, for ease of use. The 1st gray cross strategy, he said , is from John F. Carter's book, Chapter 11, "Mastering the Trade".
Here we have the Histogram version, with background highlights only, and nothing on the chart, in true SQZ Momentum style.
Disclaimer: using this indicator, or any indicator anywhere, involves risk when trading and isn't a guarantee of 100% accurate results.

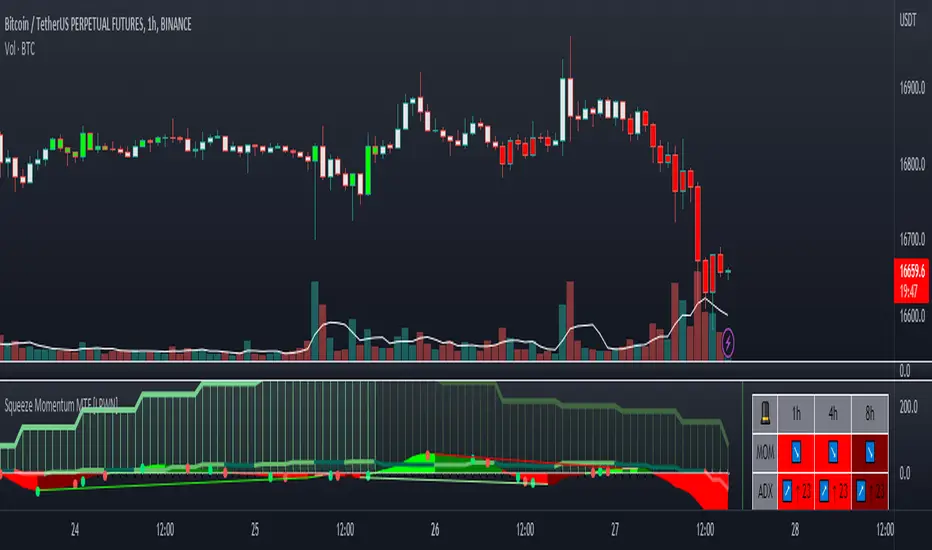
Squeeze Momentum MTF [LPWN]//ENGLISH
Squeeze momentum of lazy bear, multiple time frames, It gives you information if the cycles with high temporality momentums are in harmony, by default two more momentums are shown, I prefer to use only one extra, in the options you can change the time frame of the momentums, in addition to the momentums you can add the RSI and ADX, if the momentum look small, you can change the value of general scale to make them bigger, the table gives us information on how the momentums and the adx are, in the options you can set the candles to color according to the harmony of the momentums
// SPANISH
Squeeze momentum de lazy bear, multiple time frames, te da informacion si los ciclos con momentums de temporalidad alta estan en armonia,por defecto se muestran dos momentums mas, yo prefiero usar solo uno extra, en las opcoines puedes cambiar la temporalidad de los momentums, ademas de los momentums puedes agregar el RSI y el ADX, si el momentum se ve pequeño, puedes cambiar el valor de general scale para hacerlos mas grandes, la tabla nos da infomracion de como estan los momentums y el adx, en las opciones puedes poner que las velas se pongan del color de acuerdo a la armonia de los momentums
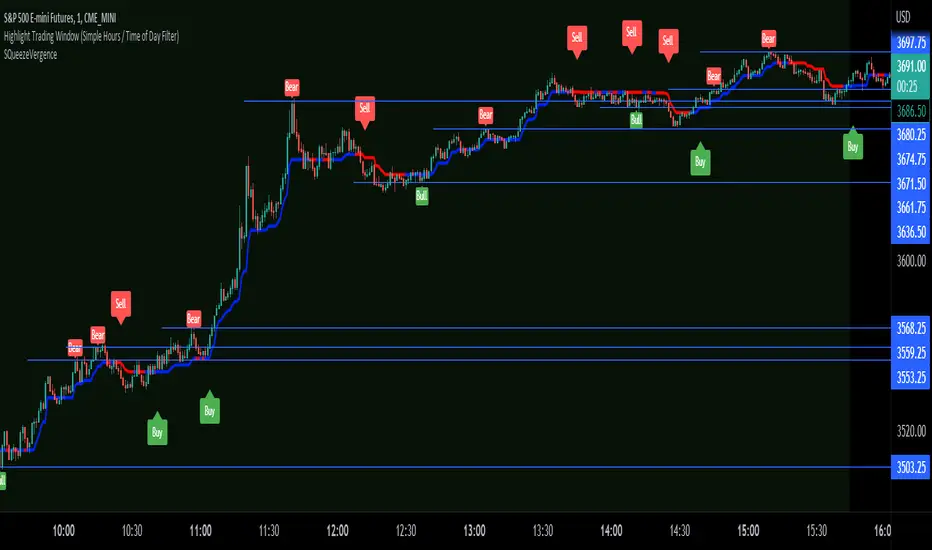
SQueezeVergenceThis is my SQueezeVergence indicator. It fires Buy and Sell signals based on squeeze momentum and trend. **It also creates Bull and Bear signals based on MACD divergence which should only be used as areas of support and resistance being as these signals repaint based on a 5 candle look back of pivots.** All settings are editable for better use. The default settings are what I use on the 1 Minute chart of ES to scalp. This is a simple indicator to help me get alerts on when I need to scalp. The divergence signals work well for areas of significance. I like to watch for breaks of these levels along with support and resistance. I hope this helps.
Strategy Myth-Busting #6 - PSAR+MA+SQZMOM+HVI - [MYN]This is part of a new series we are calling "Strategy Myth-Busting" where we take open public manual trading strategies and automate them. The goal is to not only validate the authenticity of the claims but to provide an automated version for traders who wish to trade autonomously.
Our sixth one we are automating is " I Tested ''7% Profit Per Day" Scalping Strategy 100 Times ( Unexpected Results ) " from " TradeIQ " which claims to have made 175% profit on the 5 min chart of BTCUSD with a having a 61% win rate in just 32 days.
Originally, we mimicked verbatim the indicators and settings TradeIQ was using however weren't getting promising results anything close to the claim so we decided to try and improve on it. We changed the static Parabolic SAR to be adaptive based upon the timeframe. We did this by using an adjustable multiplier for the PSAR Max. Also, In TradeIQ's revised version he substituted Hawkeye's Volume Indicator in lieu of Squeeze Momentum. We found that including both indicators we were getting better results so included them both. Feel free to experiment more. Would love to see how this could be improved on.
This strategy uses a combination of 4 open-source public indicators:
Parabolic Sar (built in)
10 in 1 MA's by hiimannshu
Squeeze Momentum by lazybear
HawkEYE Volume Indicator by lazybear
Trading Rules
5m timeframe and above. We saw equally good results in the higher (3h - 4h) timeframes as well.
Long Entry:
Parabolic Sar shifts below price at last dot above and then previous bar needs to breach above that.
Price action has to be below both MA's and 50MA needs to be above 200MA
Squeeze Momentum needsd to be in green or close to going green
HawkEYE Volume Indicator needs to be show a green bar on the histagram
Short Entry:
Parabolic Sar shifts above price at last dot below and then previous bar needs to breach below that.
Price action needs to be above both MA's and 50MA needs to be below 200MA
Squeeze Momentum needsd to be in red or close to going red
HawkEYE Volume Indicator needs to be show a red bar on the histagram
If you know of or have a strategy you want to see myth-busted or just have an idea for one, please feel free to message me.

Squeeze Momentum Indicator [LazyBear] added Alerting + webhookA modified version of Squeeze Momentum Indicator visualizing on Price Chart.
author: @LazyBear, modified by @KivancOzbilgic, and by @dgtrd
I took in all of the information as the script below is based on the V2 Script that @LazyBear posted and then added Alerting based on the math and the conditions that @dgtrd added.
Per the description here:
The Squeeze Indicator measures the relationship between Bollinger Bands and Keltner's Channels to help identify consolidations and signal when prices are likely to break out (whether up or down).
The Squeeze Indicator finds sections of the Bollinger Bands which fall inside the Keltner's Channels, and in this case, the market is said to be in a squeeze (indicator turns off, displayed with grey diamond shapes in this study).
When the volatility increases, so does the distance between the bands. Conversely, when the volatility declines, the distance also decreases, and in such cases, the squeeze is said to be released (indicator turns on, displayed with triangle up or triangle down shapes)
Taking the above information and what was in the script was able to base the alert conditions:
So when the condition:
Squeeze On or No Squeeze = In Squeeze
Squeeze Off = Squeeze Release Long or Squeeze Release Long based off conditions.
There are 2 separate alert Types.
1. App, Pop-up, eMail, play sound and Send email to SMS
2. It Is dedicated to Webhook for your various applications.
Alerting Options
i.imgur.com
App Notification
i.imgur.com
i.imgur.com
Webhook test into Discord
i.imgur.com
Squeeze Momentum Strategy [LazyBear] Buy Sell TP SL Alerts-Modified version of Squeeze Momentum Indicator by @LazyBear.
-Converted to version 5,
-Taken inspiration from @KivancOzbilgic for its buy sell calculations,
-Used @Bunghole strategy template with Take Profit, Stop Loss and Enable/Disable Toggles
-Added Custom Date Backtesting Module
------------------------------------------------------------------------------------------------------------------------
All credit goes to above
Problem with original version:
The original Squeeze Momentum Strategy did not have buy sell signals and there was alot of confusion as to when to enter and exit.
There was no proper strategy that would allow backtesting on which further analysis could be carried out.
There are 3 aspects this strategy:
1 ) Strategy Logic (easily toggleable from the dropdown menu from strategy settings)
- LazyBear (I have made this simple by using Kivanc technique of Momentums Moving Average Crossover, BUY when MA cross above signal line, SELL when crossdown signal line)
- Zero Crossover Line (BUY signal when crossover zero line, and SELL crossdown zero line)
2) Long Short TP and SL
- In strategies there is usually only 1 SL and 1 TP, and it is assumed that if a 2% SL giving a good profit %, then it would be best for both long and short. However this is not the case for many. Many markets/pairs, go down with much more speed then they go up with. Hence once we have a profitable backtesting setting, then we should start optimizing Long and Short SL's seperately. Once that is done, we should start optimizing for Long and Short TP's separately, starting with Longs first in both cases.
3) Enable and Disable Toggles of Long and Short Trades
- Many markets dont allow short trades, or are not suitable for short trades. In this case it would be much more feasible to disable "Short" Trading and see results of Long Only as a built in graphic view of backtestor provides a more easy to understand data feed as compared to the performance summary in which you have to review long and short profitability separately.
4) Custom Data Backtesting
- One of most crucial aspects while optimizing for backtesting is to check a strategies performance on uptrends, downtrend and sideways markets seperately as to understand the weak points of strategy.
- Once you enable custom date backtesting, you will see lines on the chart which can be dragged left right based on where you want to start and end the backtesting from and to.
Note:
- Not a financial advise
- Open to feedback, questions, improvements, errors etc.
- More info on how the squeeze momentum works visit LazyBear indicator link:
Happy Trading!
Cheers
M Tahreem Alam @mtahreemalam

Variety-Filtered, Squeeze Moving Averages [Loxx]Variety-Filtered, Squeeze Moving Averages is a chop zone indicator that identifies when price is below a specific volatility threshold calculated as the difference between a fast and slow moving average and filtered using ATR- or Pips-based threshold. This indicator can be use as both an entry and exit indicator. It identifies both chop zones and breakouts/breakdowns
How to use
When the candles turn white and the threshold bands appear on the chart, this is indicative of low volatility
When price exits the threshold bands, price will usually explode up or down giving a long or short signal. This acts as a sort of squeeze momentum.
Included:
Bar coloring
Signals
Alerts, 4 types of alerts: Squeeze started, Squeeze ended, long, and short
Loxx's Expanded Source Types
35+ Loxx's Moving Averages

Squeeze Momentum 3# Squeeze Momentum 3
First of All, I would like to give my gratitude to for the initital script's idea.
This is my own version of SQZMOM. I had revised all equations and parameters according to Investopedia.
Still, no matter how much we stick to the indicator, the indicator can not see the future.
Trading results vary from time to time. In my opinion, SQZMOM is great for speculating under 4H timeframe.
Remarks;
- implement horizontal shift
- revised all equations. Unfortunately, there is no magic params.
- Be careful with your money management
- Good Luck

Leonidas Squeeze Momentum SystemThis indicator is based on LazyBear SQ Momentum Indicator and SQ Plus Indicator.
This indicator is using ADX and Squeeze Momentum Indicator.
When you see the ADX above 0 line and the slop is positive that means the trend is strong
When the ADX is below 0 line and the trend is weak you will see the slop negative and the color gray
When we see the SQ changing the color from Red to Yellow that means the sell pressure is decreasing this could be a potential buy signal
When we see the color changing from blue to dark blue that means the buy pressure is decreasing this could be a a potential sell signal
Bull/Bear divergences supported
Added SQ signal
this signal is an exponential moving average following the SQ main signal useful for filtering fake signals.
This indicator is very powerful but offers many fake signals it is recommended using this indicator with other indicators to confirm the entries

Squeeze Momentum + Volatility [LeonidasCrypto]Based on Squeeze Momentum indicator by LazyBear
This custom version of SQ is part of my Trading System.
How to use it.
Please read the description of the original author of this indicator here.
Volatility .
When the market is contracting or sideways usually you will see red or blue dots.
Blue dots. the market is in sideways and the volatility is low.
Red dots. the market is in the climax of volatility usually after of a big move this is a potential signal the peak of the move is near.
I added volatility to SQ because I consider volatility is a key factor for trading to anticipate the moves.

SQZ Multiframe StrategyThis is a first attempt to automate what my current strategy when trading is.
It uses 2 timeframes: the one you are currently using to see the chart and an "anchor trend" which is a higher order frame.
Supported timeframes are: 1m, 5m, 15m, 30m, 1H, 4H, 1D, 1W
The Strategy relies on two indicators:
Squeeze Momentum Indicator
CMF
How does it works?
It looks for a moment when the following conditions are met.
For Long:
Positive directionality in SQZM monitor in anchor timeframe
Positive directionality in SQZM monitor in current timeframe
Recent minimum in CMF
For Short:
Negative directionality in SQZM monitor in anchor timeframe
Negative directionality in SQZM monitor in current timeframe
Recent maximum in CMF
After a BUY or SELL order is executed the plot will start showing two lines: A TP line, and a SL line.
The TP and SL move dynamically based on a greedy algorithm based on 3 input parameters.
Min Profit to Start Moving SL (%): Sets an initial target for the trade.
Maximum Possible of SL (%): This is the maximum amount possible for SL. If volatility is not too high, a shorter SL will be chosen based on Kaufman's Stops method
Take profit factor: Is how much portion of the target I am taking as profit once the target is reached
Example for 5% Min profit:
When the first target is reached (+5%), the SL will be updated to 2.5% over the enter price.
When the second target is reached (+10%), the SL will be updated to 5% over the enter price.
Note: The strategy might abandon the position prematurely if a contrary signal is received while the trade is opened, and will change direction.
The Strategy has been backtested mostly for crypto. It might be good for stocks too, but the parameters mentioned might need some adjustments since price moves at a different rate.
Recommended timeframe is 4H for BTC , and 30min/1H for alts.
Comments and ideas are more than welcome!
