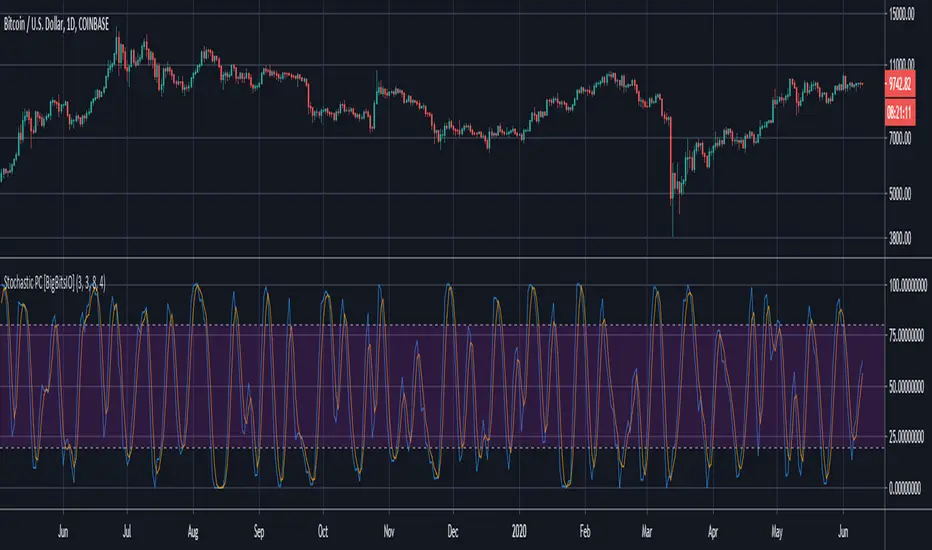
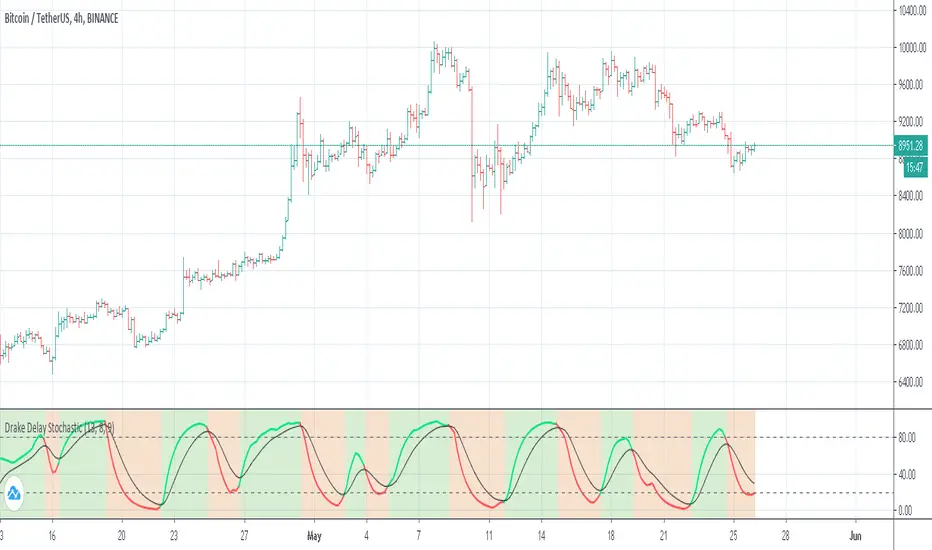
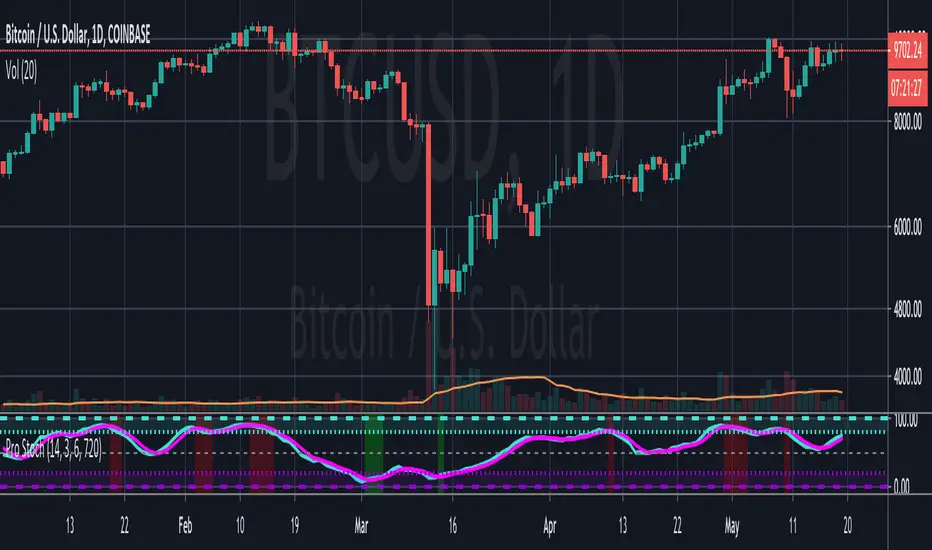
Stochastic Oscillator
IFTS+TS Strategy OverlayInverse Fisher transform on stochastic with Hull MA and Donchian Channels with oversell/overbuy levels and dynamic trailing stop
Options:
Fixed trailing stop
Dynamic, based on ATR trailing stop
Re-enter after trailing stop
Includes Hull MA
Hull MA filtration for re-entering after trailing stop
Donchian channels, with overbuy/oversell levels
No repaints
IFT Stochastic + Trailing StopInverse fisher transform on stochastic strategy with trailing stop. Good work on flats with mid-wave length
Featherlite RSI - Extra SensitiveFeatherlite RSI - Extra Sensitive
This is a combined relative strength index (RSI) ans stochastic RSI indicator set to the super sensitive period of 2 candles.
I use this setting particularly on higher timeframes such as M, W, D but can also be useful on 4h. However lower timeframes, will become to noisy.
If you compare to the standard setting of 14, you can see that the pump and dump structure is a lot more washed out
The RSI builds up slowly from its low point in 2015 to a single maximum in 2017. This is great for charting the longer cycle (interyear bull / bear), but is of little help for charting the intermediate swings. However, by increasing the sensitivity we can see when the RSI is maxing out on an intermonth basis. And indeed this matches the actual high points of the previous bull runs very well.
The indicator also includes a stochastic RSI indicator also set to the same candle period.
In practice it is always good to use a range of indicators to get a feel for what is going on. This is good for intermonth cycles on M and W timeframes. For longer cycles use the standard period setting of 14.
Stochastic + ATRStochastic oscillator with dynamic buy/sell levels. Levels calculate with volatility/averag true range. No repaint
Stochaholic — SharkCIAStochaholic consists of 8 stochastic oscillators with different speeds.
It has less noise and better visualization compared to a simple stochastic.
Created from Stochastic Rainbow by shayankm
MACD背离(MACD divergent)[公开版][gouge99]注意:背离意味着做反转交易,所以入场要求很高,但是背离一般的收益风险比很大
MACD背离:收盘价创造新高或者新低,但是macd却没有出新高或者新低
计算原理:根据历史K线长度(默认90根K线)来判断收盘价的高低极值和macd的高低极值来进行比较判断
建议使用:
1.在震荡调整行情中,在支撑和压力位附近出现的突然的趋势K线,一般是假突破
2.在趋势末端,一般还会有一次缓慢的测试趋势极点的行情,一般这是趋势反转进入震荡的开始
3.结合其他形态如双顶,头肩,pin bar
4.结合其他指标如stoch随机指标做反转
5.推荐在1h, 30m, 15m级别中使用,5m也可以使用,但是最好背离计算长度设置大一点 比如150
Triple Stochastic3 stochastic K-lines with short, medium & long periods & the D-lines removed.
Provides a good indication of where you are in the current supply/demand cycle & I find it helpful for timing entries.
Look for peaks & valleys formed by 2 or 3 lines, & entry would be when they start to turn around.
Try it on multiple timeframes & of course use confluence with other indicators & data.
Stochastic Strategy of BiznesFilosofThis strategy allows you to test the stochastic indicator, as well as adjust it to a specific trading pair. The parameters indicated in the books are too approximate and have nothing to do with modern reality. The optimal parameters for Bitcoin are now set. You can customize better for yourself. This strategy allows you to make settings.
===
Эта стратегия позволяет протестировать индикатор стохастик, а также настроить его на конкретную торговую пару. Параметры, указанные в книжках слишком приблизительные и не имеют ничего общего с современной реальностью. Сейчас установлены оптимальные параметры для биткоина. Вы же можете настроить лучше под себя. Это стратегия позволяет сделать в настройках.
TA-Money Flow-v2, Stochastic OBVNot sure where I originally got this (somewhere off Tradingview several years ago, thanks to the person who shared), just publishing because of a request.
This is basically a stochastic OBV movement indicator. It is good to work with both price and volume. I've updated to be able to display either as positive only, or both sides (50/-50), also included an invert function. It works great on any time frame, but you need to have volume data.
Enjoy.
I've got a version 3 if you're interested.
FSCG-TSSLA modification of dasanc's "Fisher Stochastic Center of Gravity"
Added:
- Thresholds for Buy/Sell Signals
- Trailing Stop / Stop Loss
- Backtest Range
Support the open-source community.
Screw you people selling open-source scripts to newbies.
Tip Jar: 3KNZq8mE24MuBmpDJVF31bBy8zc9beDiZo
Contact me for collaborations and let's take things to the next level!
Do NOT contact me for alert scripts or paid-custom work, I don't work for clients.
Stuffed Oscillators/てんこ盛りオシレーターStuffed Oscillators
You can use Stochastic RSI, Stochastic, RSI at once.
てんこ盛りオシレーター
ストキャスティクスRSI, ストキャスティクス, RSIをいっぺんに使えます。
Fisher Stochastic Center of GravityWhat happens when you take the Fisher Transform of a Stochastic Oscillator?
Well, you filter out all the stuff you don't want and are left with super-precise entries!
This indicator works especially well in with a trend-follower in a higher timeframe - iTrend, MAMA, Hull, etc...
How to trade:
Use with another indicator to tell you the current trend.
Take buy and sell signals as you would with the Stoch.
-DasanC
Godmode StochasticGodmode Stochastic oscillator that can be used as alternative to Stoch RSI, since imho it better tracks price movements.
Lysergik's Stochastic SynergyThis indicator shows the average Stochastic RSI output of the 15m, 1h, 2h, 4h, and Daily Stochastic RSI. It will change in its behavior depending on the time-frame you're using, but for many markets it works best on the 30m time-frame and the daily time-frame.
It is best used along with Lysergik's Fib Cross, which will allow you to avoid false signals in the stochastic synergy indicator. If your MA cross (50, 200) indicates a direction change opposite of the stochastic RSI synergy indicator then that is a signal to wait for more price action to determine your entry/exit points.
Using the Lysergik's Fib Cross, the same applies, but remember that a golden cross (white cross symbol) followed directly by a golden ratio cross (gold cross symbol) is even further indication that the stochastic RSI needs more breathing room before reversing.
This indicator is fully adjustable for you to back-test against charts and refine the indicator to your market.
The inputs in respective order are as follows:
RSI Length, Stoch Length, Smooth K, Smooth D, Upper Limit, Lower Limit, Basis
Enjoy and remember only make trades on your own terms.
Happy trading/investing! :)
STOCHASTIC-RSI / RSI AREASAn easy Stochastic-RSI and RSI combined to show oversold and overbought areas.