Saham
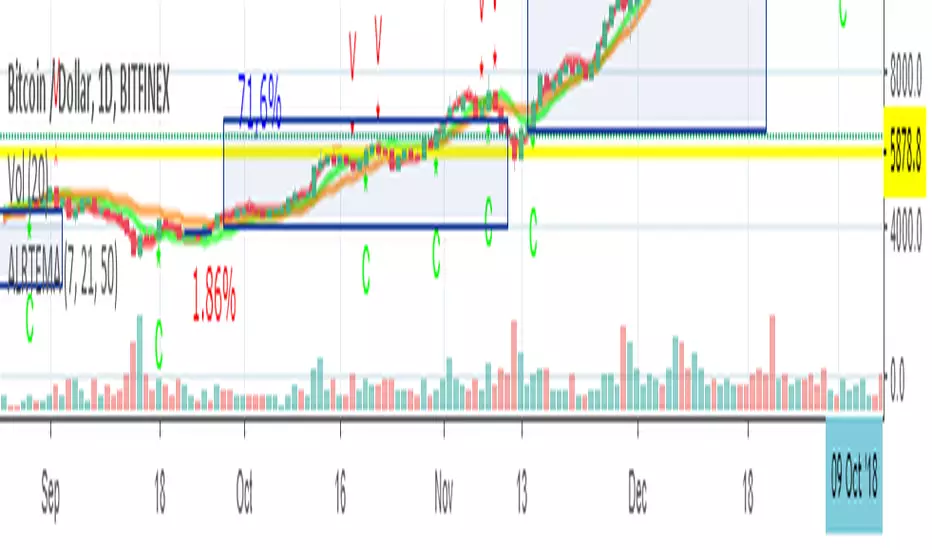
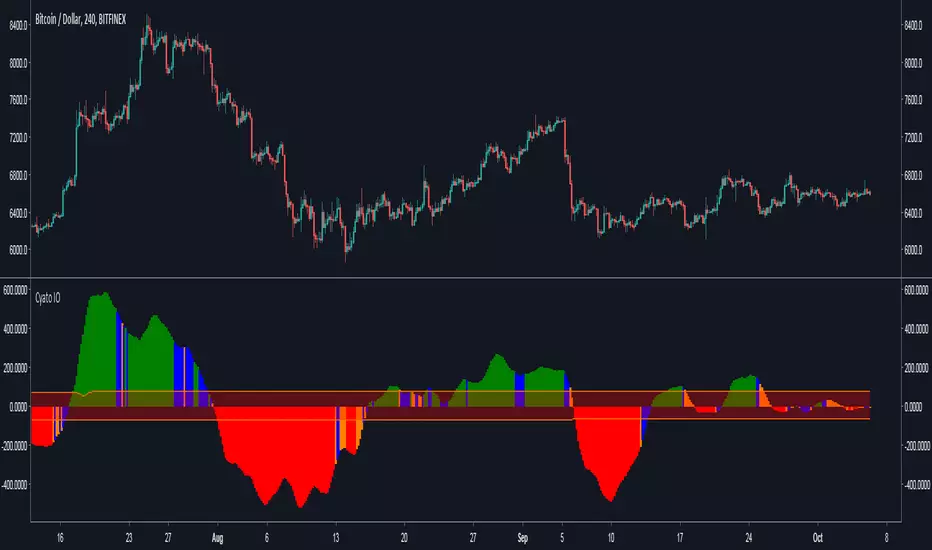
Cyatophilum Ichimoku Oscillator [ALERT SETUP]Hello, I built an oscillator based on Ichimoku trading rules. I wanted something simple to use, but powerful, with automated alerts that would help us trade breakouts and trend reversals.
The indicator can be used on all timeframes and everywhere : Crypto, Forex, Index, Stocks, Futures, CFD.
Basically, green bars equals bull market and red bars equals bear market.
Blue and Orange bars show potential breakouts and you can setup automatic alerts for receiving an email or SMS when it happens.
You can also setup alerts for new highs and new lows indicating a potential trend reversal.
The narrow channel in the middle indicates consolidating periods and unsignificant trades, because we know Ichimoku performs badly in range markets.
For more information on how to use it, I made a description page at the link below.
Sample Use Cases :
BTCUSD 4H
BTCUSD 2H with New Highs/Lows on chart (blue and red circles correspond to alert conditions)
BTCUSD 1H
ETHUSD 2H
Use divergences with price action to trade breakouts.
More information on my website
blockchainfiesta.com
Purchase this indicator today and get access to my other Cyatophilum Indicators that will help you in your trading
blockchainfiesta.com
Happy trading!
QTi65 FORMULAFind low risk entry points with this momentum Indicator formula.
Swing Trading using momentum and breakout idea.

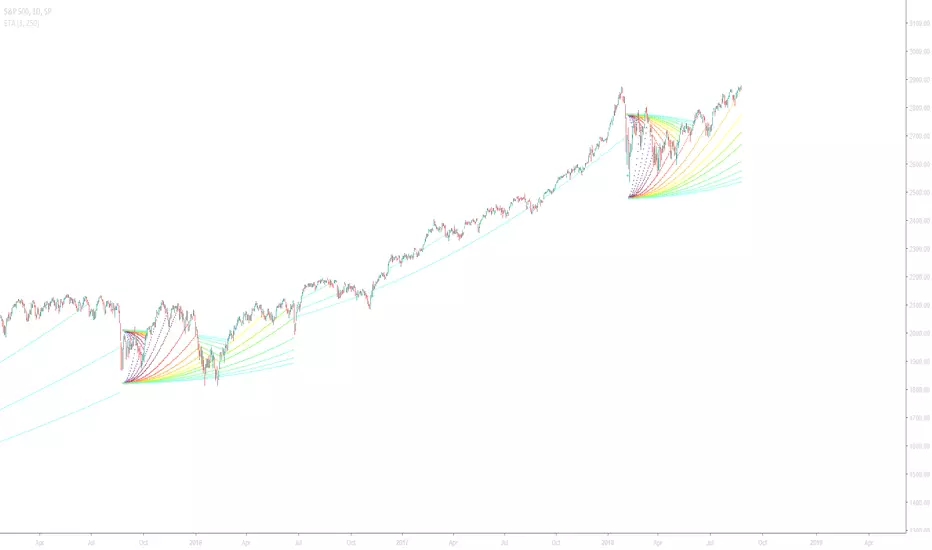
Extreme Trend Amplifier (ETA)Introduction
This indicator was created in V3 Pinescript and all projections will be displayed in real-time for active trading use.
This indicator has been designed so that it can be used across a range of securities such as equities, bonds, FX and cryptocurrencies.
All time-stamps are supported.
Comment and Like to try it out!
Understanding the Extreme Trend Amplifier
Extreme price changes are often result in a change of trend. This indicator not only allows you to identify the breakout, but to follow the direction of the change. Below is an example of the indicator using normal input values and the Dark TradingView Theme.
The Extreme Trend Amplifier is an indicator that measures the rate of change within a bar of the time stamp and plots a function when the user-defined threshold has been breached. The plot projects parabolic lines that squeeze towards the market price at an ever-increasing rate. The acceleration can also be defined in the indicator settings panel.
Indicator Utility
The first example below is the forex pair, AUD/USD using a rate threshold of 1% and an acceleration factor of three and the second using a rate threshold of 0.8% and an acceleration factor of nine.
We can observe that an increased rate threshold results in fewer instances and that a higher acceleration factor results in the instance projecting farther.
Notice that the acceleration factor is inversely related.
Input Values
Select the “ Format ”, button located next to the indicator label to adjust the input values and the style.
Rate of change (ROC) is the percentage rise/fall of the security within the time stamp. If ROC is set to 1, this is directly proportionate to 1%.
Securities such as cryptocurrencies are very volatile and will require an increased threshold.
Forex pairs will require a reduced threshold in order to produce an output as volatility is far less.
The line color, thickness and style can also be personalised to customise the strategy even further.
In this example, I have adjusted the projected instance that appears below the bars blue and above the bars red, indicating an uptrend or downtrend.
It is also possible to change specific bars in order to identify the extent to which a trend has continued as seen below.
If you would to find out more about this indicator, visit www.kenzing.com
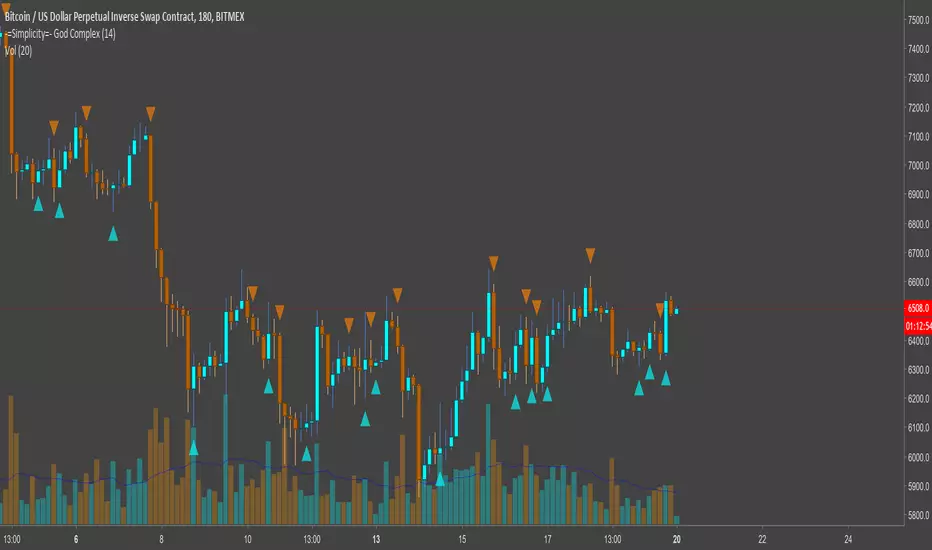
-=Simplicity=- God ComplexMaking money is simple when you wield untold power
-=Simplicity=- God Complex is a non-repaint, set-and-forget indicator for identifying optimum times to enter and exit the market, with both longs and shorts.
Applicable to any asset-type, market, candle type and timeframe, God Complex is a quintessential tool for both new and veteran traders.
With only one variable to change it will take a minimal amount of time to find a value that suits you. As a rule of thumb, the higher the value the less it will fire signals, but the safer those signals will be.
You can also opt to only enable 'Long' or 'Short' signals on the chart. This is meaningful when trading leverage or margin along trend that you are able to identify.
This can be used as a guide for manual trading, but is best utilized as a tool for automating trades so that you don't miss out on any market activity.
This is a link to a document elucidating a little more on the script: docs.google.com
---------------------
Here are a few charts showing how the script performs against them. Enjoy.
Below is a chart depicting XBTUSD (BitMEX) on a 30M timeframe. Both longs and shorts are enabled and the variable is set to a value of 144.
Below here we have a chart for BNBBTC (Binance) on a 1HR timeframe with variable set to a value of 14 on Heikin Ashi candles. Large orange arrows are shorts and smaller blue arrows are closing shorts. There's a clear downtrend, hence we're only shorting.
This is EOSBTC (Bitfinex) on a 2HR timeframe with a variable set to 7 on Renko charts. Small orange arrows are exiting a long position and large blue arrows are entering a long position. The uptrend is obvious to see, so that's why we're mainly displaying longs here.
Not that I reccommend anyone to trade such a small timeframe, but this is for all you scalpers out there. XBTUSD (BitMEX) on a 1M timeframe with a variable value of 233. Both longs and shorts are enabled for this chart. Normal bar candles apply.
Finally, this is ARKBTC (BitTrex) on a 2HR timeframe against a 500R chart with a variable of 377. Only shorts are enabled, as we're in a downtrend.
---------------------
Please contact @overttherainbow on Telegram if you'd like to discuss anything, alternatively reach out to me here (although Telegram is better for a quick response; I'll be around 9AM-11PM GMT)
Random Walk SimulationUnderstanding the Random Walk Simulation
This indicator randomly generates alternative price outcomes derived from the price movements of the underlying security. Monte Carlo methods rely on repeated random sampling to create a data set that has the same characteristics as the sample source, representing examples of alternate outcomes. The data set created using random sampling is called a “random walk”.
First, every bar in the time stamp is measured and put into a logarithmic population. Then, a sample is drawn at random from the population and is used to determine the next price movement of the random walk. This process is repeated fifteen times to visualise whether the alternative outcomes lie above or beneath the current market price of the security.
Random Walk Utility
The random walk generator allows users of the Monte Carlo to further understand how the Monte Carlo projection is generated by creating a visual representation of individual random walks. Trends that occur on the random walks may correlate to the historical price action of the underlying security.
You can find the Monte Carlo Simulator here:
Input Values
Select the “ Format ”, button located next to the indicator label to adjust the input values and the style.
The Random Walk indicator only has one user-defined input value that can be changed.
The Random_Variable randomises a set of random walks. If this variable is changed, it will run a fresh set of 15 random walks which will result in a slightly different outcome.
Adding the indicator to your chart multiple times using many different random variables will allow you to achieve a more accurate reading. Ideally, the Monte Carlo Simulator takes an average of these to be interpreted.
For more information on this indicator, the full PDF can be found here: www.kenzing.com

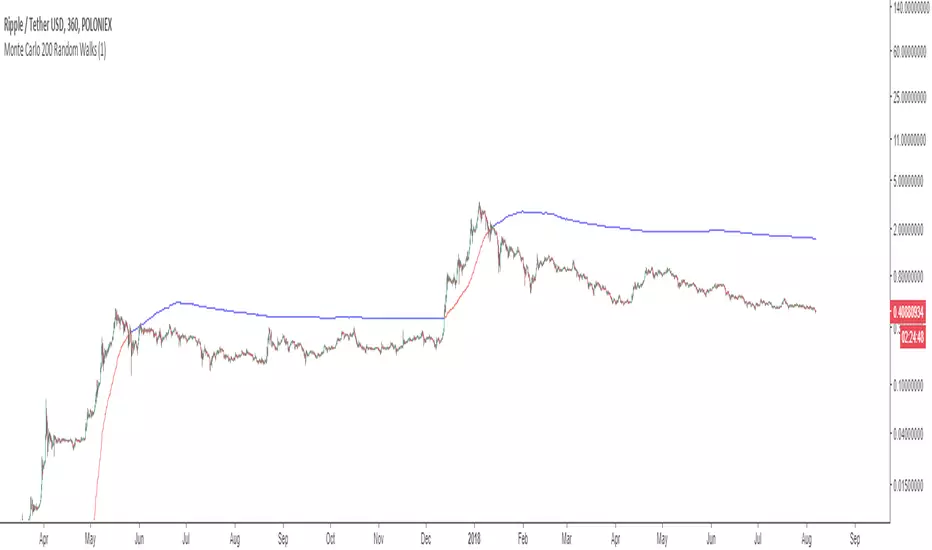
Monte Carlo Simulation (200 Random Walks)Understanding the Monte Carlo Simulation
This indicator uses Monte Carlo methods to predict the future price of a security using 200 random walks.
Monte Carlo methods rely on repeated random sampling to create a data set that has the same characteristics as the sample source, representing examples of alternate possible outcomes. The data set created using random sampling is called a “random walk”. Obtaining a mean from 200 random walks allows us to benchmark the performance of the source against the random walks obtained from the source.
Monte Carlo Utility
This Monte Carlo simulator plots a single line that represents 200 random walks across any security and time stamp. The line is red if most of the random walks are lower than the price of the security, and blue if the walks are higher.
Input Values
Select the “ Format ”, button located next to the indicator label to adjust the input values and the style.
The Monte Carlo indicator has only one user-defined input value that can be changed.
The Random_Variable determines set of random walks. If this variable is changed, it will run a fresh set
of 200 random walks which will result in a slightly different outcome. 200 random walks will load
relatively quick and produce roughly the same outcome as 10,000 random walks.
Adding the indicator to your chart multiple times using many different random variables will allow you
to achieve a more accurate reading.
For more information on this indicator view the PDF here: www.kenzing.com
Block Sale Transaction Alert!Understanding Block Transactions
Block transactions are transactions that are of a significantly high value. This can be a transaction of any
security that is large enough to have an impact on the market price and cause a flow-on effect of
investment that will ensue.
Block transactions are significant because the party who initiated the transaction is likely to be more
confident than the retail investor. Confidence can be assumed by the value of the transaction and the
source can be either,
a) an institutional fund with access to detailed and reliable information
or
b) a party with secret, insider knowledge that is currently undisclosed to the market.
For these reasons, being aware of block transactions is extremely important for anyone looking for a
new investment opportunity or risk management of current holdings.
Block Transaction Utility
This indicator is compatible with instant E-mail and SMS notifications so that the investor will be well
informed of institutional activity and make trading decisions quickly.
If a block transaction occurs, the user will be able to visualize whether it was a purchase or sale as it will
be textualized above or below the current bar if used with the Block Transaction Buy Alert found here:
Input Values
The visual representation of the transactions are customizable as you can adjust the shape, color, and
location by clicking “ Format ” at the top left of your chart, next to the indicator label.
Setting up Text message or E-mail Notifications
In order to receive the text message and/or email alerts, you will need to make sure the correct contact
information is saved in your TradingView® account settings.
For more information on this indicator, and setting up alerts, view this PDF: www.kenzing.com


SignalToSignal.com - Logical Volume Trading SystemOur Logical Volume Trading System is a vast improvement on ‘standard’ volume spread analysis. Based on 15+ year combined experience with our Smart Volume Spread Analysis software, we have refined our analysis and algorithms to provide the most powerful VSA indicator on TradingView.
Combining fundamental analysis, technical analysis, and volume analysis into a powerful methodology that enables you to trade the markets in a way that is uniquely accurate.
The Signal to Signal Logical Volume Trading System quickly handles time-consuming manual background analysis, volume analysis, and signal analysis leaving you free to make considered and knowledgeable trading decisions instantly.
We have refined our price action and volume analysis algorithms to focus on the core trading signals, which often precede large moves, providing you with clear insight and a roadmap to trading successfully.
Due to unique characteristics of the Pine programming language that TradingView indicators utilize, we have also made adjustments to the signal validation and advisor systems. The result is a clean, easy to read chart which allows you to recognize strong setups as soon as they form.
Lastly, our Logical Volume Trading System is customizable. You can choose which signals and advisor warnings are enabled, allowing you test any number of ideas and analysis combinations. Of course the system is optimized for most charts by default so you can get started right away.
To gain access to the Logical Volume Trading System, please visit our website .
If you have any questions, please contact us through the Contact link on our website - signaltosignal.com

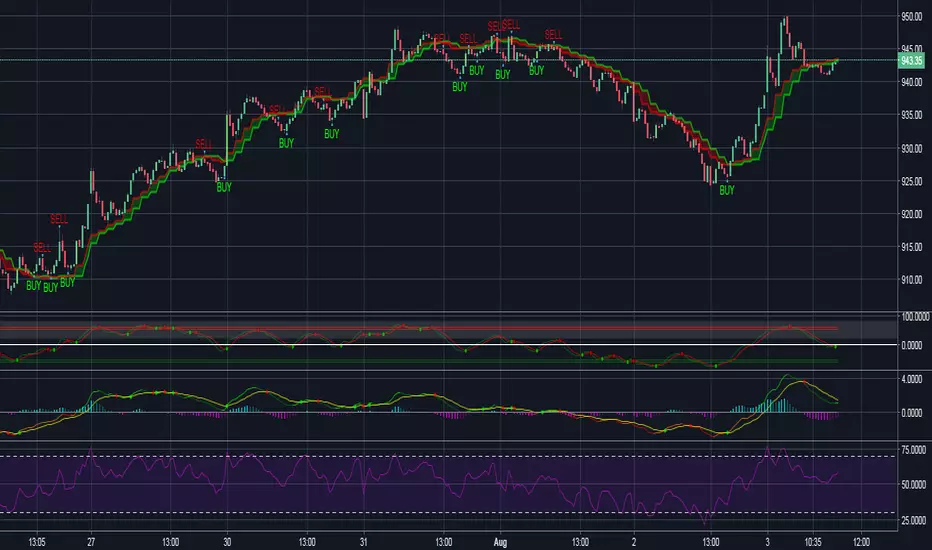
Stock Vn Signal Buy Sell Pro [PlungerMen]Vn Stock Signal Buy Sell Pro , mix 2 indicaror in it for exactly Signal
This Script is perfectly functional and works well by me and the best way to use this script is to use it with “Long Short" script, both compliment for each other. the "Long Short" script is Free, you can find it by searching
If you want to be more accurate and more efficient, more comfortable when you do not want to see too many other indicators, you can register for our Professional edition.
- The Professional Edition supports Level 1 and Level 2 commands ( display at chart : LONG+, long-, SHORT,+,short- ), which are very effective in allocating funds and optimizing your profits
Besides that,You will be supported by personal preferences, profit maximization -2.64% -1.30% -3.21% -3.33% -3.27% Scalping Pro and B Long Short Pro
- We will invite you to the signal channel Telgram with the announcement of the bottom and the peak of the BTC -3.11% -2.64% -1.30% -3.21% -3.33% -3.27% 0.60% -0.13% ,the big variable variable has exists
**We hope you enjoy this script. Your support will help us develop more good quality scripts in the future to serve the community **
**Remember, Like this script and posivite feedback if you are satisfied**
if you have any questions, post a comment ... below here
*********** Guide:
+ option for all frames : Click setting and input high and low for time inteval
+ hide wave trend : Click setting -> click Style --> Up trend Fill or Down trend fill
******
New features: this time we add two lines that can help traders trader safer. When the red line cross above the green line means we are in the downtrend and when the green line cross above the red line, which means we are in a uptrend. This new features will help traders do a safer trade at small time frame.
We have the Script free for the user pass, search keyword " Vn Stock Signal Buy Sell Pro "
-->> 0.2 eth/1 month will be used Script: Vn Stock Signal Buy Sell Pro Pro an Super Bot alert telegram <--
Swinger v2This script is used for swing trading:
Rules for reading indicator plot:
1) BUY: on green
2) SELL: on red
3) The height of the indicator tells the strength of the trend.
Message me for access

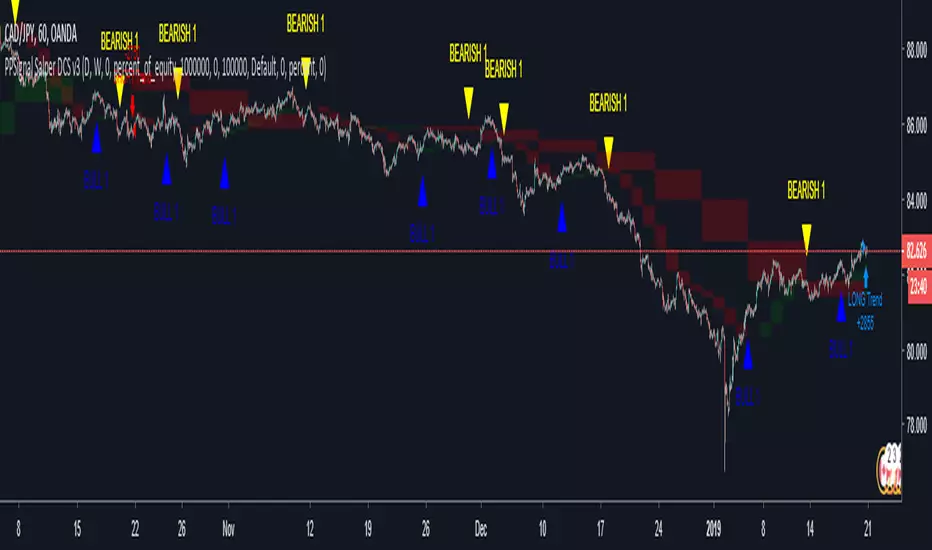
PPSignal Salper Double Cross SignalPpsignaldouble cross signal use two different ppsignal signal in 2 different time.
Recommendations, for Forex and concurrency pair
Period 1 Period 2
5 to 15 min: 60 240
45 to 60 min: 240 D
240 min and D W M
For stock, etf, bound etc.
Period 1 Period 2
5 to 15 min: 60 240
45 to 60 min: D W
240 min and D W M
Trendster v1.0The Trend Is Your Friend
Trendster v1.0 will give you simple areas of possible entries (both long and short) in order to jump on board new trends early and stay in the trade for maximum profit. Can be used with most assets including equities, FOREX and cryptocurrencies. Alerts can be created from this indicator allowing for better manual trade timing or autotrading. Happy trading!

Signal StreamSIGNAL STREAM
Want a TL;DR?
Signal Stream gives you actionable trading signals. It’s as simple as that.
LONG ANSWER
Signal Stream is the culmination of years and years of research, testing, and analysis of The Big Three data points of market information.
• Major Data Point One – PRICE. The one everyone cares about most.
• Major Data Point Two – TIME. We’re all bound by it. We can’t escape it.
• Major Data Point Three – VOLUME. With this third point, the market takes on an entirely new dynamic.
Signal Stream takes these points into account, runs them all through tested (ridiculously so) algorithms based of our knowledge and experience trading.
The result? Clean, actionable signals you can trade.
Primarily used on and around the 1 hour time frame. That’s the power of TradingView! So many custom time frames to look at!
Blue arrow pointing up? Go long!
Red arrow pointing down? Go short!
SIMPLY PRESENTED – COMPLEXITY HIDING UNDER THE HOOD
To be perfectly clear, this isn’t some script that does a couple MA crossovers and checks RSI against the Elliot Wave Fib Zig Zag on a Bollinger Band.
Signal Stream is 2000+ lines of tested, rigorous logic built in Pine for TradingView.
It’s based on a method of price action and volume analysis that has been proven profitable over and over for the past 10 years.
What method exactly? Weeeeell…. That’s our secret sauce. :)
But it’s a secret sauce developed over the past ten years by traders with a combined 25+ years in trading and trading system development.
We’ve refined our analysis of PRICE and TIME and VOLUME.
It’s a little bit like if pattern analysis and VSA had a kid and then taught that kid a lot of other really important market confluence ideas.
Okay, maybe that analogy got away from me….
Signal Stream is hours and and days and weeks and months and years spent in front of charts, writing code, staring at spreadsheets, testing, refining, and trading.
All distilled into a simple, power signal system.
SIGNAL STREAM GUARANTEE - NOT GONNA GIVE YOU THE RUN AROUND
Look, I can’t guarantee you will make money. That’s not only illegal, it’s also a ridiculous promise and absolutely a red flag. Anyone guaranteeing that you will make money is probably selling you snake oil and you should steer clear of them.
What I can guarantee is that there is no other indicator on TradingView right now that looks as deeply into PRICE, TIME, and VOLUME as Signal Stream does.
I guarantee you that Signal Stream provides clear, actionable signals based on 25+ years of experience and 10+ years of hardcore testing and live trading.
PM US TO GET PAYMENT INSTRUCTIONS AND ACCESS.

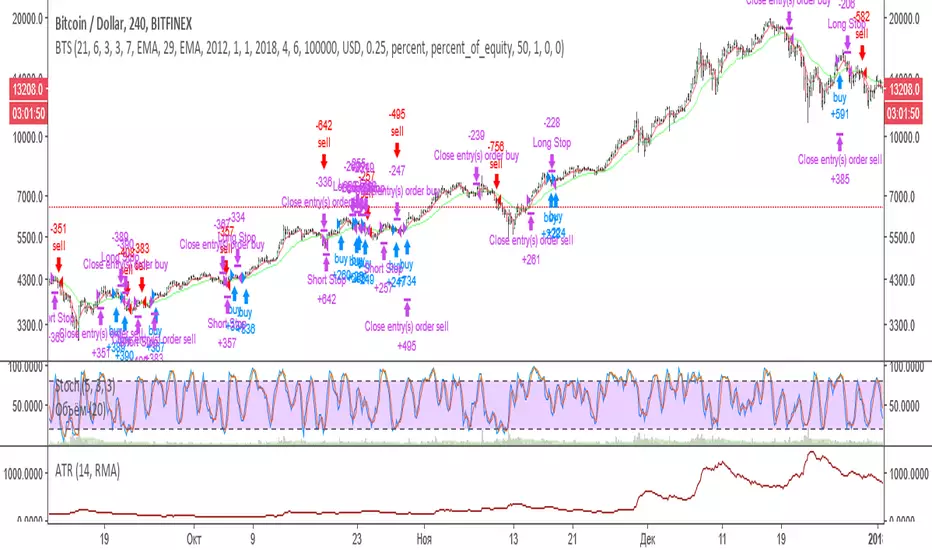
Base Trading StrategyEnglish description:
Following script is the realisation of strategy that discribed in one of educational video on YouTube .
First of all strategy choose trend direction using moving averages and then searching for entry using stochastic and waiting for a price rollback.
Conditions for long entry:
1. Fast MA is under slow MA.
2. Stochastic is increasing.
3. Price fluctuation touch fast MA or is lower then fast MA.
For short entry it uses conditions in reversive way.
Exit conditions:
1.Stop is equal 1 ATR.
2. Fast and slow MAs crossed in the opposite direction.
We set comission in script equal to 0.25% and amount of bet is equal to 50% of deposit by default.
Authors of video recomends to use next settings: 12 EMA, 34 EMA and Stochastic 5,3,3. But judging by backtesting for different pairs absolutely different parameters can match better then this. It's possible to find profitable parameters for stock, forex and crypto markets as well. Anyway this strategy is weak on flat movement and quite well on trend movement.
Описание на русском:
Данный скрипт является реализацией стратегии описанной в этом видео .
Стратегия исопльзует определения тренда по скользящим средним, а затем определяет точки входа, используя стохастик и откат цены.
Условия входа в лонг:
1.Быстра МА должна быть выше медленной МА.
2. Стохастик должен возрастать.
3. Цена должна коснуться или уйти ниже быстрой МА.
Для входа в шорт условия должны быть выполняться в обратную сторону.
Условия выхода:
1. Стоп составляет 1 ATR.
2. Быстрая и медленная скользящие должны персечся в обратном направлении.
Отличие от стратегии видео только в том, что отсутствует тейк-профит. Выход из сделки происходит только по стопу, либо по обратному пересечению скользящих средних. В скрипт по умолчанию вставлена комиссия 0.25% и по умолчанию торг идёт на 50% капитала.
Авторы видео предлагают использовать: 12 EMA , 34 EMA и Stochastic 5,3,3. Но судя по бэктесту по очевидным причинам для разных инструментов подходят абсолютно различные параметры.
Возможно подобрать профитные варианты как для фондового рынка, валютного рынка, так и рынка криптовалют. В любом случае стратегия очень слабо себя ведёт на флете и достаточно не плохо на движении.
В своём канале на YouTube мы выложили разбор данной стратегии на бэктестинге.
SignalToSignal.com Volume Trend AdvisorThe Signal to Signal Volume Trend Advisor is a proprietary volume and priced-based trend predictor. Leveraging over 20 years of volume-price trading and systems development, we utilize proprietary Volume Spread Analysis ( VSA ) concepts and internal market dynamics to alert you visually and in real time of an imminent trend change.
The indicator was developed to keep autonomous trading systems on track while a trader is away from their charts. While it is meant to be used in conjunction with other trading systems and methods as a filter or as confluence, VTA also stands strongly on its own.
The trend analysis algorithm indicates trend changes visually and in realtime based on static, non-lagging market information. This means that the Volume Trend Advisor does not and cannot repaint, ensuring any signal received is valid and actionable.
Large moves are captured and even trades that result in a small loss when taken to the next signal generally move some significant amount in the direction of the signal, meaning that given proper trade management, even a failed trend can still be profitable.
Because the indicator works using volume and price data, the Volume Trend Advisor works well on any chart. We personally use the indicator to successfully trade Stocks, Forex, Commodities, and Crypto Charts such as Bitcoin ( BTC ).
To gain access to the Volume Trend Advisor, please visit our website - signaltosignal.com
If you have any questions, please contact us through the Contact link on our website - signaltosignal.com

VFilterAlthough this script is inspired by the design of Elder Impulse script created by LazyBear, the engine is not the same.
The goal of this indicator is to filter price movement, establish direction, and manage risk. This indicator is not be used on its own, its only to be used to help establish entrys and exits.
The signals are created using a privately developed moving average on multiple time frames.
HOW TO
15, 60, 120, or 240 min chart
Green = Buy signal
Red = Sell signal
Blue = Bullish consolidation, or an aggressive/riskier buy signal
Yellow = Bearish consolidation. or an aggressive/riskier sell signal
Adjustment value is high due to the nature of the moving averages. Try using 400, 700, 900, or 950 for best results.
I suggest using this indicator with MACD and a levels indicator for price targets.

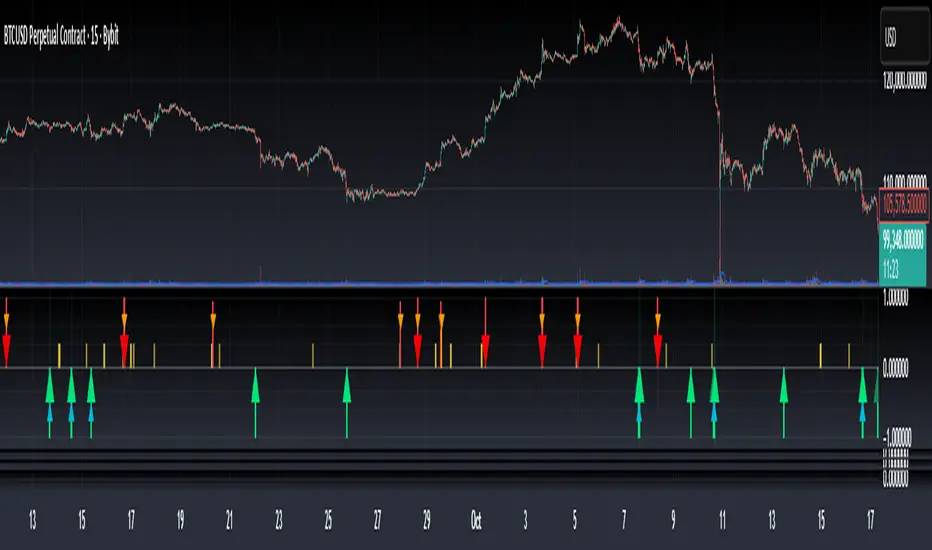
Bottom & Top Finder v3.0Bottom & Top Finder v3.0 is a proprietary multi-component oscillator designed to identify potential market reversals and extreme price conditions. The indicator analyzes momentum, volatility, and price behavior to generate bullish and bearish signals with strength classification.
█ OVERVIEW
Each signal is classified into three strength levels (Weak, Medium, Strong) allowing traders to prioritize high-conviction setups.
Signal Classification:
• Strong signals (±1.0): High conviction setups with multiple confirmations
• Medium signals (±0.6): Moderate conviction with key component alignment
• Weak signals (±0.33): Early warnings or preliminary indications
█ KEY FEATURES
Smart Signal Management
The indicator includes an intelligent system that allows signal sequences to complete naturally while preventing excessive noise. Unlike traditional cooldown systems that block all signals during a cooldown period, this implementation allows consecutive signals during a "run" and only applies cooldown after the signal run ends. This ensures complete multi-bar patterns are captured while preventing rapid flip-flopping.
Advanced Filtering System
Three optional filters allow adaptation to different market conditions:
• Volume Confirmation Filter: Validates signals against recent volume activity across a configurable lookback period. Checks if any bar in the lookback window exceeded average volume by the specified multiplier.
• Trend Alignment Filter: Four operational modes including With Trend, Counter Trend, Statistical Distance, or Off. The anomaly mode uses calculations to identify signals only at statistical extremes rather than simple directional bias.
• Signal Type Selection: Enable or disable weak, medium, and strong signals independently based on your trading style and risk tolerance.
Comprehensive Alert System
Ten distinct alert conditions cover every use case. Alerts include price level and timestamp, and are ready for webhook integration with automated trading systems.
█ HOW TO USE
Basic Setup
1 — Add "Bottom & Top Finder v3.0" to your chart in a separate indicator pane
2 — Optionally add "Bottom & Top Finder v3.0 - Chart Labels" for on-chart visual markers
3 — Configure lookback periods (defaults work well for most timeframes)
4 — Enable or disable signal strengths based on your trading style
5 — Apply filters as needed to reduce noise in your specific market
Signal Interpretation
Histogram magnitude indicates signal conviction. Multiple signal types can fire simultaneously and are aggregated into the composite score.
Alert Configuration
Set up alerts through TradingView's standard alert system using the built-in alert conditions. Choose from individual signal types (for specific setups) or aggregate alerts (for broader monitoring).
Recommended Approach
• Combine indicator signals with price action and support/resistance analysis
• Use strong signals for entries, weaker signals for early warnings or exits
• Enable filters when trading liquid markets with reliable volume data
• Adjust cooldown period based on timeframe: lower for active trading, higher for swing setups
• Start with default settings and adjust based on backtesting results
█ SETTINGS
Lookback Settings
• Main Lookback Period: Primary calculation period for most components (default: 21). Lower values increase sensitivity, higher values smooth signals.
• Range Lookback: Extended lookback for range high/low analysis (default: 50). Affects extreme condition detection.
Signal Settings
• Enable Weak Signals: Toggle weak signal detection (default: on)
• Enable Medium Signals: Toggle medium signal detection (default: on)
• Enable Strong Signals: Toggle strong signal detection (default: on)
Filter Settings
• Enable Volume Filter: Require volume confirmation (default: off)
• Volume Lookback: Period to check for volume spikes (default: 30)
• Volume Spike Multiplier: Threshold above average volume (default: 1.3x)
• Trend Filter Mode: Off, With Trend, Counter Trend, or Anomaly (default: off)
• Trend SMA Period: Moving average period for trend calculations (default: 50)
• Anomaly Threshold: Minimum statistical deviation for anomaly mode (default: 1.5)
Display Settings
• Show Composite Histogram: Toggle main histogram display (default: on)
• Show Signal Bars: Toggle triangle markers in indicator pane (default: on)
• Show RSI Reference: Overlay normalized RSI for context (default: off)
█ TIMEFRAME CONSIDERATIONS
The indicator works on any timeframe from 1-minute to monthly charts. However, optimal performance requires timeframe-appropriate configuration:
Shorter Timeframes (1m-15m)
Consider reducing main lookback period for increased responsiveness. Volume filter may be less reliable in some markets during low-liquidity sessions.
Medium Timeframes (1H-4H)
Default lookback periods are optimized for these timeframes. Volume and trend filters provide good noise reduction.
Longer Timeframes (1D+)
Consider increasing lookback periods for smoother signals. Filters are highly effective at these timeframes.
█ BEST PRACTICES
Risk Management
This indicator is a technical analysis tool designed to identify potential reversal zones and does not guarantee profitable trades. Users should:
• Understand that signals indicate potential setup zones, not guaranteed outcomes
• Employ proper position sizing and risk management on every trade
• Combine indicator signals with their own analysis and trading strategy
• Paper trade and backtest thoroughly before live implementation
• Never risk more than they can afford to lose
Signal Context
Indicator signals should be evaluated within broader market structure. Consider:
• Proximity to key support and resistance levels
• Overall trend direction and strength
• Market volatility and liquidity conditions
• Confluence with other technical indicators or patterns
• Fundamental factors that may override technical signals
█ NOTES
• All signals use confirmed bar data and do not repaint
• The cooldown system tracks top and bottom signals independently
• Multiple signal types can fire simultaneously; the composite score aggregates them
• Anomaly mode measures standard deviation magnitude, not just directional bias
• Volume filter checks any bar in the lookback period, not just the current bar
• Strong signals require more confirmations than medium or weak signals
Top Finder 1.1Top Finder is an automated cryptocurrency signals and analysis tool which uses a complex algorithm involving multiple indicators, trends, and cross-overs including proprietary formulas developed in-house to predict the top or near top price of cryptocurrencies. It also works well on stocks, gold, oil and forex, even soybeans!
Top Finder is the sister indicator to Bottom Finder (check my other scripts).
Signal strength is represented by height/color of the signal. (Taller signal = stronger signal).

Bottom Finder 2.2Release 2.2
Bottom Finder is an automated cryptocurrency signals and analysis tool which uses a complex algorithm involving multiple indicators, trends, and cross-overs including proprietary formulas developed in-house to predict the bottom price of cryptocurrencies. It also works well on stocks, gold, oil and forex!
Future updates will be included onto this script.
Tip #1: In a bear market, the Half height (fuchsia colored) signals should be ignored by the risk averse trader. In a bull market feel free to buy on both the signals.
Tip #2: In a bear market, use a smaller percent gain instead of TSSL to set your exit targets. In a bull do the opposite, using TSSL (or method of your choice) to exit.

Traders Dynamic Index Pro by YardleyRosetteThis is an excellent indicator thanks to the code author LazyBear!
I have modified to a more appealing colors visually representing market condition.
2 Backgrounds
Uptrend/Sell: Uptrend above Orange line, Sell potential area.
Downtrend/Buy: Downtrend under Orange line, Buy potential area.
I have modified by adding previously unrecognized upper and lower channels of support/resistance zones within Traders Dynamic Index which will be of great use in previously confusing situations.
The Traders Dynamic Index, observes trend direction , market strength , and market volatility .
To be used by the "elite", the Pro accounts.
Multiple Time Frames are ABSOLUTELY required. I'm sorry for those who aren't. I can refer you who don't, to try out KK_Traders Dynamic Index Higher Timeframe (by Kurbelklaus).
Multiple Time Frames are necessary or else technical analysis using this one chart alone will give false reasoning as I have witnessed a few who do attempt to use this time machine, including me when I had not used multiple time frame charts since I did not have the PRO account.
Problems, for example low time frame indicates 'overbought' yet higher time frame indicates it had been oversold. Which are you to agree with? The higher time frame absolutely.
In this condition though an overall retracement will very likely occur in the short-term.
Here is my clever explanation of the rules:
Use of time frames: Traders' choice of combination.
For example, 180, 90, and 45 minute charts may be useful for example with Bitcoin
You can see what may confuse others. Apparently rising as a buy signal for having green line cross up from below orange line, but 90 minute time frame thanks to this support/ resistance channel coded within T.D.I. can be observed as an alerting condition. Then observing 45 minute time frame notice the blue lines ("Bands") are 'squeezing' the other components you can then expect a breakout , and if its in the overbought side, at least above 56, and the 240 time frame can identify current downtrend... you know how to connect the data given by the charts: Ranging Overbought in a downtrend will breakout. 1) Overbought in downtrend: Sell, 2) Ranging to breakout, set entry order according to pattern. With probability on your side, you can set a sell stop under the tricky uptrend line when all others are wondering what will happen, you are ahead.
According to range scalping: Great Scalping
Only if orange (MBL) line steady within upper and lower midlines 40 and 60
Long, when green and red line are under 44 with green crossing over red.
The green line is above the red line
The green line is above the orange line
Short, when green and red line are above 56 with red crossing over green.
The green line is below the red line
The green line is below the orange line
Close when opposite signal is about to occur
