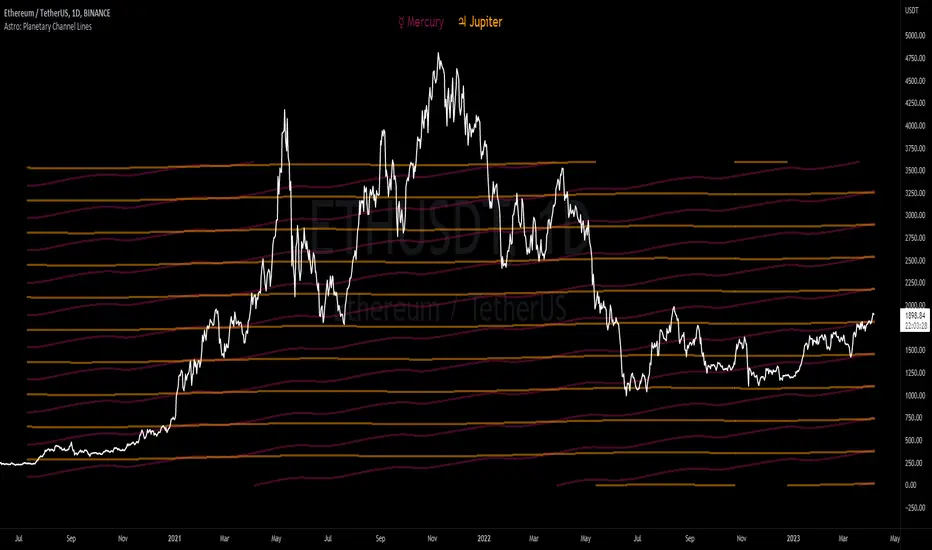
Astro: Planetary Channel LinesPlanetary Channel Lines is an approach to financial astrology that involves using the positions of the planets to predict trends and patterns in the stock market. The idea behind planetary lines is that the positions of the planets in the sky at the time of a market event can significantly influence that event.
The planetary lines approach involves mapping the planets' positions onto a stock market graph, with each planet's position representing a specific line. These lines are thought to indicate areas of support and resistance, as well as potential turning points in the market.
This indicator includes geocentric/heliocentric planetary lines on the chart for up to two planets, price scaling & vertical offset, retrograde highlighting, and aspect recognition with customizable precision.
SUN
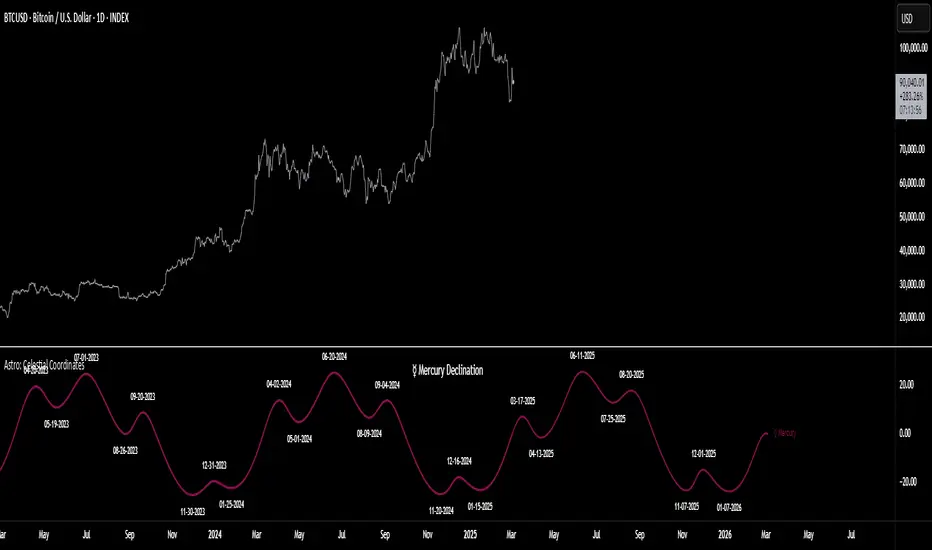
Astro: Celestial CoordinatesCelestial coordinates are a system of measurements used in astronomy and astrology to describe the positions of celestial objects such as stars, planets, and constellations. There are several different celestial coordinates, including right ascension (RA), longitude, latitude, declination, and altitude. Each coordinate has its own astronomical or astrological significance, as outlined below:
Right ascension (RA) is a coordinate used to describe the position of an object in the sky along the celestial equator. It is measured in hours, minutes, and seconds and is analogous to longitude on Earth. RA is significant in both astronomy and astrology because it allows astronomers and astrologers to accurately locate celestial objects in the sky.
Longitude is a coordinate used to describe the position of a planet or other object in its orbit around the Sun. It is measured in degrees and is significant in astronomy because it allows astronomers to accurately predict the positions of planets and other objects in the solar system.
Latitude is a coordinate used to describe the position of an object in the sky relative to the celestial equator. It is measured in degrees and is significant in both astronomy and astrology because it helps astronomers and astrologers to determine the positions of celestial objects in the sky.
Declination is a coordinate used to describe the position of an object in the sky relative to the celestial equator, similar to latitude but measured in degrees north or south of the celestial equator. It is significant in astronomy because it allows astronomers to accurately locate objects in the sky.
Altitude is a coordinate used to describe the height of an object above the horizon. It is measured in degrees and is significant in both astronomy and astrology because it allows astronomers and astrologers to determine when objects will be visible in the sky and at what angle.
In astrology, celestial coordinates are used to create maps of the positions of celestial objects. This indicator plots the corresponding celestial coordinate
values for each planet, moon, or sun and labels key turning (pivot) points with a date (& optional time). Hover over labels for additional information.
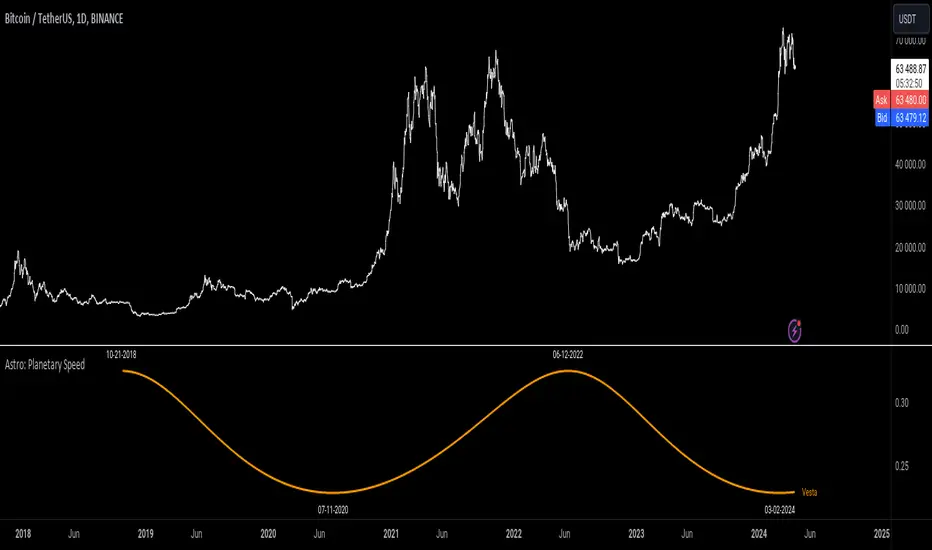
Astro: Planetary SpeedPlanetary speed refers to the rate at which a planet moves along its orbit around the Sun. The speed of a planet can vary depending on its distance from the Sun, and is generally fastest at the point in its orbit where it is closest to the Sun (perihelion) and slowest at the point where it is farthest from the Sun (aphelion).
The significance of planetary speeds lies in their astrological interpretation. In astrology, the speed of a planet is thought to influence its energy and influence earthly affairs. Fast-moving planets, such as Mercury and Venus, are believed to have a more immediate and fleeting influence, while slower-moving planets, such as Jupiter and Saturn, are thought to have a more long-lasting and significant impact.
Astrologers use the speed of the planets, along with their positions, aspects, and other factors, to interpret their influence. By understanding the energy and symbolism associated with each planet, astrologers can provide insight and guidance to individuals seeking a greater understanding.
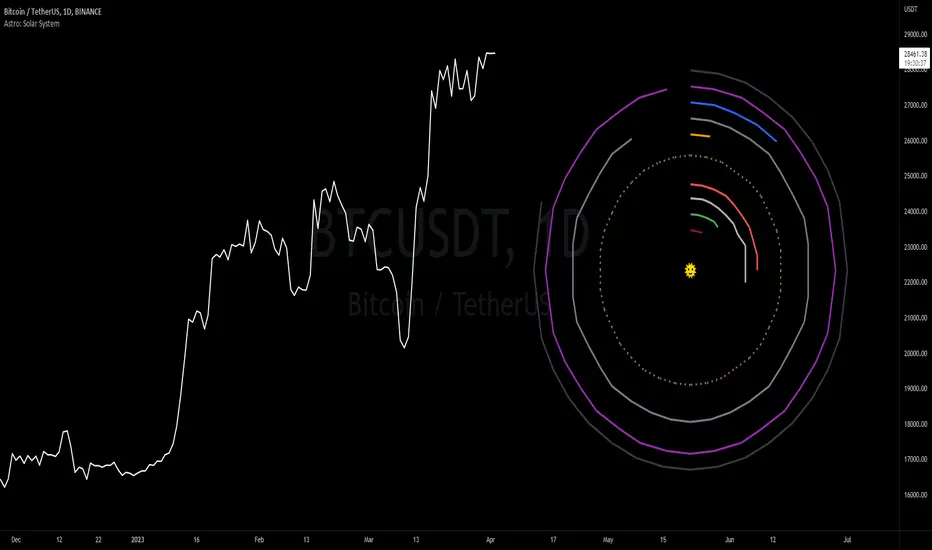
Astro: Solar SystemA bird's eye view model of the solar system is a simplified representation of our planetary system as seen from above. It can be thought of as a two-dimensional map of the solar system, in which the planets are shown in their approximate heliocentric longitudinal positions relative to the Sun and each other.
In this model, the Sun is shown as a large, central emoji, with the planets arranged in orbits around it. The inner planets - Mercury, Venus, Earth, and Mars - are located close to the Sun and inside the asteroid belt, while the outer planets - Jupiter, Saturn, Uranus, Neptune, and Pluto- are located farther out.
In a bird's eye view model, some of the details of the solar system are necessarily left out or simplified. For example, the distances between the planets are not to scale, and the orbits are shown as perfect circles rather than the elliptical shapes they actually are. Nonetheless, this model can provide a useful visual real-time representation of the relative heliocentric longitudinal positions (aspects) of the planets in our solar system.
🏅 Shoutout to @LuxAlgo for the circle code!
Astro: Planetary Aspect TableIn astrology, planetary aspects refer to the angles formed between two or more planets in a horoscope or birth chart. These angles are created by the positions of the planets in the sky and are thought to represent a particular energy or influence that can impact events on Earth.
The most common planetary aspects are the conjunction (when two planets are in the same position in the zodiac), the opposition (when two planets are direct across from each other in the zodiac), the trine (when two planets are 120 degrees apart in the zodiac), and the square (when two planets are 90 degrees apart in the zodiac).
This chart overlay displays a real-time table of current interplanetary aspects for all AstroLib celestial body combinations.

Astro: Planetary Aspect DatesIn astrology, planetary aspects refer to the angles formed between two or more planets in a horoscope or birth chart. These angles are created by the positions of the planets in the sky and are thought to represent a particular energy or influence that can impact events on Earth.
The most common planetary aspects are the conjunction (when two planets are in the same position in the zodiac), the opposition (when two planets are direct across from each other in the zodiac), the trine (when two planets are 120 degrees apart in the zodiac), and the square (when two planets are 90 degrees apart in the zodiac).
This chart overlay is a simple companion indicator that highlights aspect dates for the following oscillator:

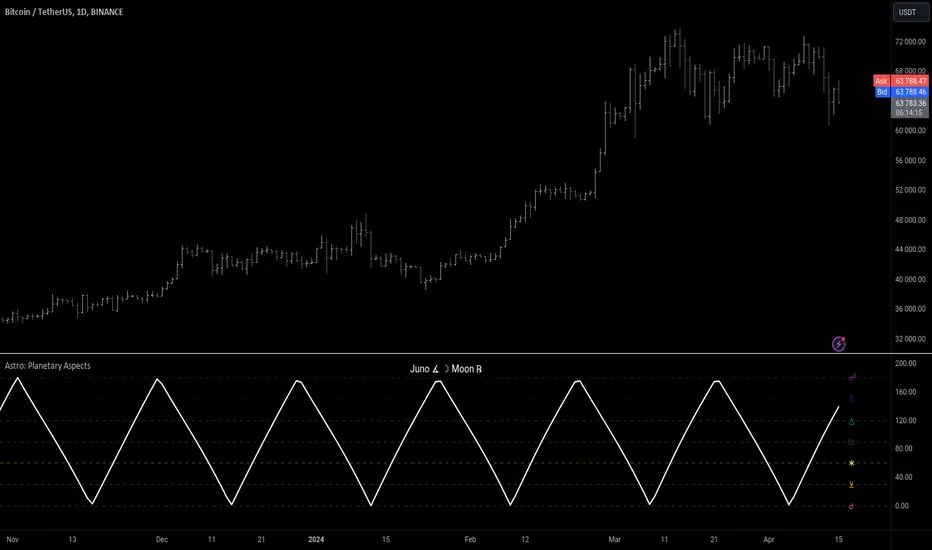
Astro: Planetary AspectsIn astrology, planetary aspects refer to the angles formed between two or more planets in a horoscope or birth chart. These angles are created by the positions of the planets in the sky and are thought to represent a particular energy or influence that can impact events on Earth.
The most common planetary aspects are the conjunction (when two planets are in the same position in the zodiac), the opposition (when two planets are direct across from each other in the zodiac), the trine (when two planets are 120 degrees apart in the zodiac), and the square (when two planets are 90 degrees apart in the zodiac).
This oscillator plots the current geocentric/heliocentric aspect for up to two planets and features a customizable precision of degree (up to +/- 15 degrees) for each aspect.
AstroLibLibrary "AstroLib", or Astro Library, is a collection of public Pinescript functions & calculations for use in astrology & astronomy indicators. Unless noted otherwise, this library was written jointly by @badsector666 and @BarefootJoey.
Library "AstroLib"
t_(txt)
Parameters:
txt (string)
JDNv2(t, withFraction)
Parameters:
t (float)
withFraction (bool)
J2K(t)
Parameters:
t (float)
J2KtoUnix(TimeInJDN)
Parameters:
TimeInJDN (float)
atan2(y, x)
Parameters:
y (float)
x (float)
DegSin(x)
Parameters:
x (float)
DegCos(x)
Parameters:
x (float)
DegTan(x)
Parameters:
x (float)
DegArcsin(x)
Parameters:
x (float)
DegArccos(x)
Parameters:
x (float)
DegArctan(x)
Parameters:
x (float)
DegAtan2(y, x)
Parameters:
y (float)
x (float)
range2pi(x)
Parameters:
x (float)
range360(x)
Parameters:
x (float)
gst(days)
Parameters:
days (float)
DegDecimal(Degrees, Minutes, Seconds)
Parameters:
Degrees (float)
Minutes (float)
Seconds (float)
Rectangular(R, theta, phi, Index)
Parameters:
R (float)
theta (float)
phi (float)
Index (float)
rLength(x, y, z)
Parameters:
x (float)
y (float)
z (float)
spherical(x, y, z, Index)
Parameters:
x (float)
y (float)
z (float)
Index (float)
obliquity(d)
Parameters:
d (float)
requatorial(x, y, z, d, Index)
Parameters:
x (float)
y (float)
z (float)
d (float)
Index (float)
recliptic(x, y, z, d, Index)
Parameters:
x (float)
y (float)
z (float)
d (float)
Index (float)
sequatorial(R, theta, phi, d, Index)
Parameters:
R (float)
theta (float)
phi (float)
d (float)
Index (float)
secliptic(R, theta, phi, d, Index)
Parameters:
R (float)
theta (float)
phi (float)
d (float)
Index (float)
precess(d1, d2, DEC, RA, Index, ddec, dra)
Parameters:
d1 (float)
d2 (float)
DEC (float)
RA (float)
Index (float)
ddec (float)
dra (float)
riset(J2000, DEC, RA, GLat, GLong, Index)
Parameters:
J2000 (float)
DEC (float)
RA (float)
GLat (float)
GLong (float)
Index (float)
ssun(d, Index)
Parameters:
d (float)
Index (float)
rsun(d, Index)
Parameters:
d (float)
Index (float)
sun(d, Index)
Parameters:
d (float)
Index (float)
SunLongitude(d, Index)
Parameters:
d (float)
Index (float)
Sunrise(J2000, GLat, GLong, Index, altitudex)
Parameters:
J2000 (float)
GLat (float)
GLong (float)
Index (float)
altitudex (float)
smoon(dx, Index)
Parameters:
dx (float)
Index (float)
rmoon(d, Index)
Parameters:
d (float)
Index (float)
tmoon(d, GLat, GLong, Index)
Parameters:
d (float)
GLat (float)
GLong (float)
Index (float)
moon(d, Index)
Parameters:
d (float)
Index (float)
Element(d, pnum)
Parameters:
d (float)
pnum (int)
kepler(m, ecc, eps)
Parameters:
m (float)
ecc (float)
eps (float)
rplanet(d, pnumber, Index)
Parameters:
d (float)
pnumber (int)
Index (float)
planet(d, pnumber, Index)
Parameters:
d (float)
pnumber (int)
Index (float)
altaz(d, DEC, RA, GLat, GLong, Index)
Parameters:
d (float)
DEC (float)
RA (float)
GLat (float)
GLong (float)
Index (float)
prise(d, P, GLat, GLong, Index)
Parameters:
d (float)
P (int)
GLat (float)
GLong (float)
Index (float)
MoonSize(d)
Parameters:
d (float)
Refraction(Temperature_C, Atmospheric_Pressure_mBar, Altitude_Deg)
Parameters:
Temperature_C (float)
Atmospheric_Pressure_mBar (float)
Altitude_Deg (float)
MoonRise(d, Longitude, Latitude, Index)
Parameters:
d (float)
Longitude (float)
Latitude (float)
Index (float)
f_to_sec(dec)
Parameters:
dec (float)
f_to_time(sec)
Parameters:
sec (float)
deg_to_time(deg)
Parameters:
deg (float)
toDMS(coordinate)
Parameters:
coordinate (float)
convertDMS(lat, lng)
Parameters:
lat (float)
lng (float)
convlatdec(deg)
Parameters:
deg (float)
PlanetName(pnum)
Parameters:
pnum (int)
PlanetNameV(pnum)
Parameters:
pnum (int)
PlanetSign(pnum)
Parameters:
pnum (int)
PlanetColor(pnum)
Parameters:
pnum (int)
zodiaccolor(deg)
Parameters:
deg (float)
degsign(deg)
Parameters:
deg (float)
degsignf(deg)
Parameters:
deg (float)
degnash(deg)
Parameters:
deg (float)
degname(deg)
Parameters:
deg (float)
retrogradesym(deg)
Parameters:
deg (float)
degaspsign(deg)
Parameters:
deg (float)
degaspname(deg)
Parameters:
deg (float)
degaspfull(deg)
Parameters:
deg (float)
degaspfullV2(deg)
Parameters:
deg (float)
degaspnameV2(deg)
Parameters:
deg (float)
degtolowest180(deg)
Parameters:
deg (float)
degaspfullapproach(deg)
Parameters:
deg (float)
virinchiaspectcol(deg, bull_col, bear_col)
Parameters:
deg (float)
bull_col (color)
bear_col (color)
virinchiaspectemo(deg, bull_emo, bear_emo)
Parameters:
deg (float)
bull_emo (string)
bear_emo (string)
aspectfastsigndeg(deg)
Parameters:
deg (float)
aspectfastfull(deg)
Parameters:
deg (float)
aspectslowfull(deg)
Parameters:
deg (float)
aspectslowsigndeg(deg)
Parameters:
deg (float)
aspectslowsign(deg)
Parameters:
deg (float)
aspectsignprecision(deg, precision)
Parameters:
deg (float)
precision (int)
aspectsignprecisionV2(deg, precision)
Parameters:
deg (float)
precision (float)
aspectsignprecisionV2ext(deg, precision)
Parameters:
deg (float)
precision (float)
IPaspectsignprecision(planet1, planet2, precision)
Parameters:
planet1 (float)
planet2 (float)
precision (float)
IPaspectsignprecisionFull(planet1, planet2, precision)
Parameters:
planet1 (float)
planet2 (float)
precision (float)
IPaspectlineprecision(planet1, planet2, precision, style, width)
Parameters:
planet1 (float)
planet2 (float)
precision (float)
style (string)
width (int)
rDeg(deg)
Parameters:
deg (float)
AngToCirc(angle)
Parameters:
angle (float)
AngToCirc180(angle)
Parameters:
angle (float)
sidereal(deg, sidereal)
Parameters:
deg (float)
sidereal (bool)
J2000(JDN)
Parameters:
JDN (float)
JDN(t, d, tz)
Parameters:
t (float)
d (float)
tz (float)
getsun(index, day, dayr, latitude, longitude, tz)
Parameters:
index (int)
day (float)
dayr (float)
latitude (float)
longitude (float)
tz (float)
getmoon(index, day, dayr, latitude, longitude)
Parameters:
index (int)
day (float)
dayr (float)
latitude (float)
longitude (float)
getplanet(planet, index, day, dayr, latitude, longitude, tz)
Parameters:
planet (int)
index (int)
day (float)
dayr (float)
latitude (float)
longitude (float)
tz (float)

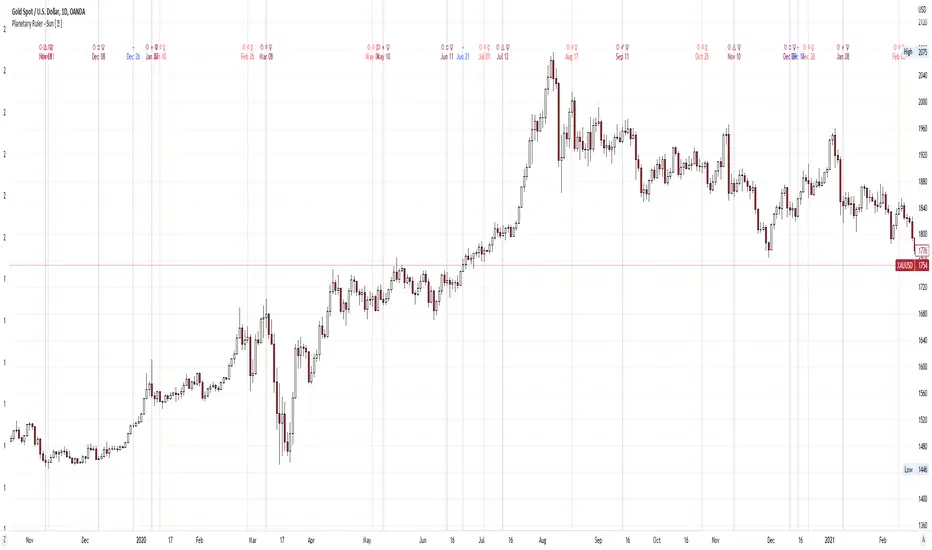
Planetary Ruler - Sun Hi Traders,
The objectives of this script are:
1. you can see the planetary schedule in certain periods (you can double check it in horoscopes.astro-seek.com)
2. you can see the correlation between planetary aspects and market reaction (is it turning or is it a swinghigh/ low? )
Those Dates are the planetary aspect happened (history & future), so when the planetary aspects arrived, we can forecast the turning or swinghigh/low in the market (cryptos, stocks, commoditties & indices)
in history we can observe what happened in stocks market if Sun Trine Saturn (example), if it made a turning or swinghigh/low,
and if the same planetary aspects happen again (in this case is Sun Trine Saturn), we can expect or forecast the turning or swinghigh/low will be happen again (history repeat itself).
Those lines are just a simply vertical lines that can help us backtesting easily, hopefully we can take profit from this planetary aspects..
Here is a glimpse of Financial Astrology..
FINANCIAL ASTROLOGY
Astrology is the study of the relationship between movements and interactions of the planets and human behaviour.
Financial Astrology is the study of the link between the movements and interactions of the planets with market behaviour
The alignment of planetary energy tends to provide a push or a force in one direction or another, can be positive or negative energies.
In financial astrology, each planet has a specific meaning.
Listed below is a general, simplified guide to how planets seem to affect current market movements, or what’s signified in a nation’s economy (after noting the aspects involved). In parentheses are the relevant industries to which each planetary energy belongs or ‘rules’.
Sun: Confidence, energy, often represents the business itself or its figurehead (Precious Metals speculation/stock market).
Mercury: Speed, movement and the principle of trading itself (telecommunications, the Media, publishing, travel and transport in general, footwear).
Venus: Small growth – traditionally the ‘minor benefic’ (clothing and fashion, the cosmetic industry, places of leisure/entertainment).
Mars: Energy, activity, speed, competition – traditionally the ‘minor malefic’ (sport, the military, weapons and armaments, steel).
Jupiter: Growth, expansion, high confidence (but also over-reaching ) success and speculation – traditionally the ‘Greater Benefic’ (‘Bull Markets’, banking, brokering, gambling institutions legal issues/law courts).consumer goods
Saturn: Stability, limits, downturns, pressure, low confidence, impediments, contraction – traditionally the ‘Greater Malefic’ (‘Bear Markets’, agriculture, construction, building and real estate).
Uranus: Change and volatility (the WorldWideWeb, inventions, digital technology, computing and innovation, the aeronautics industry; exploration/discovery, electricity, science and biotechnology).
Neptune: Uncertainty, often a negative for markets: unrealistic expectation (the advertising industry, fashion/glamour, shipping and maritime matters, tobacco/ alcohol, minerals, oil , medicine).
Pluto: Great power and its use, manipulation, drastic change – can represent Plutocracies, big business and monopolies (stocks and bonds, mining, nuclear industry, international crime and the Underworld).
This Planetary Aspects & Transits script (separately) only include:
1. Sun
2. Mercury
3. Venus
4. Mars
5. Jupiter
6. Saturn
7. Uranus
8. Neptune
9. Pluto
Aspects:
1. Conjuntion
2. Sextile
3. Square
4. Trine
5. Opposition
you can combine using 1 or more planets and aspects to get the best swinghigh/low or turning, due to time lag & time delay, +/- 1 day is stil valid for the turning or swinghigh/low
here are some examples of Planetary Ruler:
Planetary Ruler - Sun
DJI
XAUUSD
Planetary Ruler - Mercury
AAPL
FDX
Planetary Ruler - Venus
UA
PVH
Planetary Ruler - Mars
STLD
MT
Planetary Ruler - Jupiter
BTI
WMT
PG
Planetary Ruler - Saturn
FMC
MLM
Planetary Ruler - Uranus
NEE
VST
Planetary Ruler - Neptune
MDT
HUN
Planetary Ruler - Pluto
NIFTY50
BBCA
PS:
when you subscribe, you will get:
1. Planetary Aspects & Transits (9 Planets)
2. Retrogrades
3. Moon Phase, Moon Eclipse & 4 seasons
4. Easy Aspects (Trine & Sextile)
5. Hard Aspects (Opposition, Square & Conjuntion)
6. Gann Seasoanal Dates
7. Sun Ingress Zodiac
9. The symbols & dates will keep updated in the future
Sun Ingress ZodiacHi Traders,
Astrological signs of the tropical zodiac remain fixed relative to seasonal markers, such as the equinox and solstice points on the sky’s dome.
The zodiac used for the calculations does not correspond to the astronomical zodiac, but to 12 zones of 30 degrees along the ecliptic, measured from the position of the Sun at the spring equinox. The ecliptic is the plane of the Earth’s orbit around the Sun.
This script allows you see how Sun Ingress Zodiac can affect the Crypto, Stock, Indices & Commodity market.
The objectives of this script are:
1. you can see the Zodiac schedules in certain periods (earthsky.org)
2. you can see the correlation between Sun Ingress Zodiac and market reaction (is it turning or is it a swing high/ low? )
Those Dates are the Zodiac schedule (history & future), so when the Zodiac dates arrived, we can forecast the turning or swing high/low in the market (crypto, stocks, commodities & indices), the turning or swing high/low is +/- 1 day.
Those lines are just a simply vertical lines that can help us backtesting easily, hopefully we can take profit from this..
Here are some examples of the specific Zodiac affect:
Sun Ingress Aries
Sun Ingress Taurus
Sun Ingress Gemini
Sun Ingress Cancer
Sun Ingress Leo
Sun Ingress Virgo
Sun Ingress Libra
Sun Ingress Scorpio
Sun Ingress Sagittarius
Sun Ingress Capricorn
Sun Ingress Aquarius
Sun Ingress Pisces
PS:
when you subscribe, you will get:
1. Planetary Aspects & Transits (9 Planetary Ruler)
2. Retrogrades
3. Moon Phase, Moon Eclipse & 4 seasons
4. Easy Aspects (Trine & Sextile)
5. Hard Aspects (Opposition, Square & Conjunction)
6. Gann Seasonal Dates
7. Sun Ingress Zodiac

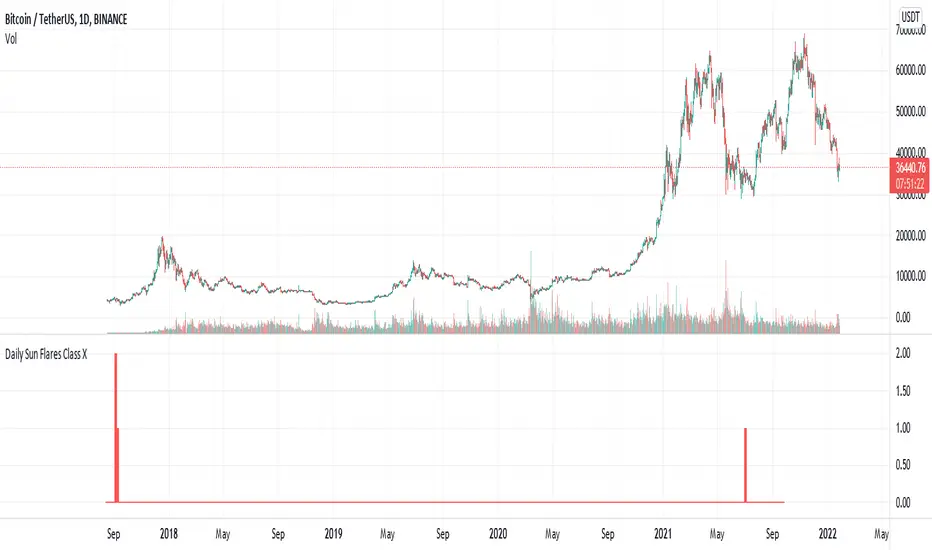
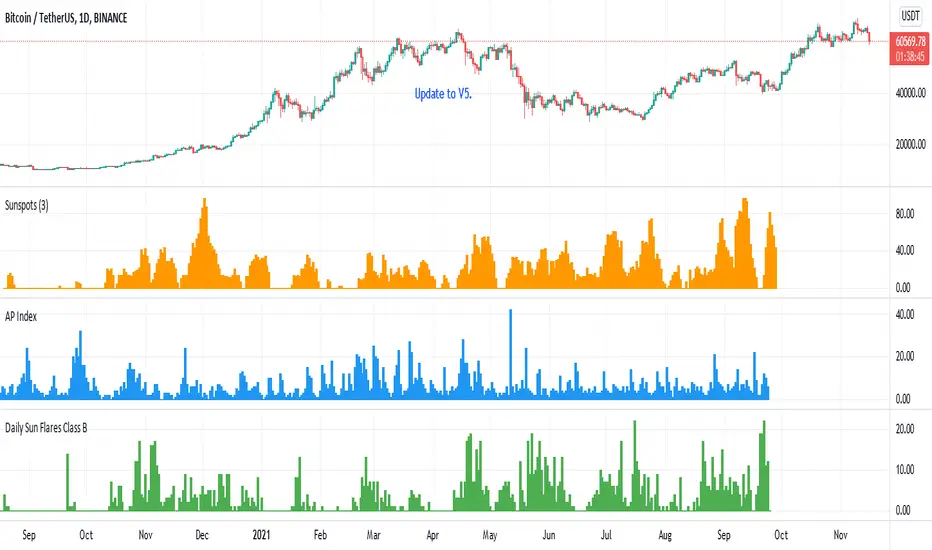
Daily Sun Flares Class XThe classification system for solar flares uses the letters A, B, C, M or X, according to the peak flux as measured at the Earth by the GOES spacecraft.
These are daily Class X sun flares. The data was created by counting daily flares of this class based on the peak time of the flare.
2015-01-01 until 2021-08-25
Daily Sun Flares Class MThe classification system for solar flares uses the letters A, B, C, M or X, according to the peak flux as measured at the Earth by the GOES spacecraft.
These are daily Class M sun flares. The data was created by counting daily flares of this class based on the peak time of the flare.

Daily Sun Flares Class CThe classification system for solar flares uses the letters A, B, C, M or X, according to the peak flux as measured at the Earth by the GOES spacecraft.
These are daily Class C sun flares. The data was created by counting daily flares of this class based on the peak time of the flare.

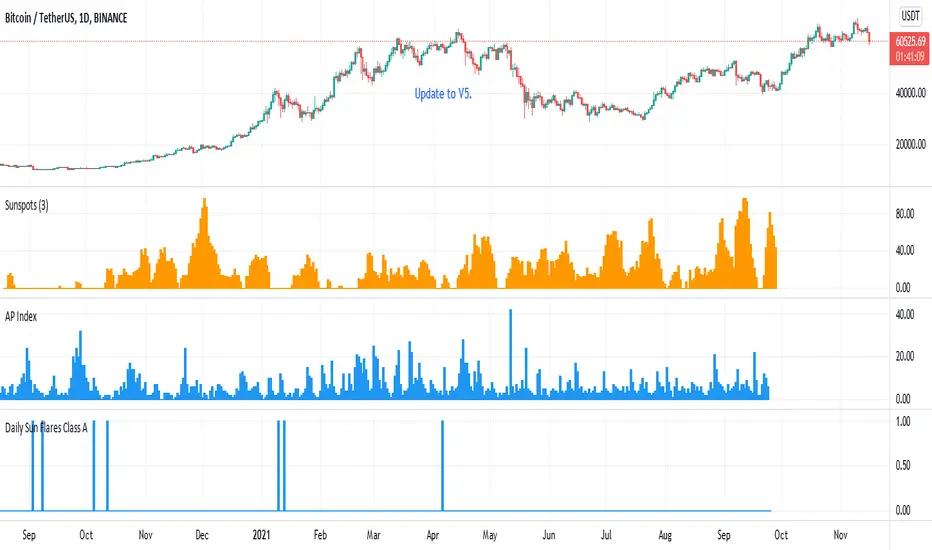
Daily Sun Flares Class AThe classification system for solar flares uses the letters A, B, C, M or X, according to the peak flux as measured at the Earth by the GOES spacecraft.
These are daily Class A sun flares. The data was created by counting daily flares of this class based on the peak time of the flare.
2015-01-01 until 2021-08-25
Daily Sun Flares Class BThe classification system for solar flares uses the letters A, B, C, M or X, according to the peak flux as measured at the Earth by the GOES spacecraft.
These are daily Class B sun flares. The data was created by counting daily flares of this class based on the peak time of the flare.
2015-01-01 until 2021-08-25
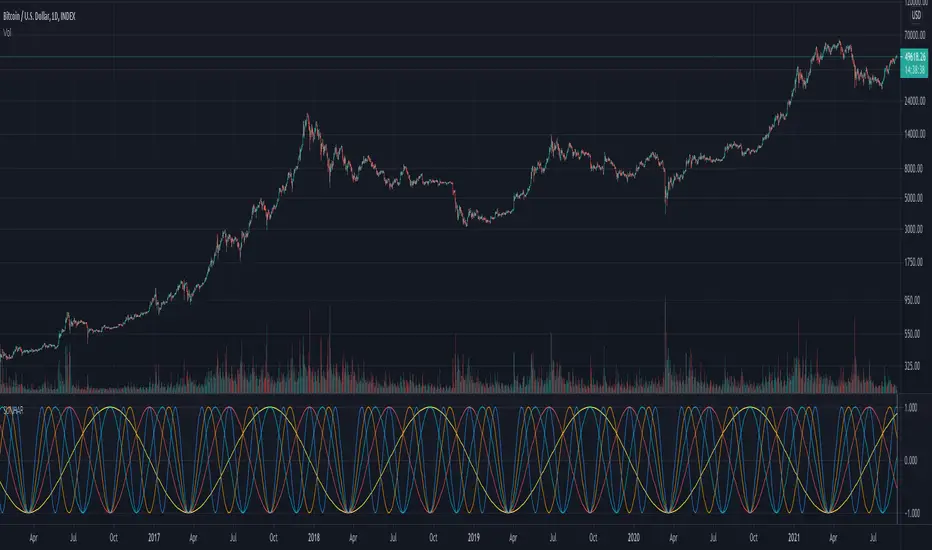
Financial Astrology Sun HarmonicsSun Harmonics indicator represent the tropical zodiac energy forces that develop through the course of Sun in the zodiac wheel. The waves indicates the strength of cardinal energy (initiator) and this forces seems to correlate well with the most relevant pivot points. Determining how this forces act to produce bearish or bullish effect is the financial astrologers researchers homework. This time I'm not going to disclose my conclusions except for the serious researchers that leave a comment with their own observations in regard to this forces.
Note: The Sun Harmonics indicator is based on an ephemeris array that covers years 2010 to 2030, prior or after this years the data is not available, this daily ephemeris are based on UTC time so in order to align properly with the price bars times you should set UTC as your chart timezone.
Financial Astrology Sun SpeedSun speed from geocentric view represents the apparent daily move (in degrees) of the Sun through the Zodiac wheel, we know well that is the Earth which is moving and this Sun dance through the tropical Zodiac is just apparent. The maximum speed 1.02 degrees per day is reached at the perihelion (closest to Sun) which occurs in January at the zodiac sign of Capricorn, the minimum speed is 0.97 at aphelion (further to Sun) and occurs at July at the sign of Cancer. The speed is inversely correlated to the Sun declination so at the maximum value in North declination we get the minimum value in speed and viceversa.
Is interesting to note that at the speed maxima, minima or exact average (that coincide with the start of the different Earth seasons) we can identify some of the most relevant top and bottoms in BTCUSD. Is said that "gold" metal is ruled by the Sun so would be great to analyse if there is a relevant correlation of top and bottoms in GLD market with in speed extreme value, I will leave this as homework to some of the amazing astro traders that do research with Trading View charts.
Note: The Sun speed indicator is based on an ephemeris array that covers years 2010 to 2030, prior or after this years the speed is not available, this daily ephemeris are based on UTC time so in order to align properly with the price bars times you should set UTC as your chart timezone.

Financial Astrology Sun DeclinationExtreme Sun declinations occurs at the solstices of summer and fall which correspond to the entry of Sun into Cancer and Capricorn respectively. At this extreme points we can observe that many markets tend to produce corrections. Is very interesting to see that when Sun reach the lowest and highest declination extremes. this events correlates very close to price corrections, is not an infalible rule, don't repeat for all observations but in many occurrences during all the historical data that we have of BTCUSD since 2010 have happened.
Is very likely that this same pattern repeats in others markets so will be great to get the participation of other financial astrologers that could research this cycle and share feedback with us.
Note: The Sun declination indicator is based on an ephemeris array that covers years 2010 to 2030, prior or after this years the declination is not available, this daily ephemeris are based on UTC time so in order to align properly with the price bars times you should set UTC as your chart reference timezone.
