Supply/Demand Zones (Expo)"It hasn't been easier to display, in real-time, one of the most important and useful technical analysis, namely supply/demand zones. This algorithm analyzes the market structure in real-time and maps out key supply and demand zones for you. - "
Supply/Demand Zones (Expo) analyze the market structure in real-time and maps out key supply and demand zones. The user gets an instant understanding of the current market structure.
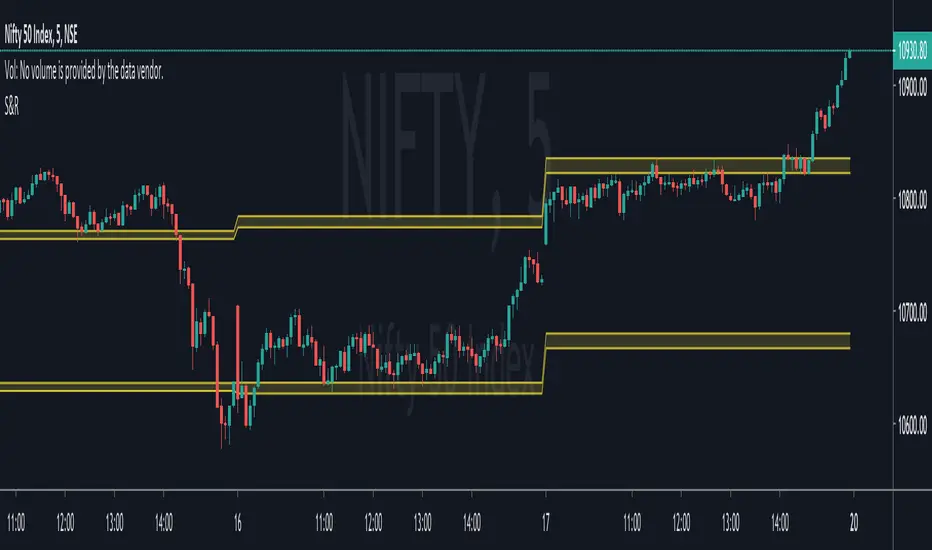
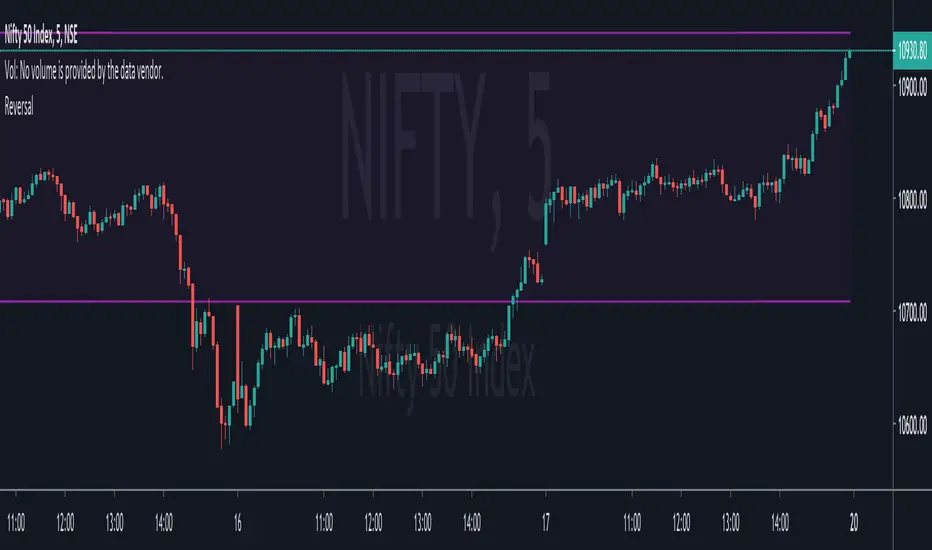
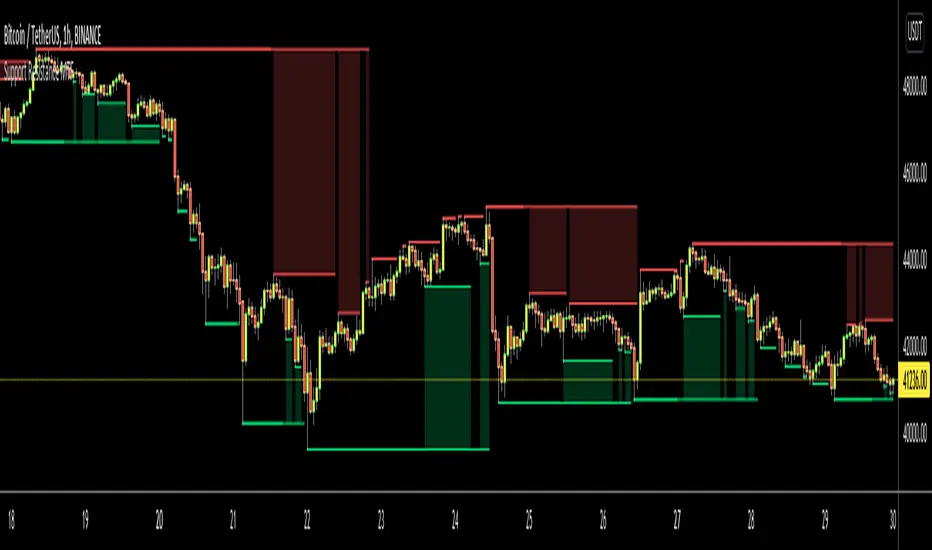
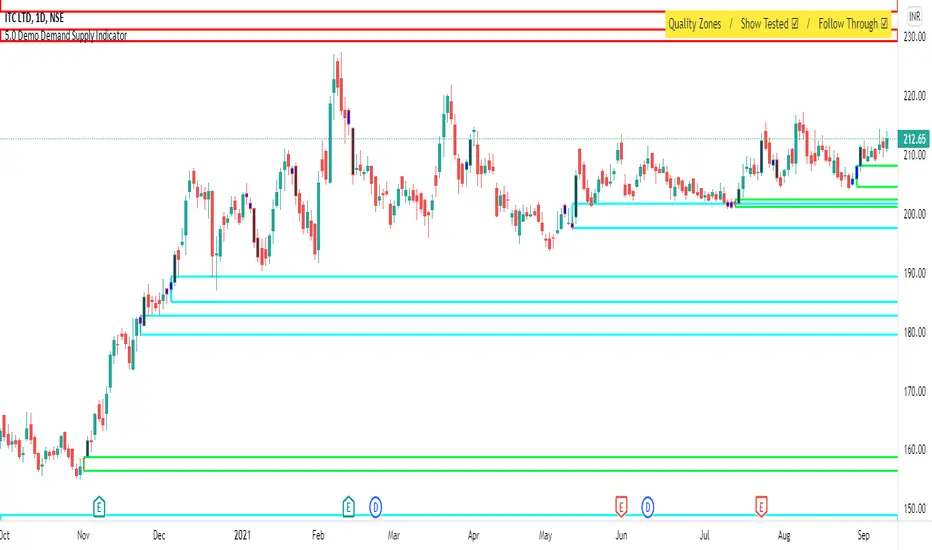
The indicator identifies zones where demand overwhelms supply which is driving the price up, or where supply overwhelms demand which is driving the price down. It makes sense to buy at a demand zone and to sell at a supply zone, but keep in mind that fresh zones are more effective than retested ones. They can be used as entry zones for a continuing trend or as reversal zones for a changing trend.
--> The indicator displays 3 zones, which one of them (the blue one) can be customized. Labels with price levels can be enabled.
--> The indicator can be used standalone or as a part of your current trading strategy.
Real-time
No repainting
Works on any market
HOW TO USE
1. Use the indicator to identify key supply and demand zones.
2. Use the indicator to confirm the existence, or a continuation, of a trend or a trend reversal.
3. Use the indicator to identify potential breakouts.
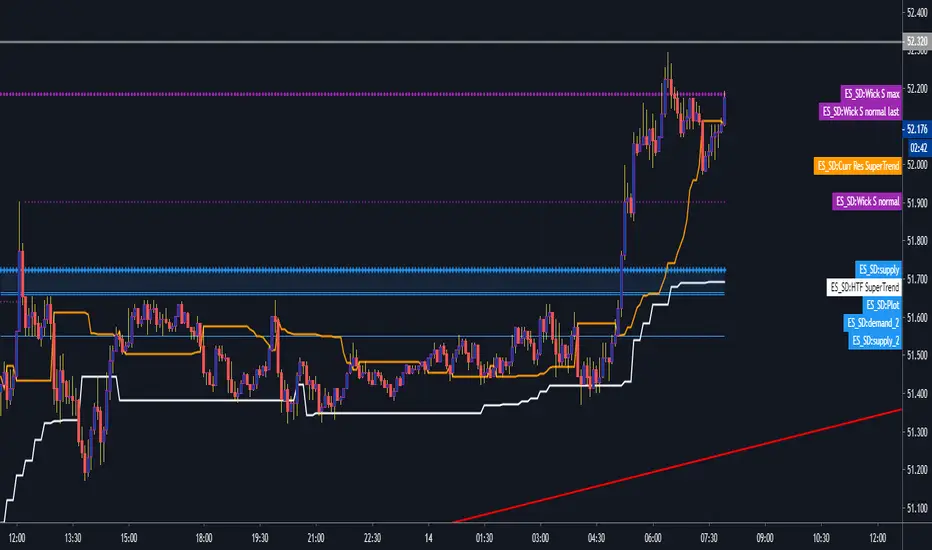
INDICATOR IN ACTION
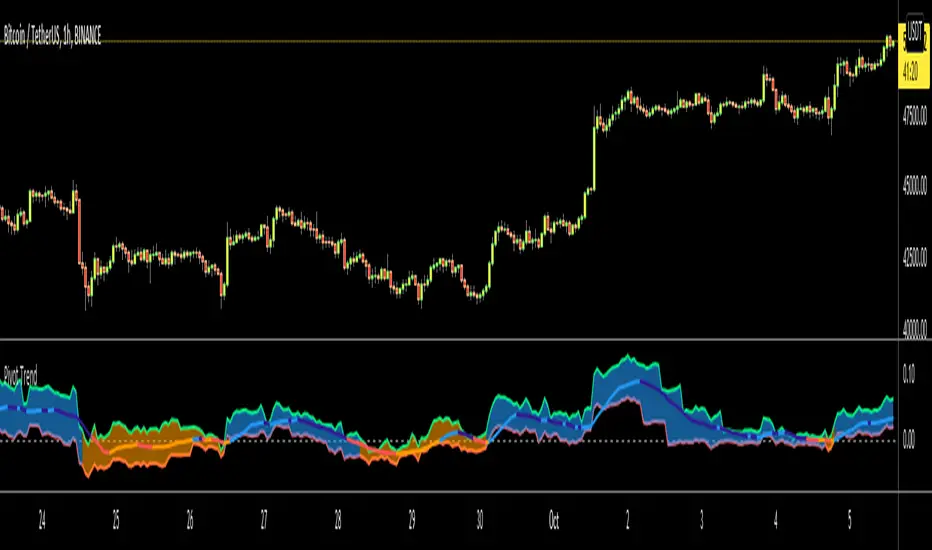
1-hour chart
I hope you find this indicator useful , and please comment or contact me if you like the script or have any questions/suggestions for future improvements. Thanks!
I will continually work on this indicator, so please share your experience and feedback as it will enable me to make even better improvements. Thanks to everyone that has already contacted me regarding my scripts. Your feedback is valuable for future developments!
ACCESS THE INDICATOR
• Contact me on TradingView or use the links below
-----------------
Disclaimer
Copyright by Zeiierman.
The information contained in my scripts/indicators/ideas does not constitute financial advice or a solicitation to buy or sell any securities of any type. I will not accept liability for any loss or damage, including without limitation any loss of profit, which may arise directly or indirectly from the use of or reliance on such information.
All investments involve risk, and the past performance of a security, industry, sector, market, financial product, trading strategy, or individual’s trading does not guarantee future results or returns. Investors are fully responsible for any investment decisions they make. Such decisions should be based solely on an evaluation of their financial circumstances, investment objectives, risk tolerance, and liquidity needs.
My scripts/indicators/ideas are only for educational purposes!
Penunjuk Pine Script®