Unraided Liquidity and S/R PivotsThis indicator is designed to show key pivot points, also known as levels, which could provide good trade entries.
Utilising liquidity concepts, untested pivot levels can be a good place to enter a trade after the pivot is tested, liquidity is taken and the direction reverses.
Alternatively, utilising the option of viewing already tested levels, you can easily see the key support and resistance areas that price is likely to have a strong reaction to, whether it wants to go toward or bounce away from these levels.
The indicator does not give buy and sell signals, it is up to you to use the levels to form your trading plan.
Oorah.
Support

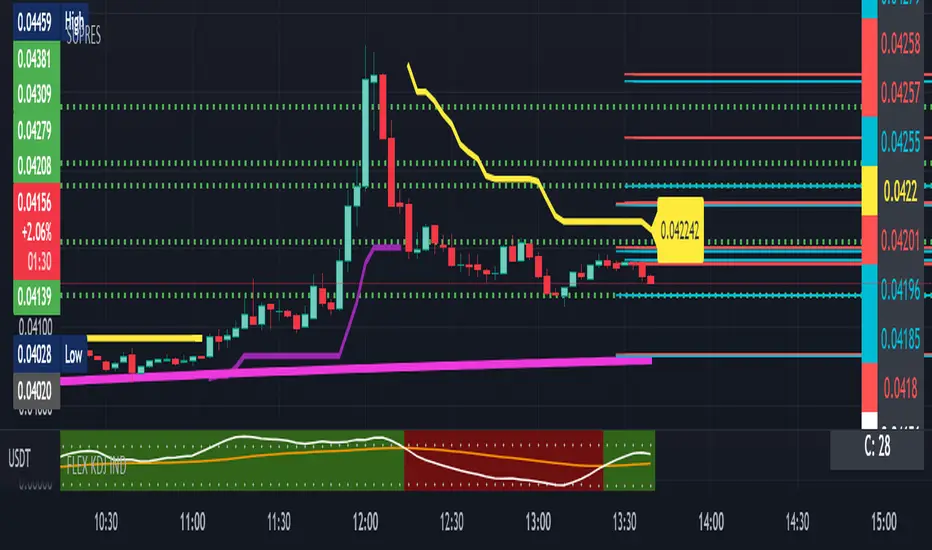
SUPRESHi Dears!
I hope that you enjoyed my "FLEX KDJ IND" till today!
Here, I want to publish one of my other golden indicators for you!
Contents:
+ SUPRES
+ SUPERTREND
+ T.O Line
- SUPRES (SUPPORT/RESISTANCE) is sensitive to trading volumes and with "BACHWARD" you can adjust the length of previous indices in investigation and "MEMORY" is an argument for calling maximum lines that have to be kept for "SUPPORT" and "RESIST".
- SUPERTREND is the normal prepared indicator which is defined in "TRADING VIEW"
-T.O is my suggestion instead of "EMA" to check the phase of session.
I hope that you enjoy this Indicator, please do not forgot to "Warm-It-UP"!
Happy trading,
Shakib
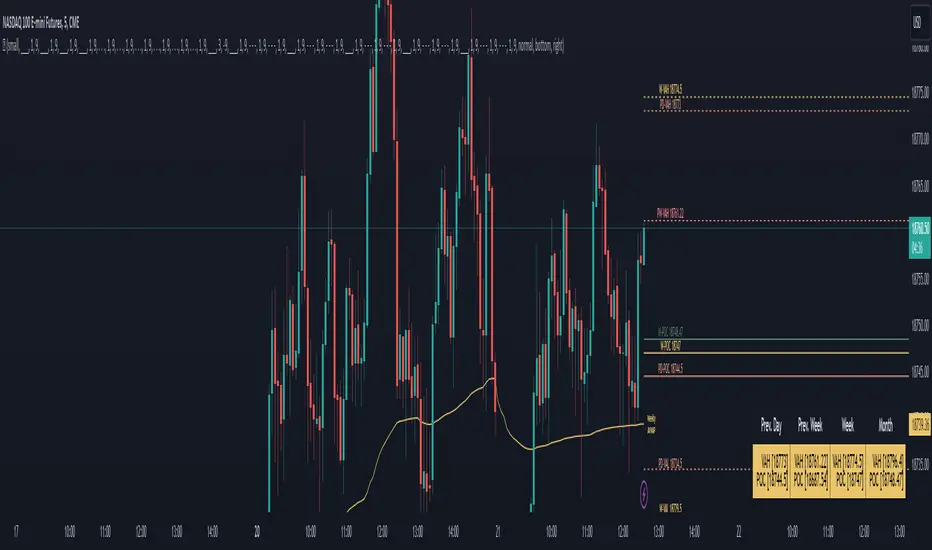
LevelsThe Levels indicator automatically draws important market pivots based on multiple timeframe value zones and pivotal trading areas. This information is displayed in front of the price, to keep things out of the way of your price action chart. All of these levels are fully customizable, for visual tranquility, and all values are available to set alerts on. Last but not least is an easy-to-read dialogue box so you know exactly where you are in the auction at a quick glance to save you time while analyzing charts.
Levels included:
Value Low (Day, Week, Month)
Value High (Day, Week, Month)
Point of Control (Day, Week, Month)
VPOCs (Daily)
Highs and Lows (Week, Month)
Average range zones( Day, Week, Month)
Multiple Daily SMA EMA on Intra 1min 5min 15min ChartsThis script is helping you auto plot daily SMA EMA and extensions when you are looking at intraday charts. The script is customizable where user can select which ever levels they are interested in viewing. These daily lines act as support and resistance levels for intraday
The green line represent 20 EMA Daily
The yellow line represent 50 SMA Daily
The olive line represent 200 SMA Daily
The red line is upper Bollinger Band Daily
The black line is lower Bollinger Band Daily
To help you understand which lines are what I would recommend you add this indicator and select "D" timeframe and then see which lines you would like to view for your 1min chart or 5 min chart you can customize from the setting options which plot color you would like to view.

Shotoki Pivot Resistance SupportHi,
here is a script I wrote based on Pivot points. It detects HH, HL, LL, LH
the yellow resistances/supports are from a higher timeframe
the fuchsia ones are supports for the current timeframe, it resets when the past Low is too old or it detects a new one
the blue ones are resistances for the current timeframe, it resets when the past High is too old or it detects a new one
Shotoki

Pivot-Based Channels & Bands [Misu]█ This Indicator is based on Pivot detection to show bands and channels.
The pivot price is similar to a resistance or support level. If the pivot level is breached, the price should continue in that direction. Or the price could reverse at or near this level.
█ Usages:
Use channels as a support & resistance zone.
Use bands as a support & resistance zone. It is also very powerfull to use it as a breakout.
Use mid bands & mid channels as a trend direction or trade filter as a more usual moving average.
█ Parameters:
Show Pivot Bands: show bands.
Show Pivot Mid Band: show mid bands.
Show Pivot Channels: show channels.
Show Pivot Mid Channel: show mid channels.
Deviation: deviation used to calculate pivot points.
Depth: depth used to calculate pivot points.

Inside Bar SetupScript Details
- This script plots Inside Bar for given day in selected time-frame (applicable only for Timeframes < Day)
- Basis plotted inside bar, relevant targets are marked on the chart
- Targets can be customised from script settings. Example, if range of mother candle is 10 points, then T1 is 10 * x above/below mother candle and T2 is 10 * y above/below mother candle. This x & y are configured via script settings
How to use this script ?
- This script works well on 10-15 mins timeframe for stocks, 15/30 mins timeframe for nifty index and 30/60 mins time frame for bank nifty index
- If mother candle high is broken, take long trade with SL of mother candle low and if low is broken, take short trade with SL of mother candle high
Remember:
1. Above logic is to be combined with support/resistances i.e. price action. This script is an add-on to price action analysis giving you more conviction.
2. If range of mother candle is very high, it is recommended to avoid the trade.
3. Basis inside bar formed on higher time frame, take trade on basis of lower time frame i.e if inside bar is formed on 60 mins, take trade on the basis of 10-15 mins time frame
Example:
1. As seen in the chart, Nifty is near it's resistance and we are seeing Inside Bar being formed, In such scenario, even if High of Mother Candle is broken, we should be more interested to short as we are near resistance and probability of getting our targets in long side is less.
2. So, if I see breakdown of mother candle i.e. price going below low of mother candle, we will short with SL of high of mother candle.
3. As seen in the chart, both the targets are achieved.
Additional Info:
1. Targets on Long/Short Side can be configured via settings. For indices 1 times/1.5 times the range works well.
2. This script plots targets basis the first inside bar formed in the day for selected time frame.
3. Inside bars formed through out the day are coloured separately but lines are plotted only on the basis of 1st formed inside bar as this strategy works well for the first formed inside bar)
4. Don't forget to check volume in case of breakout/breakdown.
Note:
1. Mother Candle - First Candle of Inside Bar
2. Child Candle - Candle formed inside Mother Candle (Second Candle of Inside Bar)
Happy Trading :)

Fibonacci + Support/Resistant + Trendline (Price action)This is opening source code version: Fibonacci + Support/Resistant + Trendline (One of Advanced Price action Analysis).
How it works:
It find entry Long/Short by combining: Fibonacci + Support/Resistant + Trendline
1. Find Impulse wave:
To findind Impulse wave, It uses Pivot High/Low to find Impulse wave. In case find entry Long, If having Pivot High higher Pivot High before, it will draw an Impulse wave.
2. Find entry at Fibonacci levels:
Draw Fibonacci fibonacci retracement from Pivot Low to Pivot High. A Fibonacci retracement forecast is created by taking two extreme points on a chart and dividing the vertical distance by important Fibonacci ratios. 0% is considered to be the start of the retracement, while 100% is a complete reversal to the original price before the move. Horizontal lines are drawn in the chart for these price levels to provide support and resistance levels. Common levels are 23.6%, 38.2%, 50%, and 61.8%
3. Find entry at Support/Resistant Zone:
Support/Resistant Zone drawed from Pivot High before, which price just breaken and return to retest.
4. Find entry at Trendline:
Trendline drawed from Pivot High/Low before, which price just breaken and return to retest.
How do use it:
+ You can customize the thickness of the lines.
+ You can set up an alert when the price touchs important areas.

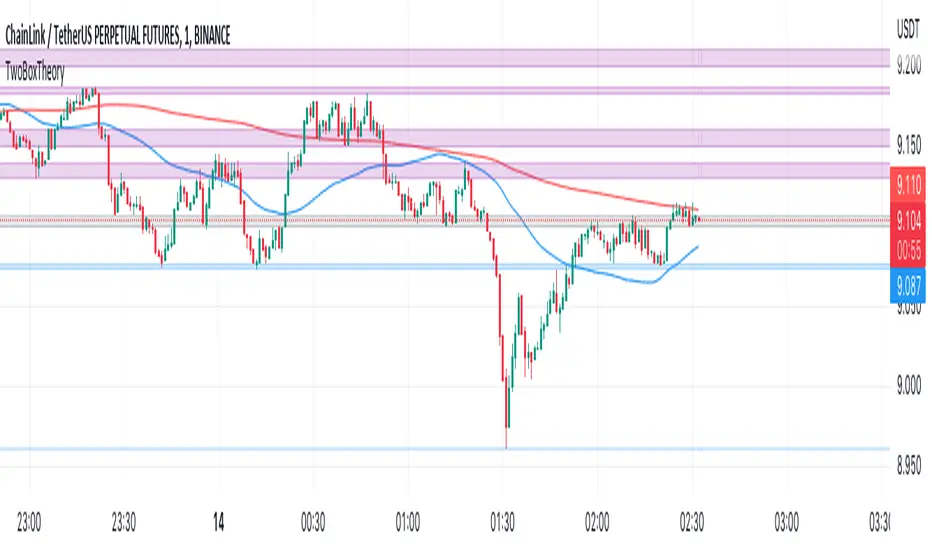
Two Box TheoryA channel is where the price action travels between two rectangular boxes. The Purple box line is treated as resistance and the Blue box line is treated as support.
Two Box Theory is a TradingView TM indicator that automatically locates and prints key support and resistance levels.
Its responsibility lies in its capacity to offer real-time visualisation to support your trade.
It is a flexible indicator that can be used for short or long time frames and has a precision of 8 decimal points, making it appropriate for all types of markets.
You can choose to get alerts immediately because each condition has its own set of alerts.
Two Box Theory has been tried, true, and tested for more than a year and has already earned the faith of those who have used it.
Two Box Theory has what it takes to take your trading to the next level, whether it's used as a stand-alone method or as an addition to your current approach.
Read the description to better understand the functions of this indicator.
1- It will automatically find Pivot Points to determine support and resistance by calculating extensive amount of data.
2- When it calculates new Pivot Points it will remove previous ones and the support/resistance channels will be updated.
3- For every upcoming Pivot Point it scans all previous Pivot Points in its channel horizontally.
4- It will show a different box (grey) when price action goes sideways. This is when the coin is in a no trade zone.
5- After breaking that level(grey box) upwards, it will change colour of its box to make support channel.
6- It will also alert you when the support or resistance breaks, you can set the alerts in the settings.
7- It also includes two Simple Moving Averages for further confirmations.
Here are some screenshots to understand how it functions:
The Auto-Support/Resistance feature in this indicator uses Artificial Intelligence (AI) to automatically plot the support/resistance levels and show them based on the strength of different levels to perform analysis.
AI is used to detect the support/resistance levels and rated based on the following factors:
i- Number of touches
ii- Length of the line
iii- Recency of the line
iv- Violations of the line
You can manage risk according to the support and resistance to set Stop-Loss and the potential take-profit based on the nearest support/resistance levels
Stop loss and take profit levels are made easy on this indicator and if you follow the instructions properly, your accuracy rate should lie between 85-95%
For example:
Support indications:
Resistance Indications and trading technique:
Resistance convert into support:
Volume Histogram [SpiritualHealer117]This indicator is a histogram produced with Pinescript's boxes and is helpful for spotting support, resistance, and key levels. The indicator shows the volume executed at each source price over a customizable time period. The "Key Level" in this indicator is the price at which the most volume was executed, and the "Major Levels" are levels where volume was over a percentile threshold, which you can customize in settings. Feel free to give any feedback on the indicator or make a copy for yourself!

Ultimate RSI - Divergence + S/R + Reverse RSIThis is a modification of the TradingView RSI with some of my favourite RSI features added.
This includes Divergence indicators. EMA with colour change on cross, Support and resistance lines and reverse RSI.
A reverse calc has also been added. This will allow you to input 3 different RSI values for a price prediction. This is good to use with the support and resistance lines and can give you key areas on the chart where the price may bounce/reject.
All colours and modifications can be turned on/off.
Enjoy! :)

Copy/Paste LevelsCopy/Paste Levels allows levels to be pasted onto your chart from a properly formatted source.
This tool streamlines the process of adding lines to your chart, and sharing lines from your chart.
More than one ticker at a time!
This indicator will only draw lines on charts it has values for!
This means you can input levels for every ticker you need all at once, one time, and only be displayed the levels for the current chart you are looking at. When you switch tickers, the levels for that ticker will display. (Assuming you have levels entered for that ticker)
The formatting is as follows:
Ticker,Color,Style,Width,Lvl1,Lvl2,Lvl3;
Ticker - Any ticker on Tradingview can be used in the field
Color - Available colors are: Red,Orange,Yellow,Green,Blue,Purple,White,Black,Gray
Style - Available styles are: Solid,Dashed,Dotted
Width - This can be any negative integer, ex.(-1,-2,-3,-4,-5)
Lvls - These can be any positive number (decimals allowed)
Semi-Colons separate sections, each section contains enough information to create at least 1 line.
Each additional level added within the same section will have the same styling parameters as the other levels in the section.
Example:
2 solid lines colored red with a thickness of 2 on QQQ, 1 at $300 and 1 at $400.
QQQ,RED,SOLID,-2,300,400;
IMPORTANT MUST READ!!!
Remember to not include any spaces between commas and the entries in each field!
ex. ; QQQ, red, dotted, -1, 325; <- Wrong
ex. ;QQQ,red,dotted,-1,325;)<- Right
However,
All fields must be filled out, to use default values in the fields, insert a space between the commas.
ex. ;QQQ,red,dotted,,325; <- Wrong
ex. ;QQQ,red,dotted, ,325; <- Right
While spaces can not be included line breaks can!
I recommend for easier typing and viewing to include a line break for each new line (if changing styling or ticker)
Example:
2 solid lines, one red at $300, one green at $400, both default width. Written in a single line AND using multiple lines, both give the same output.
QQQ,red,solid, ,300;QQQ,green,solid, ,400;
or
QQQ,red,solid, ,300;
QQQ,green,solid, ,400;
In this following screenshot you can see more examples of different formatting variations.
The textbox contains exactly what is pasted into the settings input box.
As you can see, capitalization does not matter.
Default Values:
Color = optimal contrast color, If this field is filled in with a space it will display the optimal contrast color of the users background.
Style = solid
Width = -1
More Examples:
Multi-Ticker: drawing 3 lines at $300, all default values, on 3 different tickers
SPY, , , ,300;QQQ, , , ,300;AAPL, , , ,300
or
SPY, , , ,300;
QQQ, , , ,300;
AAPL, , , ,300
Multiple levels: There is no limit* to the number of levels that can be included within 1 section.
* only TV default line limit per indicator (500)
This will be 4 lines all with the same styling at different values on 2 separate tickers.
SPY,BLUE,SOLID,-2,100,200,300,400;QQQ,BLUE,SOLID,-2,100,200,300,400
or
SPY,BLUE,SOLID,-2,100,200,300,400;
QQQ,BLUE,SOLID,-2,100,200,300,400
Semi-colons must separate sections, but are not required at the beginning or end, it makes no difference if they are or are not added.
SPY,BLUE,SOLID,-2,100,200,300,400;
QQQ,BLUE,SOLID,-2,100,200,300,400
==
SPY,BLUE,SOLID,-2,100,200,300,400;
QQQ,BLUE,SOLID,-2,100,200,300,400;
==
;SPY,BLUE,SOLID,-2,100,200,300,400;
QQQ,BLUE,SOLID,-2,100,200,300,400;
All the above output the same results.
Hope this is helpful for people,
Enjoy!

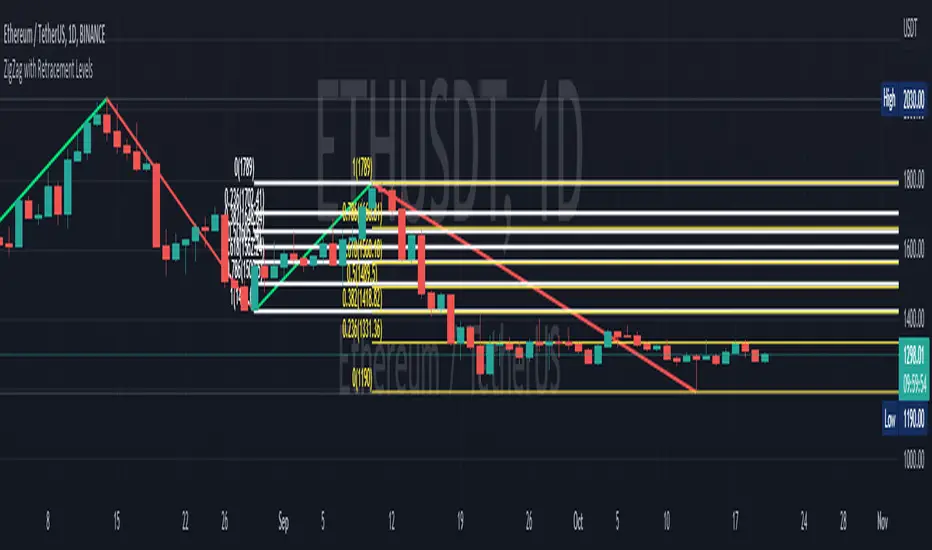
ZigZag with Retracement LevelsThis is a modification to "ZigZag with Fibonacci Levels" by LonesomeTheBlue.
By default, the script finds the ZigZag, draws Fibonacci lines and labels accordinly. ZigZag period can be set.
The modification to the original script provides the following features:
1) Option for user to customize retracement levels, if they don't want to use Fibonacci levels. This allows for different strategy adoptions.
2) Option to show Fibonacci or custom retracement levels based on the latest pivot (including the current bar)
For example:
Enjoy and happy trading~!!
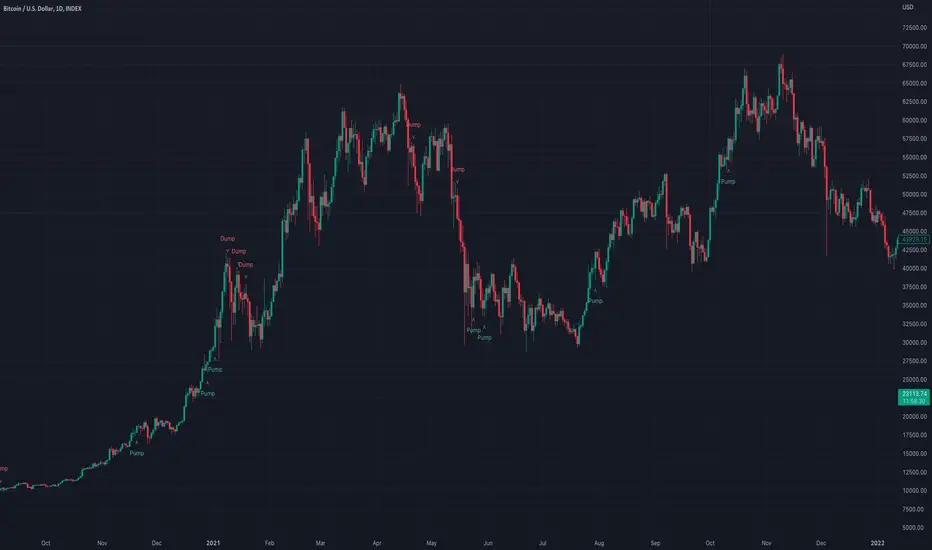
Pump and DumpThis indicator picks ups a particular breed of pump and dump. It requires a lot of setup for a chart to pump or dump and it typically involves breaking the parallel channel of current price action. In this case the script is looking for rare moments support and resistance is pushed to its extreme allowing price action to easily setup this move as it ducks through a very strong dynamic support and resistance band. Sensitivity can be adjusted in the settings. For slower charts like weekly or monthly you can push it all the way to extreme. For faster charts like 4hr and hourly slow it down. It's a good idea to tune it to whatever chart and timeframe you are looking at.
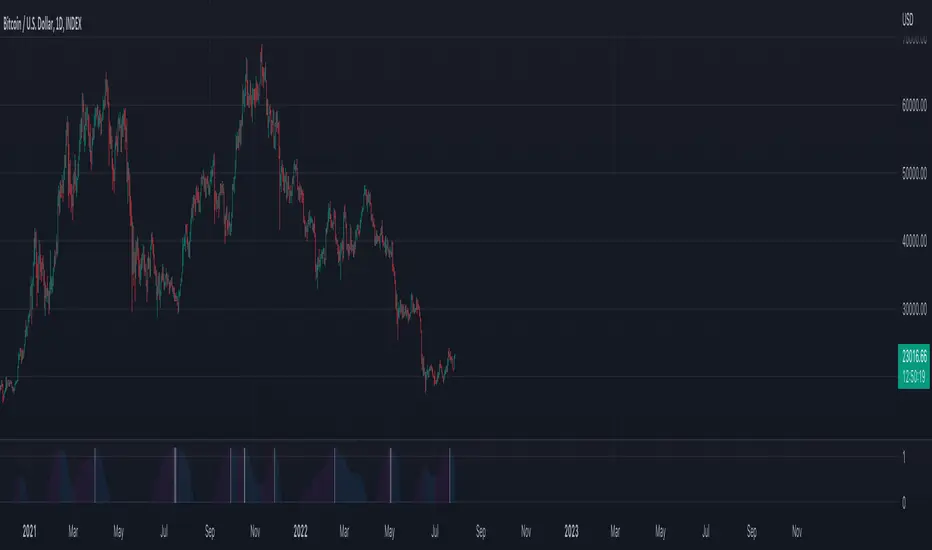
SR StrengthThis indicator measures the strength of support and resistance. Purple bars show SR is increasing. Blue bars show SR strength is decreasing. White bars show the peak of SR strength. The threshold of the white bars can be adjusted in the settings. These extremes happen before a boom. This indicator is also very useful for picking up reversals. Sensitivity can be adjusted to 20 or 50 to find smaller booms and pushed all the way to 1000 or more to find stronger booms.
Supply and Demand MultiTimeFrameWhat Is the Law of Supply and Demand?
The law of supply and demand is a theory that explains the interaction between the sellers of a resource and the buyers for that resource . The theory defines the relationship between the price of a given good or product and the willingness of people to either buy or sell it. Generally, as price increases, people are willing to supply more and demand less and vice versa when the price falls. ( -Investopedia )
This Indicator Help's you to find possible Supply and Demand zones formed on chart on MultiTimeFrame.
All the Supply Zones are colored RED and are above the current price. It will vanish once price crosses over it.
All the Demand Zones are colored GREEN and are below the current price. It will vanish once price crosses under it.
Only Untested Zone are plotted on chart.
These zones can be plotted on Chart TimeFrame as well as MultiTimeFrame(Higher). That can be selected from Input Section.
Concept Behind the Zones
1. Rally Base Rally
2. Drop Base Drop
3. Drop Base Rally
4. Rally Base Drop
Drop base rally
Rally base drop
rally base rally
drop base drop
For Supply zones we try to find "Drop Base Drop" and "Rally Base Drop" , and plot RED zones on the width of base. Base can include any number of candle ranging from 1 to 6. This can be controlled from Input Section
For Demand zones we try to find "Rally Base Rally" and "Drop Base Rally" , and plot GREEN zones on the width of base. Base can include any number of candle ranging from 1 to 6. This can be controlled from Input Section
How to Trade
We recommend to use 5-8 time Higher TimeFrame as Supply and Demand Zones. For Example if chart is at 5 min Timeframe then Zones should be plotted on 25 min to 40 min TImeframe.
And when Price reaches closer to Supply/ Demand Zone then use some other indicator to confirm the reversal from that level, like trendline , moving average etc.
Targets should be nearest Supply/ Demand Zone .

Visible Range Mean Deviation Histogram [LuxAlgo]This script displays a histogram from the mean and standard deviation of the visible price values on the chart. Bin counting is done relative to high/low prices instead of counting the price values within each bin, returning a smoother histogram as a result.
Settings
Bins Per Side: Number of bins computed above and below the price mean
Deviation Multiplier: Standard deviation multiplier
Style
Relative: Determines whether the bins length is relative to the maximum bin count, with a length controlled with the width settings to the left.
Bin Colors: Bin/POC Lines colors
Show POCs: Shows point of controls
Usage
Histograms are generally used to estimate the underlying distribution of a series of observations, their construction is generally done taking into account the overall price range.
The proposed histogram construct N intervals above*below the mean of the visible price, with each interval having a size of: σ × Mult / N , where σ is the standard deviation and N the number of Bins per side and is determined by the user. The standard deviation multipliers are highlighted at the left side of each bin.
A high bin count reflects a higher series of observations laying within that specific interval, this can be useful to highlight ranging price areas.
POCs highlight the most significant bins and can be used as potential support/resistances.

Titans Trend LinesThis indicator will plot trend lines based on recent pivot highs and lows.
The pivot sensitivity level may be customised under the indicator settings. The pivot highs and lows are identified by 'H' and 'L' markers.
Through the indicator, a purple dotted line connects the last two pivot highs and another purple dotted line connects the last two pivot lows. These lines are extended to the left and right beyond the connected points.
If a new trend line has developed due to the formation of a new pivot high or low, the last trend line will be grayed to help with referencing.
The user is advised to use this indicator at his own risk.

Titans Empirical LevelsThis indicator marks key pivot levels across two higher timeframes, longer term, and medium term.
When a pivot high or low is detected at the higher timeframe, a line is plotted in the future.
The user may select timeframes and pivot sensitivities in the indicator settings.
As no calculation is involved, the levels are identified purely from historical precedent.
Overlapping lines could imply strength of recent support/resistance at that level.
This indicator should be used in combination with other indicators.
The user is advised to use this indicator at his own risk.

Next Gen Auto S/RThis indicator will automatically plot support and resistance levels and will also allow you to overlay multi time frame support and resistance on any time frame that you are currently conducting analysis on. In addition you can also set alerts when a support and resistance level is tested, fine tune how many levels you would like to view on your charts, option to input how many candlesticks minimum you would like between support and resistance levels. You can also select breakout mode which will turn old support into resistance by a colour change and turn old resistance into support. NEW you can now use extended levels and change your zones into lines.

Auto Support & Resistance Volume Based + ScannerThis indicator tracks large marker maker orders and draws support & resistance levels based on where those orders came in. It allows you to track what the market makers are doing and place your trades in line with them. Look for the lines to suck up to the price and that will show you where large orders are coming in which is where reversals will happen or trend continuation will happen at an accelerated rate. The fat lines are higher timeframe volume spikes and major volume spikes. Look for bounces off of these fat lines. The fatter the line, the bigger the volume spike. The skinny lines are minor volume spikes over shorter time periods. These can be viewed as short term support and resistance levels and consolidation zones.
***HOW TO USE***
Look for bounces off of the fat lines and place trades accordingly. Those levels are where the market makers placed their orders and you will notice how well price reacts to these levels.
Look for the lines to suck up/down to the price. This shows you where volume is coming in which typically means a reversal is about to happen. If a reversal doesn’t happen, then the trend will continue its original direction, but usually move faster. Wait for these lines to suck up to price before trying to buy the bottoms or sell the tops. If you can have the patience to wait for this to happen, it will keep you out of a lot of choppy price action and give you very good places to take trades that move quickly.
When all the levels suck up to the price and all the colors change to red from green or green from red, it is an indication of market sentiment changing and the trend will likely reverse.
For best results, use this on charts for exchanges that have the highest volume and the most institutional buyers as those will give better levels since there are more market makers on those exchanges. Use exchanges such as NYSE, ARCA and NASDAQ for stocks and use COINBASE, BINANCE, MEXC perpetual futures charts or PEPPERSTONE for crypto.
If price breaks out or down from the group of levels and no lines suck up to the price, then it is a low volume breakout and price usually comes right back to the support and resistance levels so beware when this happens.
If there are no levels near the current price, look at the previous levels in that price range as those are still very relevant areas.
You can also draw trendlines from recent high and low points of the lines where they changed, which works very well for finding tops/bottoms in confluence with the real time s&r levels.
I recommend looking at higher timeframes and drawing horizontal lines where the fat lines are that extend for a long period of time. Then you will have those levels on your lower timeframe charts so you don’t miss any major levels that price will likely bounce off of.
Make sure you spend some time looking back at historical data so you can get a feel for how this indicator reacts to volume spikes before using it.
***HIGHER TIMEFRAMES***
This indicator scans higher timeframes for volume spikes, so make sure you update the higher timeframes used when looking at anything higher than the 1 minute timeframe as that is what the settings are optimized for. You can create new chart layouts for each timeframe you use frequently and save your settings on each chart so that you don’t have to update those settings when you switch timeframes.
***SCANNER***
The table at the bottom of the screen scans 8 other tickers for volume spikes. When a volume spike is detected, the color of that ticker will change from blue to orange to notify you. You can customize which tickers the indicator scans within the indicator settings. Make sure to save your chart layout with your updated tickers so you don’t have to change them frequently. Input all tickers from a certain sector to see how that sector is performing overall which can help give you a good idea of the sector as a whole. Save a different chart layout with each different sector you want to scan so you don’t have to switch the tickers frequently.
***ALERTS***
This indicator is set up with alerts that can be turned on to notify you of volume spikes on the ticker that the chart is set to.
***CUSTOMIZATION***
You can customize the colors of the lines and backgrounds in the indicator style tab. You can also turn off the scanner if you want to within the indicator input tab. The tickers to scan can be customized to suit your preferences within the indicator input tab. The higher timeframes used can also be adjusted within the indicator input tab.
***MARKETS***
This indicator can be used on all markets that have volume data, including stocks, crypto, futures and forex.
***TIMEFRAMES***
This indicator can be used on all timeframes as long as there is enough data for the session used.
***TIPS***
Try using numerous indicators of ours on your chart so you can instantly see the bullish or bearish trend of multiple indicators in real time without having to analyze the data. Some of our favorites are our Trend Friend Signals, Volume Profile with Buy & Sell Pressure, RSI Scalper Ribbon and Auto Support & Resistance with Wick Signals to find those major levels that are not associated with volume spikes in combination with this volume based auto support and resistance indicator.

Trendlines Boll Ichi S1 by GammaprodI. How to use this indicator :
------------------------------
I.1. Set your teadingview theme to dark theme.
I.2. Gammaprod indicator is valid for forex, stock and but more valid for crypto.
I.3. Use three timeframe for more validation (choose between those, that fit to your trading style) :
- Timeframe 1m, 5m, and 15m for Scalping
- Timeframe 30m, 1h and 4h for Intraday
- Timeframe 4h, 1D and 1W for Swing Trading
I.4 Always use THREE INDICATORS FROM GAMMAPROD, those three indicators is back to back each other, by the way, I only made those three indicators only (for now) :
- Trendlines Boll Ichi S1 by Gammaprod
- MACD Volume S2 by Gammaprod
- Stoch RSI Divs Zone S2 by Gammaprod
============================================================================
II. How to setting :
--------------------
II.1. Trendlines Boll Ichi Crypto by Gammaprod
II.1.A. Support and Resistance
- Well if you familiar with this indicator you can add it, but recommended for Timeframe 30m or more
II.1.B. Trendlines Primary or Trendlines Secondary
- Timeframe 1m you DON'T NEED Trendlines Primary or Trendlines Secondary
- Timeframe 5m you DON'T NEED Trendlines Secondary, but you CAN ADD Trendlines Primary if you fell it helpful (for me, it is helpful to find where the candles start or the end trend or a consolidation or where the candles will surpass a resistance or a support).
- Timeframe 15m you DON'T NEED Trendlines Secondary, DEFENITELY add Trendlines Primary it will help to find where the candles stop or a consolidation or where the candles will surpass a resistance or a support).
- Timeframe 30m or more, DEFENITELY NEED BOTH Trendlines Primary and Secondary Trendlines, it will help to find where the candle stop or consolidation or where the candle will surpass a resistance or support).
II.1.C. Bollinger, Ichimoku Cloud and Lagging Span
- Please DON'T CHANGE IT at all, it's really helpful to know when and where to make an entry decesion or a trend or a consolidation, if you don't understand how to read it, you better to learn it first (on "how to read" section and "How to OPEN position" the section below)
II.2. Stoch RSI Divs Zone Crypto by Gammaprod (DON'T CHANGE IT)
II.3. MACD Volume Crypto by Gammaprod (DON'T CHANGE IT)
============================================================================
III. How to read :
------------------
III.1. Sell or Buy Priority :
III.1.A. Sell Priority
- Color background on macd and stoch rsi is pink or purple sell is the priority, (if you're not sure to buy, just wait until the best moment to sell)
III.1.B. Buy Priority
- Color background on macd and stoch rsi Teal or light green buy is the priority, (if you're not sure to sell, just wait until the best moment to buy)
III.1.C. Indecision / Golden Moment
- Color background on stoch rsi yellow is indecision / golden moment of reversal pattern (wait until it formed background only on Stoch RSI), please be careful at this moment.
III.2. Trend / Consolidation :
III.2.A. BULLISH trend
- When Stoch RSI and MACD have teal or light green background that's means BULLISH trend, better to confirm by the candle is above green cloud and lagging span (red line) is also above the candle.
III.2.B. BEARISH trend
- When Stoch RSI and MACD have the Pink or purple background that's means BEARISH trend, better to confirm by the candle is above purple cloud and lagging span (red line) is also below the candle.
III.2.C. CONSOLIDATION
- When Stoch RSI have the mix background that's means CONSOLIDATION, better to confirm by the candle is in or near to green / purple cloud and lagging span (red line) is also on the candle.
III.3. Special Mark
III.3.A. Ideal Bullish :
- Near line 20 and green / teal background = When Stoch RSI have the char R / H on lime color label, that's means divergence or hidden divergence for buy position, if you not see this label that's means just a standard confirmation for buy
III.3.B. Not an Ideal Bullish :
- Near line 80 and green / teal background = if this happens make sure you know what happen, it could be a false signal or bullish continual pattern
III.3.C. Ideal Bearish :
- Near line 80 and pink / purple background = When Stoch RSI have the char R / H on lime color label, that's means divergence or hidden divergence for buy position, if you not see this label that's means just a standard confirmation for sell position.
III.3.D. Not an Ideal Bearish:
- Near line 20 and pink / purple background = if this happens make sure you know what happen, it could be a false signal or bearish continual pattern
III.3.E. The Beginning of Reversal (from BEARISH to BULLISH) :
- When Stoch RSI line shaping GREEN position is near 20.
- MACD lines still PINK, position lines is UNDER the HISTOGRAM, but the HISTOGRAM start to SHAPE FALL PINK (light pink) and the BACKGROUND still PINK / PURPLE.
- Position CANDLES NEAR BLUE line, NEAR PURPLE CLOUD, and lagging span (red line) STILL ON the area candle. (it used to be confirmed with the golden moment).
III.3.F. The Beginning of Reversal (from BULLISH to BEARISH) :
- When Stoch RSI line shaping PINK position is near 80.
- MACD lines still GREEN, position lines is ABOVE the HISTOGRAM, but the HISTOGRAM start to SHAPE FALL GREEN (light green) and the BACKGROUND still TEAL / GREEN.
- Position CANDLES NEAR WHITE line, NEAR TEAL CLOUD, and lagging span (red line) STILL ON the area candle. (it used to be confirmed with the golden moment).
III.3.G. False Signals, or It could be a Golden Moment (better to see it on TF 15 or bigger):
- Near line 20 or 80 and yellow background = When Stoch RSI have the char R / H on color label, that's means divergence or hidden divergence for buy / sell position, if you not see this label that's means just a standard confirmation for buy / sell depends on where the Stoch RSI line if near 20 that's means buy, near 80 means sell
============================================================================
IV. How to OPEN position:
-------------------------
IV.1. Bullish
IV.1.A. Trendlines Boll Ichi S1 by Gammaprod
- The candles above the green cloud.
- Lagging span (red line) above the candles.
- then open buy near yellow line (the first option) / blue line (the second option) (always confirm the position with two other indicators below).
IV.1.B. MACD Volume S2 by Gammaprod
- Teal or Green background.
- The lines is shaped or shaping green.
- Better if at the green histogram.
IV.1.C. Stoch RSI Divs Zone S3 by Gammaprod
- Teal or Green background.
- The lines is shaping green.
- Better if on the bottom (at a range 20).
IV.2. Bearish
IV.2.A. Trendlines Boll Ichi S1 by Gammaprod
- The candles below the purple cloud.
- Lagging span (red line) below the candles.
- then open buy near yellow line (the first option) / white line (the second option) (always confirm the position with two other indicators below).
IV.2.B. MACD Volume S2 by Gammaprod
- Pink or purple background.
- The lines are shaped or shaping green.
- Better if at the pink histogram.
IV.2.C. Stoch RSI Divs Zone S3 by Gammaprod
- Pink or purple background.
- The lines are shaping pink.
- Better if the line on the top (at a range 80).
IV.3. Consolidation
IV.3.A. Trendlines Boll Ichi S1 by Gammaprod
- The candles on the cloud (green or purple).
- Lagging span (red line) on the candles.
- then open buy near the white or blue line (always confirm the position with two other indicators below).
IV.3.B. MACD Volume S2 by Gammaprod
- Changing the background.
- The line is near the middle line.
- Have small Histogram.
IV.3.C. Stoch RSI Divs Zone S3 by Gammaprod
- Mix background specially on a timeframe 15m or more.
- The line move fast up and down.
- Better if on the bottom or the top of the lines (at a range 20 or 80).
============================================================================
>> The secret ingredient is comparing the timeframe :
The example scalping (Timeframe 1m, 5m and 15m)
- TF 1m is for making an open position.
- TF 5m is for making a judgement of the trend market.
- TF 15m is to confirm that judgement from TF 5m, be careful if it not similar then it used to be a consolidation or the beginning of the reversal.
There's a lot a way to open the position than above information that i gave it to you, but consider there are a limit chars on this column, I hope it will help your trading and make a more profit on it.

Disclosure of 'MACD-Total' indicator (MACD-T)hello?
Traders, welcome.
If you "follow", you can always get new information quickly.
Please also click "Like".
Have a good day.
-------------------------------------
A trend indicator has been added to the previously published MACD-Price indicator.
The added MS-Signal indicator is an indicator for viewing the trend and the strength of the trend.
Trading with a trend line is not easy.
Therefore, various MA lines or slanted lines drawn on the chart are used to see the flow of the chart.
Therefore, it is not recommended to trade with the added MS-Signal indicator as support and resistance points.
A trade requires support and resistance points.
To mark support and resistance points, you need a point or section on the horizontal line.
Therefore, it is necessary to utilize the 'Buy/Sell' indicator corresponding to the previously disclosed MACD-Price indicator.
(1W chart)
The long horizontal point of the 'Buy/Sell' indicator serves as support and resistance.
It is possible to check in which section the trend reversal has changed by displaying the MS-Signal indicator.
(1D chart)
A move has emerged to show a reversal of the trend by breaking above the MS-Signal indicator.
Therefore, the MS-Signal indicator is about to change from a downtrend to an uptrend.
I numbered the horizontal line of the 'Buy/Sell' indicator.
The length is different in the order of No. 2 > No. 1 > No. 3.
Since horizontal line 2 is the longest, it indicates that support and resistance play the greatest role.
If you check the support at the first horizontal point, it can be interpreted that there is a high possibility of receiving resistance at the second horizontal point.
However, if you find support at the 2nd horizontal point, you can see that it will go up significantly with 3rd position.
Trading with indicators allows you to make quick choices and decisions.
However, more important than the use of indicators is your own trading strategy.
in other words,
- How much investment will you proceed with the purchase?
- How to proceed with installment purchases
- At what point will the Stop Loss be done?
- How long will the investment period be?
- Is it a long-term investment or a short-term investment?
As listed above, the most important trading strategy for trading should be established.
When conducting a trade, ignoring the above list and thinking about where to buy and where to sell is like sailing in the dark.
We disclose the indicators in the hope that it will become a faster and more objective indicator for trading with the trading strategy you have established.
thank you
------------------------------------------------------------ -----------------------------------------------------
