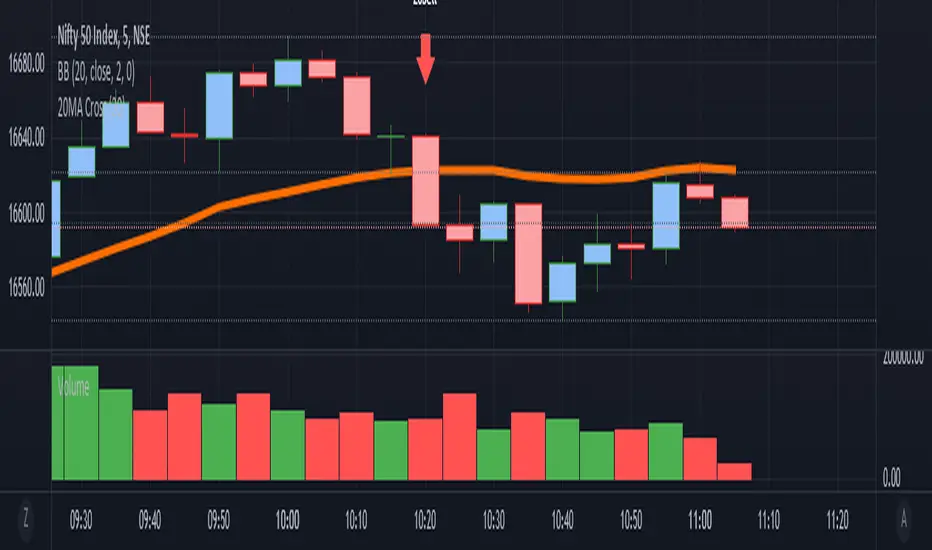
it is a simple Ma cross alert. We can set any ma period.Simple alert for 20MA cross. We can set any ma period.
it plots the crossing candle. This script is purely testing purpose.
Sokongan dan Rintangan
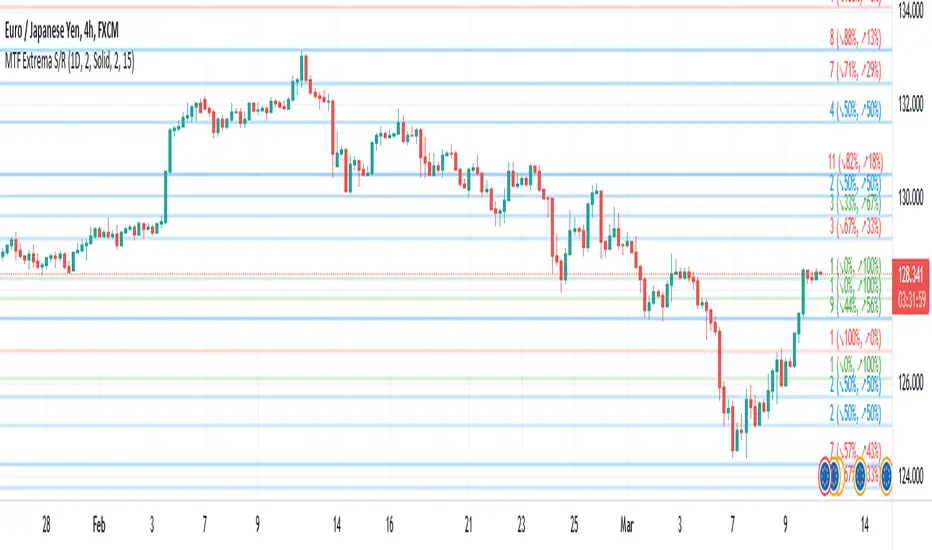
Multi-TimeFrame Extremum Points Support/ResistanceIntroduction
This is my newest Support/Resistance indicator based on the idea of my previous script which had been featured in Editors' Picks .
Everyone seems to have their own idea of how you should measure support and resistance levels. This code finds the exact highest and lowest price points (Extrema) on the chart and then draws the support and resistance levels on them.
In my opinion, the advantage of this method is that the most powerful resistance/support levels which usually cover the supply/demand areas would be formed on these extremum points, as the following facts state.
Facts
1. Support and resistance levels are one of the key concepts used by technical analysts and form the basis of a wide variety of technical analysis tools. Technical analysts use support and resistance levels to identify price points on a chart where the probabilities favor a pause or reversal of a prevailing trend.
2. Supply and demand zones are natural support and resistance levels and a popular analysis technique used in day trading. The zones are the periods of sideways price action that come before explosive price moves. A supply zone forms before a downtrend and a demand zone forms before an uptrend. When the price leaves the supply/demand zone and starts trending, the strong imbalance between buyers and sellers leads to strong and explosive price movements.
3. Based on Dow Theory, trends persist until a clear reversal occurs. A reversal is a change in the price direction of an asset. Reversals typically refer to large price changes, where the trend changes direction.
Challenges
The most challenging part in implementing a S/R indicator which draws all the levels on the chart is the problem of congestion!
But we should notice two other facts:
1. The more times the price tests a support or resistance area, the more significant the level becomes.
2. A previous support level will sometimes become a resistance level when the price attempts to move back up, and conversely, a resistance level will become a support level as the price temporarily falls back.
So, I solved the problem using these two approaches:
Merging nearby levels and showing the role of the levels in colors and numbers
Avoiding many weaker levels by checking higher time frames
Settings and Usage
There are some options in the indicator settings as described below:
Calculations Time Frame: By changing the time frame, user could keep only the stronger S/R levels on the chart.
Level Colors: By default, lowest points (Supports) are green, highest points (Resistances) are red and merged levels are blue. Note that the transparency of the colors would be calculated automatically; The more opaque the color is, the stronger the level is!
Lines Style and Width: The style of the levels could be solid, dashed or dotted and user could also change the lines width in pixels.
Length of the lines: This option is based on the count of bars, but user could simply choose to extend the levels
Merge Nearby Levels: The proximity of the levels would be calculated automatically based on ATR (Average True Range) and the default length of the formula could be changed.
Labels: Each level could have a label consisting the count of merged levels into one, the percentage of merged supports/resistances and the price of the level. Note that if user choose to see the percentage of S/R roles, the color of each label changes automatically based on the main role of corresponding merged level (e.g., a blue level with a red label means that the level more acted as resistance).
I think the users of my previous S/R indicators could check this one
That's it for now! Feel free to send me your thoughts!
TRADING MADE SIMPLEThis indicator shows market structure. The standard method of using Williams Highs and Lows as pivots, is something of an approximation.
What's original here is that we follow rules to confirm Local Highs and Local Lows, and strictly enforce that a Low can only follow a confirmed High and vice-versa.
-- Highs and Lows
To confirm a candle as a Local High, you need a later candle to Close below its Low. To confirm a Local Low, you need a Close above its High.
A Low can only follow a High (after it's been confirmed). You can't go e.g High, High, Low, Low, only High, Low, High, Low.
When price makes Higher Highs and Higher Lows, market structure is said to be bullish. When price makes Lower Lows and Lower Highs, it's bearish.
I've defined the in-between Highs and Lows as "Ranging", meaning, neutral. They could be trend continuation or reversal.
-- Bullish/Bearish Breaks
A Bullish break in market structure is when the Close of the current candle goes higher than the previous confirmed Local High.
A Bearish Break is when the Close of the current candle goes lower than the most recent confirmed Local Low.
I chose to use Close rather than High to reduce edge case weirdness. The breaking candle often ends up being a big one, thus the close of that candle can be a poor entry.
You can get live warnings by setting the alert to Options: Only Once, because during a candle, the current price is taken as the Close.
Breaks are like early warnings of a change in market bias, because you're not waiting for a High or Low to be formed and confirmed.
Buy The Dip / Sell The Rally
Buy The Dip is a label I gave to the first Higher Low in a bullish market structure. Sell The Rally is the first Lower High in a bearish market structure.
These *might* be good buying/selling opportunities, but you still need to do your own analysis to confirm that.
== USAGE ==
The point of knowing market structure is so you don't make bullish bets in a bearish market and vice versa -
or if you do at least you're aware that that's what you're doing, and hopefully have some overwhelmingly good reason to do so.
These are not signals to be traded on their own. You still need a trade thesis. Use with support & resistance and your other favourite indicators.
Works on any market on any timeframe. Be aware that market structure will be different on different timeframes.
IMPORTANT: If you're not seeing what you expect, check your settings and re-read this entire description carefully. Confirming Highs and Lows can get deceptively complex.

BB Order BlocksUsing the Bollinger Band to mark areas of Support and Resistance
The scrip finds the highest and lowest levels of the bands to mark up futures areas of interest.
If the High/Lows are being broken on the Bollinger band, or if the look back range has expired without finding new levels, the script will stop plotting them until new levels are found
I have found many combinations which work well
Changing the band length to to levels 20,50,100 or 200 seem to give interesting results
Aswell as this changing the standard deviation to 3 instead of 2 marks up key levels.
The look back range seems to show better levels on 50,100 and 200
Let me know any changes or updates you think you could make an impact , this was just a quick basic script I wanted to share.

[BA] ATR Stop LineThis indicator helps you to set your stoploss levels by using ATR. Traders often use atr values in order to calculate their stoploss levels.
This indicator does the calculation for you and draw two tiny lines without messing up the chart so that you can easily see your stoploss levels and get an idea about the volatility and risk amount as well.
One line is below the last candle as a long trade stop loss level and the other one is above the last candle as a short trade stop loss level.
Calculation is simple:
For short trades, 2 times ATR added to last price;
For long trades, 2 times ATR subtracted from last price.
You can change ATR length, ATR multiplier and the line length.
Good luck.

Zig Zag(auto Horizon lines)A guy who automatically draws a horizon from the top of the zigzag
*Gray horizon may be repainted
The horizon of the characteristic price in the past reacts well, so it is used for contrarian
ジグザクの頂点から、自動で水平線を引く奴です
※灰色の水平線はリペイントする可能性があります
過去の特徴的な価格の水平線はよく反応するので、逆張りするとかが用途です

Volume Profile and Volume Indicator by DGTVolume Profile (also known as Price by Volume) is an charting study that displays trading activity over a specified time period at specific price levels. It is plotted as a horizontal histogram on the finacial isntrumnet's chart that highlights the trader's interest at specific price levels.
The histogram is used by traders to predict areas of support and resistance. Price levels where the traded volume is high could be assumed as support and resistance levels.
Price may experience difficulty moving above or below areas with large bars. Usually there is a great deal of activity on both the buy and sell side and the market stays at that price level for a great deal of time
It is advised to use volume profile in conjunction with other forms of technical analysis to maximize the odds of success
Light version of Volume Profile is added to Price Action - Support & Resistance by DGT

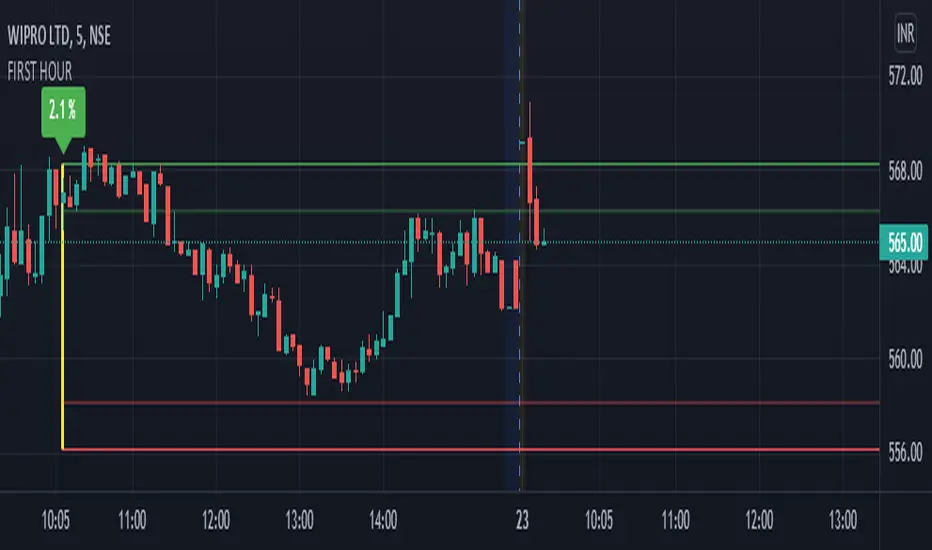
first hour high and low by akash mauryaThis indicator marks the first hour's high and low with a line with the percentage of range height.
First hour high and low generally act as heavy support and resistance or say major key areas in daily intraday charts.
You can adjust the settings if you want to see previous days' hour range lines or not.
This indicator will automatically create hour-range lines after an hour of market opening.
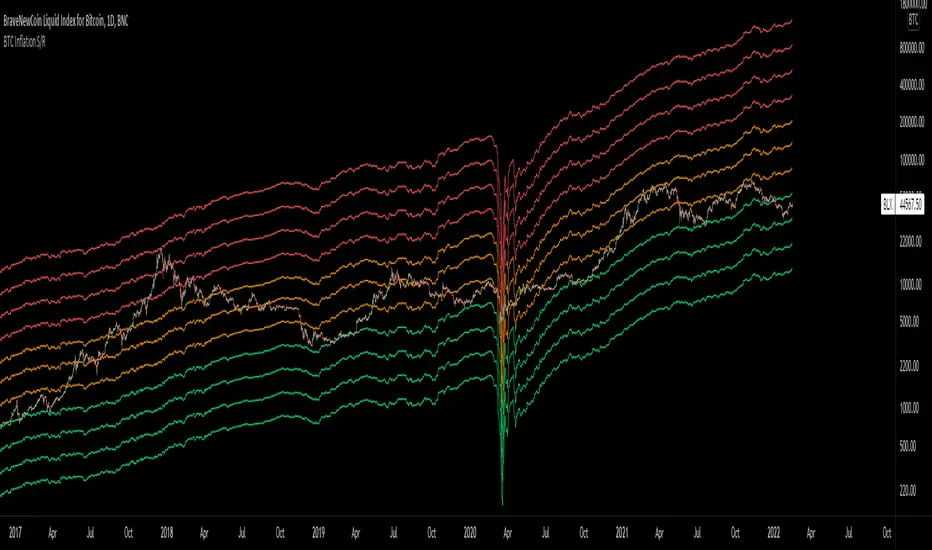
Bitcoin Inflation-Adjusted Support and Resistance5year breakeven inflation rate fitted for log BTC chart as Support and Resistance
Previous N Days/Weeks/Months High LowJapanese below / 日本語説明は下記
This indicator displays previous N days/weeks/months’ highs and lows simultaneously.
N is user input and users can separately input different N for highs and lows.
For instance, if you would like to show past 20days high and 10days low, you specify 20 for high and 10 for low.
Similar to highs and lows of yesterday, last week and last month which I previously developed a indicator for(see the link below), highs and lows of specific terms such as quarters are also respected as supports and resistances.
A legendary trader group, Turtles also uses 20days high/low break as one of their strategies.
Alerts can be set with the conditions below.
-Crossing over previous day’s high
-Crossing under previous day’s low
-Crossing over previous week’s high
-Crossing under previous week’s low
-Crossing over previous month’s high
-Crossing under previous month’s low
Please note that when we say past 2 days in this indicator, past 2days mean yesterday and day before yesterday, so “today” is not included as “today’s” high/low have yet to be fixed.
Related indicator: High/Low Yesterday&Last week&Last month&Last Year
By combining with this indicator, you can highlight important support and resistance.
—————————————————————
過去N日/N週間/Nヶ月の高値·安値を同時に表示することのできるインジケーターです。
Nはパラメーターとなっており、また高値と安値で異なる期間を指定することができます。
例えば、過去20日間の高値と過去10日間の安値という指定が可能です。
昨日、先週、先月の高値·安値と同様に、四半期などの過去一定期間の高値·安値はサポート·レジスタンスとして良く意識されます。
伝説のトレーダー集団タートルズも20日間の高値·安値のブレイクを取引ルールの一つとして使用していたことで有名です。
また、以下の条件でアラート設定が可能です。
-過去N日高値の上方ブレイク
-過去N日安値の下方ブレイク
-過去N週間高値の上方ブレイク
-過去N週間安値の下方ブレイク
-過去Nヶ月高値の上方ブレイク
-過去Nヶ月安値の下方ブレイク
このインジケーターで過去2日間の高値·安値といった場合、過去2日間とは昨日と一昨日の2日間を指します。まだ高値·安値の確定していない本日は含まないことに注意してください。
関連インジケーター: High/Low Yesterday&Last week&Last month&Last Year
当インジケーターと合わせて使用することで、主要なサポートレジスタンスを表示することができます。

RSI Supply / Demand ZonesLines plotted for the Low and High of the region of price that was Overbought or Oversold
(Low of the candle that became overbought and highest high in the Overbought period)
(High of the candle that became oversold and highest high in the Oversold period)
I like to use the dotted lines as pivot points for the reversal of the trend, and also pay attention to small tops and bottoms (normal lines) that form in strong trends, as they usually make for brief periods of acummulation/distribution before the continuation of the strong trend.

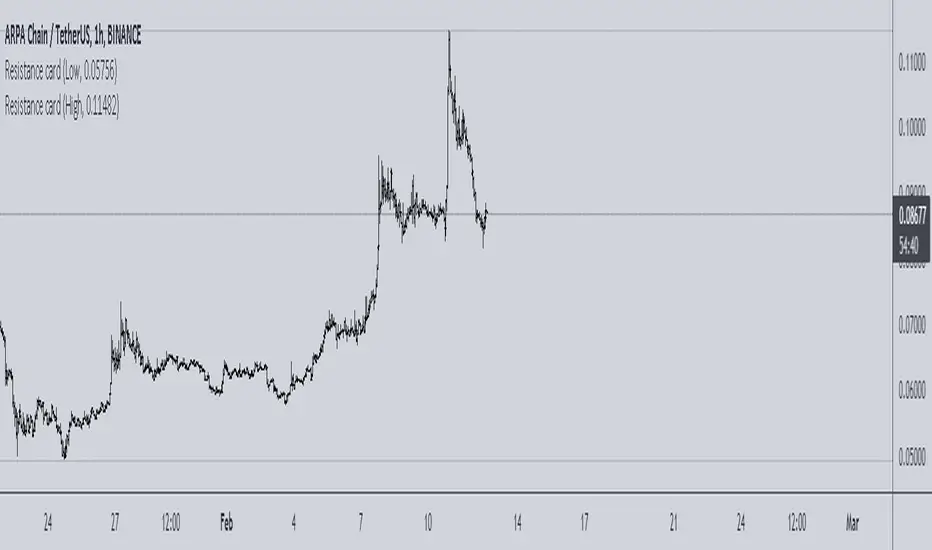
Resistance cardThis is very simple resistance card that you can make. It is recommended to be used on Daily time frame.
How to Use:
If you want to find Resistance levels (above current price), Get the pivot Low value and input in indicator settings. As you are using Low select "Low" in indicator settings, this will draw resistance lines.
If you want to find Support levels (Below current price), Get the pivot High value and input in indicator settings. As you are using Low select "High" in indicator settings, this will draw Support lines.
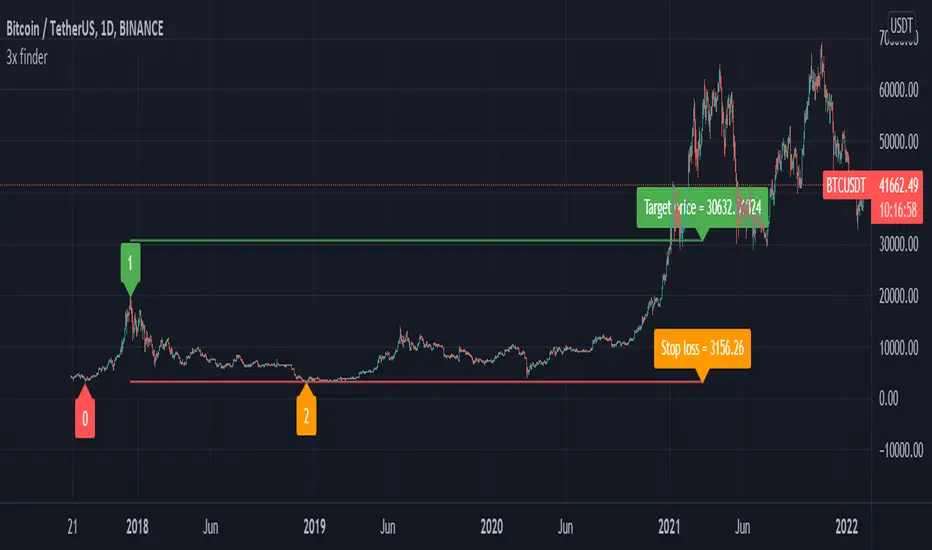
Elliot wave : Wave 3 finder This indicator built for find wave 3 of elliot wave and It also calculate risk reward ratio, minimum target for wave 3 extention and stop loss.
------------ How to use -------------
1. Add this indicator on your chart.
2. If you asset are follow Condition*, buy label with risk reward ratio, Target price and Stop loss will pop up.
*Condition
-50% rebound from the end of wave 2.
-Indicator can detect wave 0, 1 and 2.
If you find any problem please leave comment.
World Markets Open/Close BackgroundIndicator fills background color on the chart for different markets around the world.
This can be helpful in some markets to understand after hours and premarket price action. User can study if there is correlation between highs/low in whole session or open/close of different markets.
Tokyo, Hong Kong and Shanghai are Asian Markets in Red are combined
Bombay, London and NYSE are individually plotted.
Times can be changed for each session to include the entire session, or selected block of 15 minutes.
Less than 15 minutes will need to be changed in the default value of the code which is why I'm publishing it open source.
All coded default times for each market are in CST.
Background color can be turned off individually under the Style tab, and can also be unchecked under Inputs and can just be used for source for further coding.
My intentions for this script is to use it and its variable value to plot the highs and lows just in the specific times in a session and to more easily visualize those sessions with color coding.
I hope this is useful
Cheers!

Support & Ressistance by @kaleboraciy [REUPLOAD]█ OVERVIEW
Support & Resistance levels are important in trading as we all know.
█ WARNING
This version is beta, maybe sometimes it will plot wrong levels, but i will try to to eliminate these issues. And please note, that you should find your own ideal settings for every ticker you use.
█ FEATURES
This is the first script in Pine Community which plots levels using the last two points/ pivots /fractals.
It also stops plotting levels when there is a breakout on the particular level.
█ SETTINGS
1. Pivot Points Length - defines pivot points length. Using to find points where market is reversed. If you set lower value, there will be more points but less useful. As I said you should find your optimal parameters.
2. Inaccuracy in % - defines maximal possible inaccuracy between 2 pivot points .
3. Linewidth - width of line(level)
4. Start Calculations from - if you use low timeframe (1m - 30m) there are a lot of calculations, and PineScript can't process it. This parameter defines start date of calculations and now there are less data and Pine can process it better.
█ HOW IT WORKS
When a new pivot appears, it draws invisible line starting in this pivot . when the second pivots gets created, it checks all lines in array. When inaccuracy is smaller than defined, the line becomes visible.
If price breaks trough the pivots , the lines stop and a new cycle begins.
I hope that this script will be helpful in your trading🙂

Williams Alligator Trend FilterI've edited the normal Bill Williams Alligator indicator to have a color fill that indicates the trend. There is a percentage range filter which checks if the 2 outer lines are enough far away from eachother to indicate a trend. The indicator also checks if the lines are below or above eachother in the right order as a last check to confirm Trend
