MDZ Strategy v4.2 - Multi-factor trend strategyWhat This Strategy Does
MDZ (Momentum Divergence Zones) v4.2 is a trend-following strategy that enters long positions when multiple momentum and trend indicators align. It's designed for swing trading on higher timeframes (2H-4H) and uses ATR-based position management.
The strategy waits for strong trend confirmation before entry, requiring agreement across five different filters. This reduces trade frequency but aims to improve signal quality.
Entry Logic
A long entry triggers when ALL of the following conditions are true:
1. EMA Stack (Trend Structure)
Price > EMA 20 > EMA 50 > EMA 200
This "stacked" alignment indicates a strong established uptrend
2. RSI Filter (Momentum Window)
RSI between 45-75 (default)
Confirms momentum without entering overbought territory
3. ADX Filter (Trend Strength)
ADX > 20 (default)
Ensures the trend has sufficient strength, not a ranging market
4. MACD Confirmation
MACD line above signal line
Histogram increasing (momentum accelerating)
5. Directional Movement
+DI > -DI
Confirms bullish directional pressure
Exit Logic
Positions are managed with ATR-based levels:
ParameterDefaultDescriptionStop Loss2.5 × ATRBelow entry priceTake Profit6.0 × ATRAbove entry priceTrailing Stop2.0 × ATROptional, activates after entry
The default configuration produces a 1:2.4 risk-reward ratio.
Presets
The strategy includes optimized presets based on historical testing:
PresetTimeframeNotes1H Standard1 HourMore frequent signals2H Low DD2 HourConservative settings3H Optimized3 HourBalanced approach4H Swing4 HourWider stops for swing tradesCustomAnyFull manual control
Select "Custom" to adjust all parameters manually.
Inputs Explained
EMAs
Fast EMA (20): Short-term trend
Slow EMA (50): Medium-term trend
Trend EMA (200): Long-term trend filter
RSI
Length: Lookback period (default 14)
Min/Max: Entry window to avoid extremes
ADX
Min ADX: Minimum trend strength threshold
Risk
Stop Loss ATR: Multiplier for stop distance
Take Profit ATR: Multiplier for target distance
Trail ATR: Trailing stop distance (if enabled)
Session (Optional)
Filter entries by time of day
Recommended OFF for 3H+ timeframes
What's Displayed
Info Panel (Top Right)
Current preset
Trend status (Strong/Wait)
ADX, RSI, MACD readings
Position status
Risk-reward ratio
Stats Panel (Top Left)
Net P&L %
Total trades
Win rate
Profit factor
Maximum drawdown
Chart
EMA lines (20 blue, 50 orange, 200 purple)
Green background during strong uptrend
Triangle markers on entry signals
Important Notes
⚠️ This is a long-only strategy. It does not take short positions.
⚠️ Historical results do not guarantee future performance. Backtests show what would have happened in the past under specific conditions. Markets change, and any strategy can experience drawdowns or extended losing periods.
⚠️ Risk management is your responsibility. The default settings risk 100% of equity per trade for backtesting purposes. In live trading, appropriate position sizing based on your risk tolerance is essential.
⚠️ Slippage and commissions matter. The backtest includes 0.02% commission and 1 tick slippage, but actual execution costs vary by broker and market conditions.
Best Practices
Test on your specific market — Results vary significantly across different instruments
Use appropriate position sizing — Never risk more than you can afford to lose
Combine with your own analysis — No indicator replaces understanding market context
Paper trade first — Validate the strategy matches your trading style before risking capital
Alerts
Two alerts are available:
MDZ Long Entry: Fires when all entry conditions are met
Uptrend Started: Fires when EMA stack first aligns bullish
Methodology
This strategy is based on the principle that trend continuation has better odds than reversal when multiple timeframe momentum indicators agree. By requiring five independent confirmations, it filters out weak setups at the cost of fewer total signals.
The ATR-based exits adapt to current volatility rather than using fixed pip/point targets, which helps the strategy adjust to different market conditions.
Questions? Leave a comment below.
Swing

US Market Long Horizon Momentum Summary in one paragraph
US Market Long Horizon Momentum is a trend following strategy for US index ETFs and futures built around a single eighteen month time series momentum measure. It helps you stay long during persistent bull regimes and step aside or flip short when long term momentum turns negative.
Scope and intent
• Markets. Large cap US equity indices, liquid US index ETFs, index futures
• Timeframes. 4h/ Daily charts
• Default demo used in the publication. SPY on 4h timeframe chart
• Purpose. Provide a minimal long bias index timing model that can reduce deep drawdowns and capture major cycles without parameter mining
• Limits. This is a strategy. Orders are simulated on standard candles only
Originality and usefulness
• Unique concept or fusion. One unscaled multiple month log return of an external benchmark symbol drives all entries and exits, with optional volatility targeting as a single risk control switch.
• Failure mode addressed. Fully passive buy and hold ignores the sign of long horizon momentum and can sit through multi year drawdowns. This script offers a way to step down risk in prolonged negative momentum without chasing short term noise.
• Testability. All parameters are visible in Inputs and the momentum series is plotted so users can verify every regime change in the Tester and on price history.
• Portable yardstick. The log return over a fixed window is a unit that can be applied to any liquid symbol with daily data.
Method overview in plain language
The method looks at how far the benchmark symbol has moved in log return terms over an eighteen month window in our example. If that long horizon return is positive the strategy allows a long stance on the traded symbol. If it is negative and shorts are enabled the strategy can flip short, otherwise it goes flat. There is an optional realised volatility estimate on the traded symbol that can scale position size toward a target annual volatility, but in the default configuration the model uses unit leverage and only the sign of momentum matters.
Base measures
Return basis. The core yardstick is the natural log of close divided by the close eighteen months ago on the benchmark symbol. Daily log returns of the traded symbol feed the realised volatility estimate when volatility targeting is enabled.
Components
• Component one Momentum eighteen months. Log of benchmark close divided by its close mom_lookback bars ago. Its sign defines the trend regime. No extra smoothing is applied beyond the long window itself.
• Component two Realised volatility optional. Standard deviation of daily log returns on the traded symbol over sixty three days. Annualised by the square root of 252. Used only when volatility targeting is enabled.
• Optional component Volatility targeting. Converts target annual volatility and realised volatility into a leverage factor clipped by a maximum leverage setting.
Fusion rule
The model uses a simple gate. First compute the sign of eighteen month log momentum on the benchmark symbol. Optionally compute leverage from volatility. The sign decides whether the strategy wants to be long, short, or flat. Leverage only rescales position size when enabled and does not change direction.
Signal rule
• Long suggestion. When eighteen month log momentum on the benchmark symbol is greater than zero, the strategy wants to be long.
• Short suggestion. When that log momentum is less than zero and shorts are allowed, the strategy wants to be short. If shorts are disabled it stays flat instead.
• Wait state. When the log momentum is exactly zero or history is not long enough the strategy stays flat.
• In position. In practice the strategy sits IN LONG while the sign stays positive and flips to IN SHORT or flat only when the sign changes.
Inputs with guidance
Setup
• Momentum Lookback (months). Controls the horizon of the log return on the benchmark symbol. Typical range 6 to 24 months. Raising it makes the model slower and more selective. Lowering it makes it more reactive and sensitive to medium term noise.
• Symbol. External symbol used for the momentum calculation, SPY by default. Changing it lets you time other indices or run signals from a benchmark while trading a correlated instrument.
Logic
• Allow Shorts. When true the strategy will open short positions during negative momentum regimes. When false it will stay flat whenever momentum is negative. Practical setting is tied to whether you use a margin account or an ETF that supports shorting.
Internal risk parameters (not exposed as inputs in this version) are:
• Target Vol (annual). Target annual volatility for volatility targeting, default 0.2.
• Vol Lookback (days). Window for realised volatility, default 63 trading days.
• Max Leverage. Cap on leverage when volatility targeting is enabled, default 2.
Usage recipes
Swing continuation
• Signal timeframe. Use the daily chart.
• Benchmark symbol. Leave at SPY for US equity index exposure.
• Momentum lookback. Eighteen months as a default, with twelve months as an alternative preset for a faster swing bias.
Properties visible in this publication
• Initial capital. 100000
• Base currency. USD
• Default order size method. 5% of the total capital in this example
• Pyramiding. 0
• Commission. 0.03 percent
• Slippage. 3 ticks
• Process orders on close. On
• Bar magnifier. Off
• Recalculate after order is filled. Off
• Calc on every tick. Off
• All request.security calls use lookahead = barmerge.lookahead_off
Realism and responsible publication
The strategy is for education and research only. It does not claim any guaranteed edge or future performance. All results in Strategy Tester are hypothetical and depend on the data vendor, costs, and slippage assumptions. Intrabar motion is not modeled inside daily bars so extreme moves and gaps can lead to fills that differ from live trading. The logic is built for standard candles and should not be used on synthetic chart types for execution decisions.
Performance is sensitive to regime structure in the US equity market, which may change over time. The strategy does not protect against single day crash risk inside bars and does not model gap risk explicitly. Past behavior of SPY and the momentum effect does not guarantee future persistence.
Honest limitations and failure modes
• Long sideways regimes with small net change over eighteen months can lead to whipsaw around the zero line.
• Very sharp V shaped reversals after deep declines will often be missed because the model waits for momentum to turn positive again.
• The sample size in a full SPY history is small because regime changes are infrequent, so any test must be interpreted as indicative rather than statistically precise.
• The model is highly dependent on the chosen lookback. Users should test nearby values and validate that behavior is qualitatively stable.
Legal
Education and research only. Not investment advice. You are responsible for your own decisions. Always test on historical data and in simulation with realistic costs before any live use.

Fibonacci-Only StrategyFibonacci-Only Strategy
This script is a custom trading strategy designed for traders who leverage Fibonacci retracement levels to identify potential trade entries and exits. The strategy is versatile, allowing users to trade across multiple timeframes, with built-in options for dynamic stop loss, trailing stops, and take profit levels.
Key Features:
Custom Fibonacci Levels:
This strategy calculates three specific Fibonacci retracement levels: 19%, 82.56%, and the reverse 19% level. These levels are used to identify potential areas of support and resistance where price reversals or breaks might occur.
The Fibonacci levels are calculated based on the highest and lowest prices within a 100-bar period, making them dynamic and responsive to recent market conditions.
Dynamic Entry Conditions:
Touch Entry: The script enters long or short positions when the price touches specific Fibonacci levels and confirms the move with a bullish (for long) or bearish (for short) candle.
Break Entry (Optional): If the "Use Break Strategy" option is enabled, the script can also enter positions when the price breaks through Fibonacci levels, providing more aggressive entry opportunities.
Stop Loss Management:
The script offers flexible stop loss settings. Users can choose between a fixed percentage stop loss or an ATR-based stop loss, which adjusts based on market volatility.
The ATR (Average True Range) stop loss is multiplied by a user-defined factor, allowing for tailored risk management based on market conditions.
Trailing Stop Mechanism:
The script includes an optional trailing stop feature, which adjusts the stop loss level as the market moves in favor of the trade. This helps lock in profits while allowing the trade to run if the trend continues.
The trailing stop is calculated as a percentage of the difference between the entry price and the current market price.
Multiple Take Profit Levels:
The strategy calculates seven take profit levels, each at incremental percentages above (for long trades) or below (for short trades) the entry price. This allows for gradual profit-taking as the market moves in the trade's favor.
Each take profit level can be customized in terms of the percentage of the position to be closed, providing precise control over exit strategies.
Strategy Backtesting and Results:
Realistic Backtesting:
The script has been backtested with realistic account sizes, commission rates, and slippage settings to ensure that the results are applicable to actual trading scenarios.
The backtesting covers various timeframes and markets to ensure the strategy's robustness across different trading environments.
Default Settings:
The script is published with default settings that have been optimized for general use. These settings include a 15-minute timeframe, a 1.0% stop loss, a 2.0 ATR multiplier for stop loss, and a 1.5% trailing stop.
Users can adjust these settings to better fit their specific trading style or the market they are trading.
How It Works:
Long Entry Conditions:
The strategy enters a long position when the price touches the 19% Fibonacci level (from high to low) or the reverse 19% level (from low to high) and confirms the move with a bullish candle.
If the "Use Break Strategy" option is enabled, the script will also enter a long position when the price breaks below the 19% Fibonacci level and then moves back up, confirming the break with a bullish candle.
Short Entry Conditions:
The strategy enters a short position when the price touches the 82.56% Fibonacci level and confirms the move with a bearish candle.
If the "Use Break Strategy" option is enabled, the script will also enter a short position when the price breaks above the 82.56% Fibonacci level and then moves back down, confirming the break with a bearish candle.
Stop Loss and Take Profit Logic:
The stop loss for each trade is calculated based on the selected method (fixed percentage or ATR-based). The strategy then manages the trade by either trailing the stop or taking profit at predefined levels.
The take profit levels are set at increments of 0.5% above or below the entry price, depending on whether the position is long or short. The script gradually exits the trade as these levels are hit, securing profits while minimizing risk.
Usage:
For Fibonacci Traders:
This script is ideal for traders who rely on Fibonacci retracement levels to find potential trade entries and exits. The script automates the process, allowing traders to focus on market analysis and decision-making.
For Trend and Swing Traders:
The strategy's flexibility in handling both touch and break entries makes it suitable for trend-following and swing trading strategies. The multiple take profit levels allow traders to capture profits in trending markets while managing risk.
Important Notes:
Originality: This script uniquely combines Fibonacci retracement levels with dynamic stop loss management and multiple take profit levels. It is not just a combination of existing indicators but a thoughtful integration designed to enhance trading performance.
Disclaimer: Trading involves risk, and it is crucial to test this script in a demo account or through backtesting before applying it to live trading. Users should ensure that the settings align with their individual risk tolerance and trading strategy.

Moving Average Crossover Swing StrategyMoving Average Crossover Swing Strategy
**Overview:**
The basic concept of this strategy is to generate a signal when a faster/shorter length moving average crosses over (for Longs) or crosses under (for Shorts) a medium/longer length moving average. All of which are customizable. This strategy can work on any timeframe, however the daily is the timeframe used for the default settings and screenshots, as it was designed to be a multi-day swing strategy. Once a signal has been confirmed with a candle close, based on user options, the strategy will enter the trade on the open of the next candle.
The crossover strategy is nothing new to trading, but what can make this strategy unique and helpful, is the addition of further confirmation points, ATR based stop loss and take profit targets, optional early exit criteria, customizable to your needs and style, and just about everything visual can be toggled on/off. This strategy is based on a Trend (MA) indicator and a Momentum (MACD) indicator. While a Volume-based indicator is not shown here, one could consider using their favorite from that category to further compliment the signal idea.
It should be noted that depending on the time frame, direction(s) chosen, the signal options, confirmation options, and exit options selected, that a ticker may not produce more than 100 trades on the back test. Depending on your style and frequency, one could consider adjusting options and/or testing multiple tickers. It should also be noted that this strategy simply tests the underlying stock prices, not options contracts. And of course, testing this strategy against historical data does not assume that the same results will occur in future price action.
Shoutout given to Ripster's Clouds Indicator as pieces of that code were taken and modified to create both the Cloud visualization effects, and the Moving Average Pair Plots that are implemented in this strategy.
BASIC DEFAULTS
All can be changed as normal
Initial capital = 10,000
Order Sizing = 25% of equity (use the "Inputs" tab to modify this)
Pyramiding = 0
Commission = 0.65 USD per order
Price Verification = 1 tick
Slippage = 1 tick
RISK MANAGMENT
You will notice two different percentage options and ATR multipliers. This strategy will adjust position sizing by not exceeding either one of those % values based on the ATR (Average True Range) of the symbol and the multipliers selected, should the stock hit the stop loss price.
For Example, lets assume these values are true:
Account size = $10,000,
Max Risk = 1% of account size
Max Position Size = 25% of the account size
Stock Price = 23.45
ATR = 3.5
ATR Stop Loss Multiplier = 1.4
Then the formulas would be:
ACCT_SIZE * MaxRisk_% = 10000 * .01 = $100 (MaxCashRisk)
-----
MaxCashRisk / (ATR * ATR_SL_MULTIPLIER) = 100 / (3.5 * 1.4) = 20.4 Shares based on Max Cash Risk
-----
(ACCT_SIZE * MaxEquity_%) / STOCK_PRICE = (10000 * .25) / 23.45 = 106.61 Shares based on Max Equity Allocation
The minimum value of each of those options is then used, which in this case would be to purchase 20 shares so as not to exceed the max dollar risk should the stock reach the stop loss target. Likewise, if the ATR were to be much lower, say 0.48 cents, and all else the same, then the strategy would purchase the 106 shares based on Max Equity Allocation because the Max Cash Risk would require 149.25 shares.
MOVING AVERAGE OPTIONS
Select between and change the length & type of up to 5 pairs (10 total) of moving averages
The "Show Cloud-x" option will display a fill color between the "a" and "b" pairs
All moving averages lines can be toggled on/off in the "Style" tab, as well as adjusting their colors.
Visualization features do not affect calculations, meaning you could have all or nothing on the chart and the strategy will still produce results
SIGNAL CHOICES
Choose the fast/shorter length MA and the medium/longer length MA to determine the entry signal
CONFIRMATION OPTIONS
Both of these have customizable values and can be toggled on/off
A candle close over a slower/much longer length moving average
An additional cross-over (cross-under for Shorts) on the MACD indicator using default MACD values. While the MACD indicator is not necessary to have on the chart, it can help to add that for visualization. The calculations will perform whether the indicator is on the chart or not.
EARLY EXIT CRITERIA
Both can be toggled on/off with customizable values
MA Cross Exit will exit the trade early if the select moving averages cross-under (for longs) or cross-over (for shorts), indicating a potential reversal.
Max Bars in Trades will act as a last-resort exit by simply calculating the amount of full bars the trade has been open, and exiting on the opening of the next bar. For example: the default value is 8 bars, so after 8 full bars in the trade, if no other exit has been triggered (Stop Loss, Take Profit, or MA Cross(if enabled)), then the trade will exit at the opening of the 9th bar.
Finally, there is a table displaying the amount of trades taken for each side, and the amount & percent of both early exits. This table can be turned off in the "Style" tab
ADDITIONAL PLOTS
MACD (Moving Average Convergence/Divergence):
- The MACD is an optional confirmation indicator for this strategy.
- Plotting the indicator is not necessary for the strategy to work, but it can be helpful to visually see the status and position of the MACD if this feature is enabled in the strategy
- This helps to identify if there is also momentum behind the entry signal

3kilos BTC 15mThe "3kilos BTC 15m" is a comprehensive trading strategy designed to work on a 15-minute timeframe for Bitcoin (BTC) or other cryptocurrencies. This strategy combines multiple indicators, including Triple Exponential Moving Averages (TEMA), Average True Range (ATR), and Heikin-Ashi candlesticks, to generate buy and sell signals. It also incorporates risk management features like take profit and stop loss.
Indicators
Triple Exponential Moving Averages (TEMA): Three TEMA lines are used with different lengths and sources:
Short TEMA (Red) based on highs
Long TEMA 1 (Blue) based on lows
Long TEMA 2 (Green) based on closing prices
Average True Range (ATR): Custom ATR calculation with EMA smoothing is used for volatility measurement.
Supertrend: Calculated using ATR and a multiplier to determine the trend direction.
Simple Moving Average (SMA): Applied to the short TEMA to smooth out its values.
Heikin-Ashi Close: Used for additional trend confirmation.
Entry & Exit Conditions
Long Entry: Triggered when the short TEMA is above both long TEMA lines, the Supertrend is bullish, the short TEMA is above its SMA, and the Heikin-Ashi close is higher than the previous close.
Short Entry: Triggered when the short TEMA is below both long TEMA lines, the Supertrend is bearish, the short TEMA is below its SMA, and the Heikin-Ashi close is lower than the previous close.
Take Profit and Stop Loss: Both are calculated as a percentage of the entry price, and they are set for both long and short positions.
Risk Management
Take Profit: Set at 1% above the entry price for long positions and 1% below for short positions.
Stop Loss: Set at 3% below the entry price for long positions and 3% above for short positions.
Commission and Pyramiding
Commission: A 0.07% commission is accounted for in the strategy.
Pyramiding: The strategy does not allow pyramiding.
Note
This strategy is designed for educational purposes and should not be considered as financial advice. Always do your own research and consider consulting a financial advisor before engaging in trading.

Volatility Stop with Vwap StrategyFirst the credits goes to @TradingView for their release of the volatility stop mtf indicator.
I have took it, and inside I have added a weekly vwap for a better trend direction and at the same time I have added a dynamic risk managment which is calculated from the distance between the volatility line to the close of the candle.
The rules for entry are simple:
For long:We enter when our close of the candle is above the volatility stop line and at the same time the close of the candle is above weekly vwap
For short we enter when our close of the candle is below the volatility stop line and at the same time the close of the candle is below weekly vwap.
We exit when we either have a reverse signal than the one we enterred, or based on the TP/SL which is calculated with the distance from vwap to the close of the candle.
If you have any questions please let me know !

USD Liquidity Conditions Index Swing Stock Strategy Original credits goes to @ElDoggo22 www.tradingview.com
I looked in the post created by him, of USD liquidity and I have noticed that if you are going to apply a percentile top and bottom to it, can become an interesting swing strategy for US Stocks.
So in this case I decided to create a 99th percentile for top and 4th percentile for bot with a big length, preferably 100+ candles, for this example i took 150.
Rules for entry :
Long : either bot or top lines are ascending
We exit long either the top line is descending, or we have sudden cross of the moving average with both top and bot within the same candle
Short: we enter short when we have a sudden cross down of the moving average with both top and bot within the same candle
We exit short when we have a cross over of the moving average with both top and bot within the same candle ( or we have a long entry condition)
If there are qny questions, please let me know !

Ultra Moving Average Rating Trend StrategyThis is a technical analysis strategy based initially on the rating strategy, but fully adapted and converted to moving average rating.
In this case we are using: Ichimoku, SMA, EMA, ALMA, SMMA, LSMA, VWMA, DEMA, HMA, KAMA FRAMA, VIDYA, JMA, TEMA, ZLEMA, TRIMA and T3 moving averages.
With all of them together I am making an index.
Rules for entry and exit:
If % percentage of all the moving averages is telling to go long , we go long or exit short. And viceversa for short.
If there are any questions, please let me know !

RSI Average Swing BotThis is a modified RSI version using as a source a big length(50 candles) and an average of all types of sources for candle calculations such as ohlc4, close, high, open, hlc3 and hl2.
In this case we are going to use a 0-1 scale for an easier calculation, where 0.5 is going to be our middle point.
Above 0.5 we consider a bullish possibility.
Below 0.5 we consider a bearish possibility.
I made a small example bot using that initial logic, together with 2 exit points for long or short positions.
If there are any questions, let me know !

Swing Multi Moving Averages Crypto and Stocks StrategySimple and efficient multi moving average strategy combined with risk management and time condition.
Indicators/ Tools used
Multi selection moving average type like SMA , EMA , SMMA , VWMA , VIDYA , FRAMA , T3 and much more
Limit 1 entry max per week, entry on monday exit on sunday or risk management tp/sl.
Rules for entry:
LONG:Close of the candle cross above the moving average while the previous close was below. All of this is happening during monday session.
SHORT:Close of the candle cross below the moving average while the previous close was above. All of this is happening during monday session.
Rules for exit:
We exit either on sunday or if we reach tp/sl levels.
Observations:
I recommend use the strategy 2 types, one for long and another for short, using different parameters since long and short movements behave differently.
For example for long we can use a shorter moving average longth and a higher tp/sl while for short we can use a bigger moving average length and a smaller tp/sl
If you have any questions let me know !

Swing VWAP Crypto and Stocks StrategyThis is a strategy designed for swing trading on markets such as crypto and stocks.
Its components are:
VWAP
Time Management
Risk management
Rules for entry:
We entry only on Monday, if our close of the candle crossed above VWAP
Rules for exit
We exit always on Sunday or if we either hit the TP/SL levels.
If you have any questions let me know

Advanced OutSide with HMA and Klinger Forex Swing strategyThis is a swing forex strategy, adapted for big timeframes, such as 4h+.
For this example I adapted the strategy to EUR USD main forex pair.
Its components are:
Outside condition
Klinger Oscillator
Hull moving average
Rules for entry
For long: if current high is bigger than previous high and current is smaller than previous low and klinger is positive, close of the candle is above lsma and we have a bull candle.
For short: if current high is smaller than previous high and current is bigger than previous low and klinger is negative, close of the candle is below lsma and we have a bear candle.
Rules for exit
We exit when we have a reverse condition
We exit in case we hit the tp/sl based on % movement of the price.
If you have any questions, let me know !

Improved Bollinger Swing Strategy Stock NasdaqThis is an improved bollinger band strategy adapted to Nasdaq Index/Stocks.
The new update include a multiple logic calculation BB adapted for long and short, together with a risk management using movement in %.
Rules for entry
For long we have a crossover between the close and the lower band from the bb
For long we have a crossover between the close and the upper band from the bb
Rules for exit
We exit when we either find a reverse condition, or if we hit the take profit/stop loss levels.
If you have any questions, let me know !

Full Swing Gold Vwap Macd SMO StrategyThis is a full strategy designed for gold market using 12h timeframe chart.
Its components are:
VWAP monthly
SMO oscillator
MACD histogram
Rules for entry:
For long: when enter when close of the candle is above vwap monthly, current histogram is higher than the previous one and SMO oscillator is above 0
For long: when enter when close of the candle is below vwap monthly, current histogram is lower than the previous one and SMO oscillator is below 0
Rules for exit:
We exit the trade if we get a reverse condition.
We also exit the trade based on a risk management system, both for SL and TP using % movements.
If you have any questions let me know !

Crypto swing correlation RSI and SMAThis is a crypto swing strategy, designed for long term periods and correlated pairs with crypto market total(or other coins used as correlation, however I recommend total of crypto or btc)
Its components are:
RSI with a very length
Correlation candles
SMA 9
Rules for entry:
For long : RSI is above 51 level and going higher and close of the candle is above the SMA
For short :RSI is below 49 and going lower and close of the candle is below the SMA
Rules for exit:
We exit when we encountered an opposite condition than the entry one, or based on take profit/stop loss levels.
If you have any questions let me know !

Full Crypto Swing Strategy ALMA Cross with MACDThis is a full crypto swing strategy designed.
From my testing it looks like it perform the best on timeframes 4h +.
The below example has been adapted to BNB/USDT, using the entire period since 2017 until present day, with a comission of 0.03% ( which is the comission for the futures on binance).
Its components are :
ALMA Fast
ALMA Slow
MACD Histogram
Rules for entry
For long, we have a crossover of the fast alma with the slow one and the histogram is ascending.
For short, we have a crossunder of the fast alma with the slow one and the histogram is descending.
Rules for exit
We exit based on a risk management system for TP and SL, or when we receive an opposite condition than the initial one.
Regarding risk management
0.05 = 5% movement
2 = 200% movement
0.001 = 0.1% movement
If you have any questions, let me know !

DMI Swings (by Coinrule)The Directional Movement Index is a handy indicator that helps catch the direction in which the price of an asset is moving. It compares the prior highs and lows to draw three lines:
Positive directional line (+DI)
Negative directional line (-DI)
Average direction index (ADX)
DMI is simple to interpret. When +DI > - DI, it means the price is trending up. On the other hand, when -DI > +DI, the trend is weak or moving on the downside.
The ADX does not give an indication about the direction but about the strength of the trend.
Typically values of ADX above 25 mean that the trend is steeply moving up or down, based on the -DI and +D positioning. This script aims to capture swings in the DMI, and thus, in the trend of the asset, using a contrarian approach.
ENTRY
-DI is greater than +DI
ADX is greater than 45
EXIT
+DI is greater than -DI
ADX is greater than 45
Trading on high values of ADX, the strategy tries to spot extremely oversold and overbought conditions. Values of ADX above 45 may suggest that the trend has overextended and is may be about to reverse.
Our backtests suggest that this script performs well for very short-term scalping strategies on low time frames, such as the 1-minute.
The script considers a 0.1% trading fee to make results more realistic to those you can expect from live market conditions. So realistically, live results should be similar to backtested results.
You can plug this script directly into your crypto exchange using TradingView Signals on Coinrule.
Trade Safely!

High/Low Channel Multi averages Crypto Swing strategyThis is a swing strategy designed for trending markets such as crypto and stock, with big timeframes , like 8h.
For this strategy we take SMA, EMA, VWMA, ALMA, SMMA, LSMA and VWMA and make an apply them all to both HIGH and LOW separately and make 2 averages, 1 applied to high and the other applied to low.
With them we make a channel.
Rules for entry
For long: close of a candle is above avg applied to high.
For short: close of a candle is below avg applied to low.
Rules for exit
We exit when we either hit TP or SL or when we receive a different condition than the entry one.(long- > short and viceversa)
If you have any questions, let me know !

Aggresive Scalper/Swing Crypto StrategyThis is a simple yet very efficient scalper long strategy adapted for low timeframes for crypto. Can also be used with bigger timeframes as a swinger.
Its main components are:
Price oscillator swing
Vortex
Risk management for TP/SL
Rules for entry
We calculate the difference between the oscillator from the lowest low and the highest high. If the difference is positive, its a long potential. If its negative we exit from the long trade.
At the same time we check that the we have a crossover between the VIP vortex with the VIM vortex part.
Lastly we check that the current candle is bigger the second previous high.
Rules for exit
If we reach the take profit or the stop loss.
If we have a negative difference betwee LL and HH and VIP vortex crossunder with VIM vortex .
In this example I aimed for a 1:10 risk reward ratio, meaing that for every dollar lost, we will gain 10 when we win. Thus having a 10% minimum win rate will give us a profit over many trades.
If you have any questions, let me know !

Extremely high win rate FOREX swing strategyTHis is a very simple yet extremely efficient FOREX strategy .
In general it tends to work the best against NZD and AUD pairs, however other major pairs and crosses can work as well.
It's made of a time management, together with MACD , moving average , a price action rule and a risk management.
THe logic behind is the next one :
For LONG:
We have 3 ascending candles.
Histogram of MACD is positive.
Last close of a candle is was above moving average.
If all those previous condition happened before 17/18 UTC time depending if its summer time or not, we enter the trade.
For Short:
We have 3 descending candles.
Histogram of MACD is negative.
Last close of a candle is was below moving average.
If all those previous condition happened before 17/18 UTC time depending if its summer time or not, we enter the trade.
RIsk management
For risk management, since we aim to have a 95%+ win rate, we aim to have a 5:1 or 10:1 risk to reward ratio. Meaning that for each $ we can win, we can lose 5-10$.
THats why I recommend to be extremely careful when playing with leverage with this strategy.

Vwap mtf Swing Stock StrategyThis is a trending strategy designed for stock market, especially long trending assets such as TSLA, NIO, AMAZON and so on.
Its made of volatility bands and weekly VWAP, in this case daily and weekly.
This strategy has been adapted to go long only.
Rules for entry
For long , we want to enter close of a candle is above vwap weekly, and at the same time the close of a candle cross-under the lower volatility band.
For exit , we want to enter close of a candle is below vwap weekly, and at the same time the close of a candle cross-over the upper volatility band.
This strategy does not have a risk management inside, so use it with caution.
If you have any questions, let me know !

3 RSI 6sma/ema ribbon crypto strategyThis is a very efficient swing trading strategy designed for crypto long timeframes like 2h+.
Initially we have 3 RSI .
AFter that we use them as source for 6 SMA/EMA for each RSI, 5, 30, 50, 70, 90, 100. With those we create a ribbon that we are going to use in order to check the direction of the trend.
Rules for entry:
For long : if either all the SMA/EMA's from the 2nd RSI are telling us to go long, or all the all SMA/EMA's from the 3rd rsi are telling us to go long F
For short : if either all the SMA/EMA's from the 2nd RSI are telling us to go short, or all the all SMA/EMA's from the 3rd rsi are telling us to go short
We exit when we get an opposite condition than the entry one.
Caution: this strategy has no risk management inside, so use it with caution. If you have any questions , let me know !

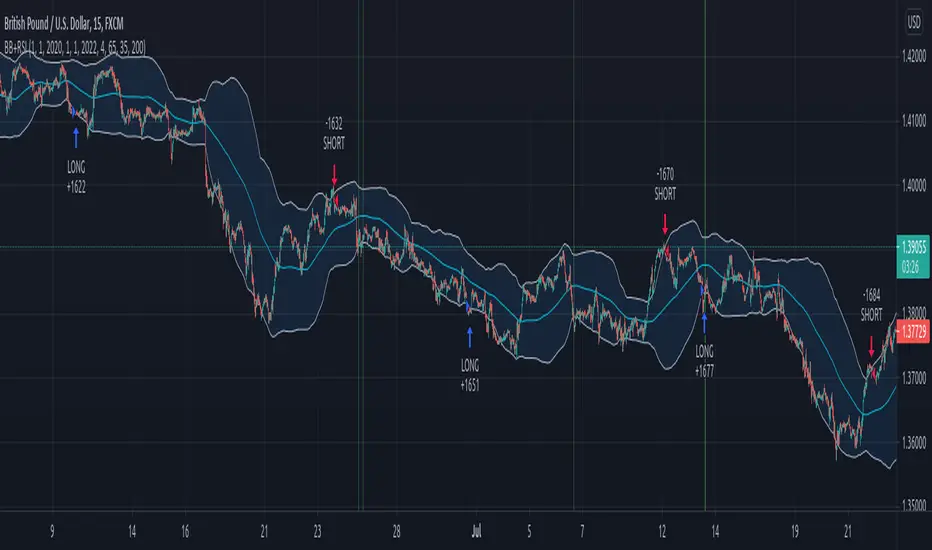
Swing forex strategy 15minThis is a strategy made using BB+ RSI indicators that seems to work great with 15 min major pairs for FOREX.
THe rules for it are simple:
For long we enter when the close of our candle crosses upwards the lower line and rsi crossover the over sold line
We exit long when we have a short entry.
For short we enter when the close of the candle crosses downwards the top line and rsi cross under the over bought line
WE exit short when we have a long entry.
Careful, this strategy has no risk management inside.
If you have any questions let me know !