Volume Price and FundamentalsVolume Price and Fundamentals indicators contains 4 exponential moving averages based upon Fibonnaci numbers as period (8, 21, 55 & 144) with crossovers and crossunders.
It also contain a table for volume and 50 Day Avg. Volume, Relative volume, Change in Volume, Volume Value, Up-Down Closing Basis days in last 50 days, Volume ratio (U/D Ratio) on last 50-day Up / Down days and along with fundamental analysis table with various Fundamental Analysis parameters and QoQ & YoY comparison basis for better investment decision making.
Table

Timeframe Bias TableAllows you to display a bias for the W, D, 4h, 15m & 1m Timeframes based on your own analysis.

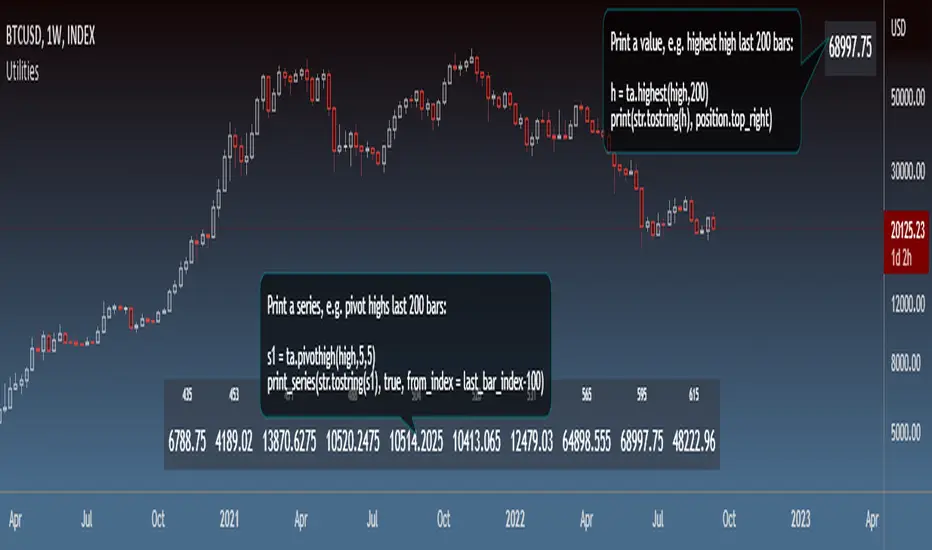
UtilitiesLibrary "Utilities"
General utilities
print_series(s, skip_na, position, show_index, from_index, to_index)
Print series values
Parameters:
s : Series (string)
skip_na : Flag to skip na values (optional bool, dft = false)
position : Position to print the Table (optional string, dft = position.bottom_center)
show_index : Flag to show series indices (optional bool, dft = true)
from_index : First index to print (optional int, dft = 0)
to_index : Last index to print (optional int, dft = last_bar_index)
Returns: Table object, if series was printed
print(v, position, at_index)
Print value
Parameters:
v : Value (string)
position : Position to print the Table (optional string, dft = position.bottom_center)
at_index : Index at which to print (optional int, dft = last_bar_index)
Returns: Table object, if value was printed
Correlation with Matrix TableCorrelation coefficient is a measure of the strength of the relationship between two values. It can be useful for market analysis, cryptocurrencies, forex and much more.
Since it "describes the degree to which two series tend to deviate from their moving average values" (1), first of all you have to set the length of these moving averages. You can also retrieve the values from another timeframe, and choose whether or not to ignore the gaps.
After selecting the reference ticker, which is not dependent from the chart you are on, you can choose up to eight other tickers to relate to it. The provided matrix table will then give you a deeper insight through all of the correlations between the chosen symbols.
Correlation values are scored on a scale from 1 to -1
A value of 1 means the correlation between the values is perfect.
A value of 0 means that there is no correlation at all.
A value of -1 indicates that the correlation is perfectly opposite.
For a better view at a glance, eight level colors are available and it is possible to modify them at will. You can even change level ranges by setting their threshold values. The background color of the matrix's cells will change accordingly to all of these choices.
The default threshold values, commonly used in statistics, are as follows:
None to weak correlation: 0 - 0.3
Weak to moderate correlation: 0.3 - 0.5
Moderate to high correlation: 0.5 - 0.7
High to perfect correlation: 0.7 - 1
Remember to be careful about spurious correlations, which are strong correlations without a real causal relationship.
(1) www.tradingview.com

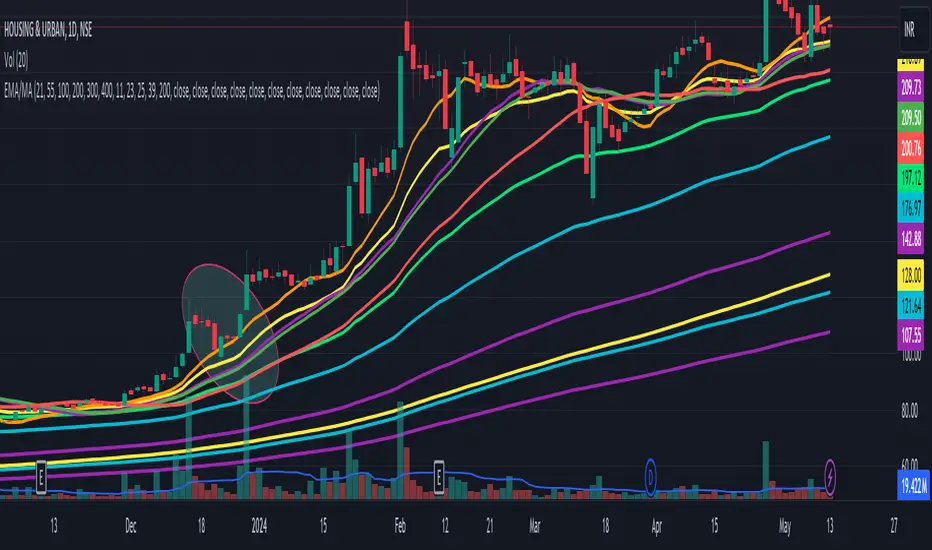
TradingCube : Moving Average : Data tablePlots moving average both EMA as well as SMA on Multiple timeframes at once in a Tabular Format
for rapid indication of momentum shift as well as slower-moving confirmations.
Displays EMA/SMA 5 8, 13, 21,34,55,89,100,200,400 by default as well as provide the users the flexibility to choose the timeframe as per their set up.

Annual Returns % Comparison [By MUQWISHI]Overview
The Annual Returns % Comparison indicator aimed to compare the historical annual percentage change of any two symbols. The indicator output shows a column-plot that was developed by two using a pine script table, so each period has pair columns showing the yearly percentage change for entered symbols.
Features
- Enter date range.
- Fill up with any two symbols.
- Choose the output data whether adjusted or not.
- Change the location of the table plot
- Color columns by a symbol.
- Size the height and width of columns.
- Color background, border, and text.
- The tooltip of the column value appears once the cursor sets above the specific column. As it seen below.
Let me know if you have any questions.
Thanks.

Mtf Supertrend Table
english
It is a study of how the supertrend indicator looks on multiple timeframes. You can see the Supertrend direction in Multiple Timeframes by looking at the chart
Türkçe
supertrend indikatörünün çoklu zaman dilimdlerinde nasıl göründüğü yönünde bir çalışmadır. Tabloya bakarak Çoklu Zaman dilimlerinde Supertrend yönünü görebilirsiniz

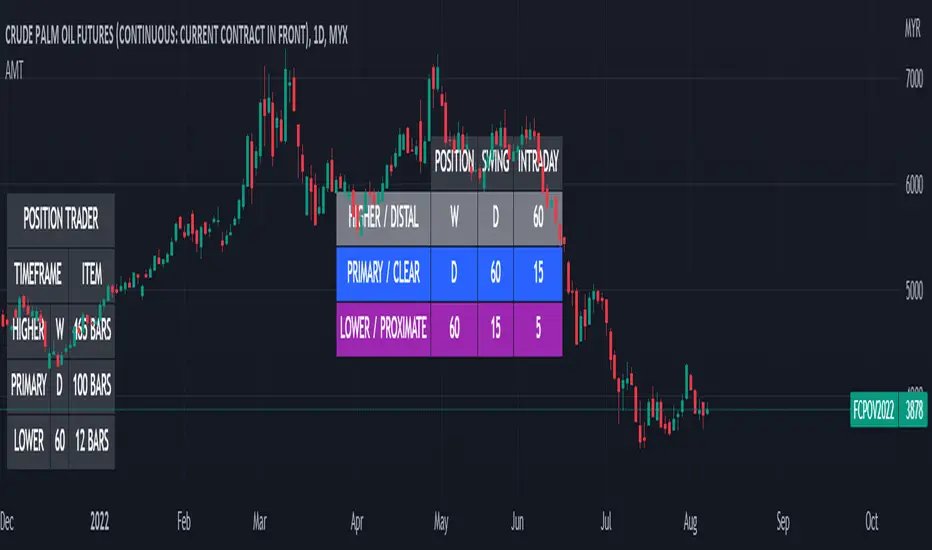
Alternative MTF Table█ OVERVIEW
This indicator is an educational indicator which was stripped down from Regression Channel Alternative MTF to display 3 timeframes based on timeframe scenarios.
The timeframe scenarios are defined based on Position, Swing and Intraday Trader.
█ INSPIRATION
It is possible to use array.new_bool, array.indexof and switch to get this outcome. Credits to TradingView .
Stock Strength Index by zdmreThe basic idea behind indicators is "to buy the strong one and to sell the weak one". This indicator yield entry and exit signals for stock trading.
You can view the STRENGTH INDEX for the symbol you want in this indicator.
Formula
(X - ((RMA(t-1) * (n-1)) + X(t)) / n) / X * 100
n = The length of the Moving Average (defval = 200)
X = Price
t = Timeframe
#DYOR

Strategy BackTest Display Statistics - TraderHalaiThis script was born out of my quest to be able to display strategy back test statistics on charts to allow for easier backtesting on devices that do not natively support backtest engine (such as mobile phones, when I am backtesting from away from my computer). There are already a few good ones on TradingView, but most / many are too complicated for my needs.
Found an excellent display backtest engine by 'The Art of Trading'. This script is a snippet of his hard work, with some very minor tweaks and changes. Much respect to the original author.
Full credit to the original author of this script. It can be found here: www.tradingview.com
I decided to modify the script by simplifying it down and make it easier to integrate into existing strategies, using simple copy and paste, by relying on existing tradingview strategy backtester inputs. I have also added 3 additional performance metrics:
- Max Run Up
- Average Win per trade
- Average Loss per trade
As this is a work in progress, I will look to add in more performance metrics in future, as I further develop this script.
Feel free to use this display panel in your scripts and strategies.
Thanks and enjoy :)

SST Table NewData Table for Update GTT Orders in Stocks....
Updated GTT Order details for SST , also added Relative Strength of Stock compared with NIFTY Index for 55 Days (3 Months) period.
RS line plotted on chart… taken reference of close price of day candle… just a bigger picture of actual RS indicator plotted on chart itself... RS line in red color means below zero line (negative) and green color means above zero line (positive).
Added code for checking RS value on chart for any previous day.

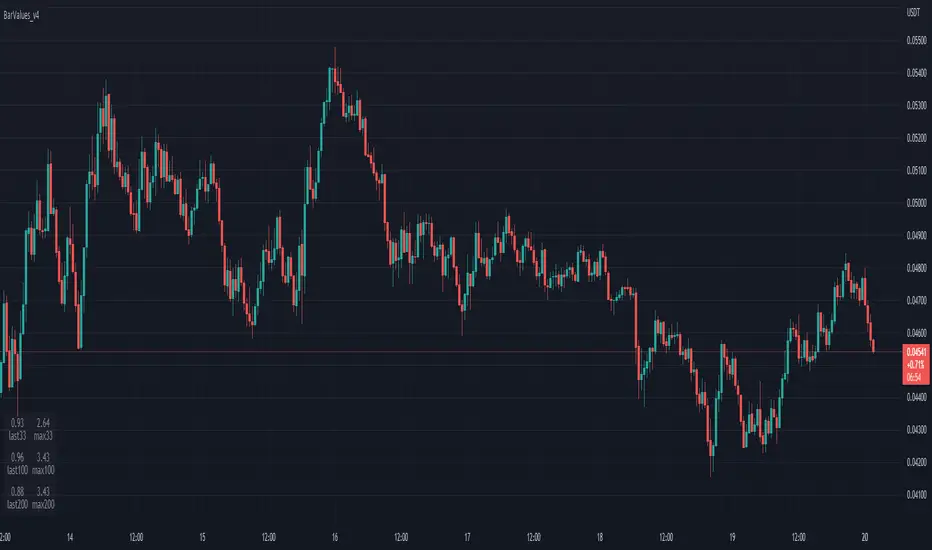
TableBarValues_v4It give you the absolute value of bar changes for different period of tims (33, 100, 200) AND the max barchange ont the same period.
Can be added in v4 in all codes. Stupid but useful.
You can add it to any v4 script. The location of the table can be changed easily
Inspired from the tradingview community. Don't forget to hydrate. @Magnumm

EPS TableEPS Table for tracking Earning per share
This can be useful for Techo- a fundamental analyst,
If you want more Tables on the fundamental or technical analysis you can contact me here.
DeleteArrayObject█ OVERVIEW
Delete array object according to array size such as label, line, linefill, box and table.
█ CREDITS
HeWhoMustNotBeNamed

Harmonic Table Combo Point B█ OVERVIEW
This indicator was intended as educational purpose only and alternative way to show value in table as shown in Harmonic Pattern Possibility Table .
█ CREDITS
Credit to Scott M Carney, Harmonic Trading Volume 3: Reaction vs. Reversal.
█ USAGE EXAMPLE

Harmonic Pattern Possibility Table█ OVERVIEW
This indicator was intended as educational purpose only based on Harmonic Pattern Table (Source Code) and Ratio For Harmonic Points to show Harmonic Pattern Possibility.
█ INSPIRATION
This indicator was build upon realizing there are some overlap for B = XA among Alternate Bat, Bat, Crab and Gartley.
Hence, the values split up to showcase the possibility of non overlap ratio.
█ USAGE
Possible pattern, priority pattern and selected pattern may differs based value input.
Therefore C = AB, D = BC, D = XA and Stop Loss will change based value input and also selected pattern.
█ CREDITS
Credit to Scott M Carney, Harmonic Trading Volume 3: Reaction vs. Reversal.

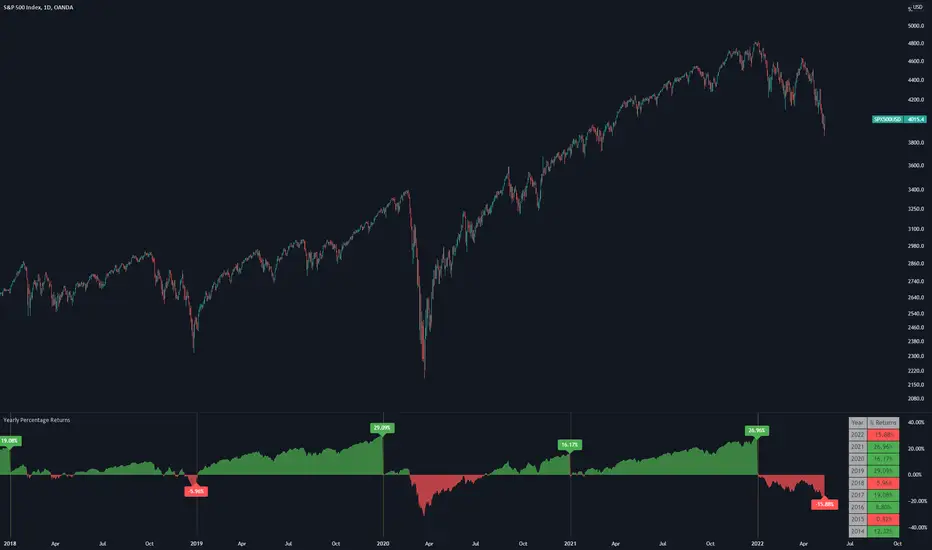
Yearly Percentage ReturnsAn indicator that lets you visualize the historical Yearly Percentage returns of any symbol .
Key Features:
Displays the yearly returns from start to end of each year
Displays a table showing all yearly returns for current symbol
Displays start of each year as a vertical line
Displays up to 5 custom horizontal levels
Table Settings:
Enable table - Show/Hide the table
Size - Sets the size of the table
Position - Sets the position of the table on the screen
Direction - Sets the direction of the table to display the data (Vertically or Horizontally)
[HELPER] Math Constant Helper█ OVERVIEW
This indicator is to show constant in table using built-in math name space, coded in latest Pine Script version 5.
█ CREDITS
Credits to PineCoders.
█ FEATURES
- Display table by changing table position, font size and color.

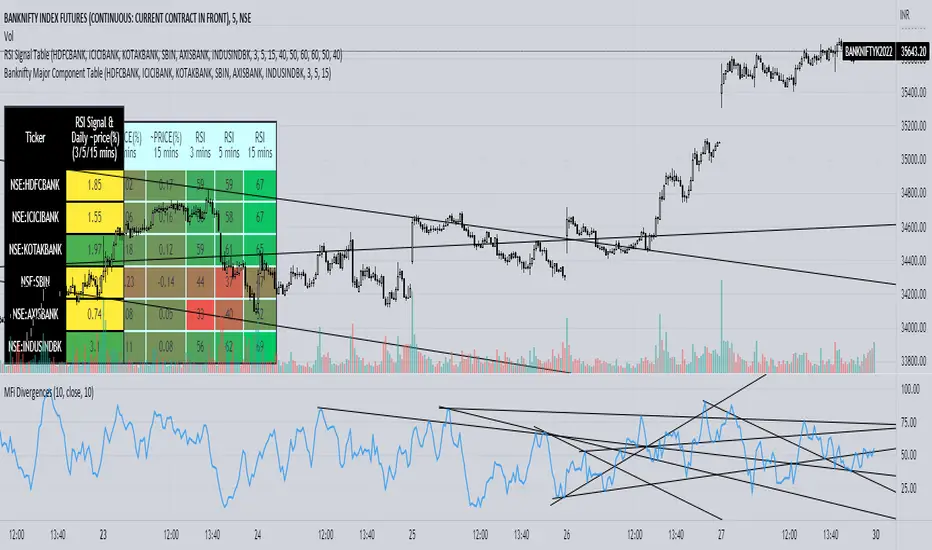
Banknifty Major Component TableThe table presented here is comprised of major Banknifty Index constituents showing price change in percentage terms and RSI value of three different timeframes to gauge overall Banknifty sentiment. This table is primarily created to cater scalpers and day traders. It helps traders to see market activity at a glance.
Strategy Table LibraryLibrary "table_library"
TODO: With this library, you can add tables to your strategies.
strategy_table()
Returns: Strategy Profit Table
Adds a table to the graph of the strategy for which you are calling the function. You can see data such as net profit in this table.
No parameters. Just call the function inside the strategy.
Example Code :
import only_fibonacci/table_lib/1 as st
st.strategy_table()

Selamat Hari RayaA fun way to express Selamat Aidil Fitri to all muslims.
Selamat Hari Raya Aidil Fitri
Maaf Zahir Dan Batin.

Multiple Indicator 50EMA Cross AlertsHere’s a screener including Symbol, Price, TSI, and 50 ema cross in a table output.
The 50 Exponential Moving Average is a trend indicator
You can find bullish momentum when the 50 ema crossed over or a bearish momentum when the 50 ema crossed under we are looking to take advantage by trading the reversion of these trends.
True strength index (TSI) is a trend momentum indicator
Readings are bullish when the True Strength Index shows positive values
Readings are bearish when the indicator displays negative values.
When a value is above 20, we look for selling overbought opportunity and when the value is under 20, we look for buying oversold opportunity.
You can select the pair of your choice in the settings.
Make sure to create an alert and choose any alerts then an alert will trigger when a price cross under or cross over the 50 ema for every pair separately.
This allow the user to verify if there is a trade set up or not.
Disclaimer
This post and the script don’t provide any financial advice.
