Casa_TableLibrary "Casa_Table"
A powerful library for creating customizable tables from data arrays and matrices.
Features flexible formatting options including:
- Multiple function implementations for different levels of control
- Consistent column counts required across matrix rows
- Matching dimensions needed for color arrays/matrices
- Cell spanning capabilities across rows/columns
- Rich examples demonstrating proper data structure setup
The library makes it easy to transform your data into professional-looking
tables while maintaining full control over their visual appearance.
floatArrayToCellArray(floatArray)
Helper function that converts a float array to a Cell array so it can be rendered with the fromArray function
Parameters:
floatArray (array) : (array) the float array to convert to a Cell array.
Returns: array The Cell array to return.
stringArrayToCellArray(stringArray)
Helper function that converts a string array to a Cell array so it can be rendered with the fromArray function
Parameters:
stringArray (array) : (array) the array to convert to a Cell array.
Returns: array The Cell array to return.
floatMatrixToCellMatrix(floatMatrix)
Helper function that converts a float matrix to a Cell matrix so it can be rendered with the fromMatrix function
Parameters:
floatMatrix (matrix) : (matrix) the float matrix to convert to a string matrix.
Returns: matrix The Cell matrix to render.
stringMatrixToCellMatrix(stringMatrix)
Helper function that converts a string matrix to a Cell matrix so it can be rendered with the fromMatrix function
Parameters:
stringMatrix (matrix) : (matrix) the string matrix to convert to a Cell matrix.
Returns: matrix The Cell matrix to return.
fromMatrix(CellMatrix, position, verticalOffset, transposeTable, textSize, borderWidth, tableNumRows, blankCellText)
Takes a CellMatrix and renders it as a table.
Parameters:
CellMatrix (matrix) : (matrix) The Cells to be rendered in a table
position (string) : (string) Optional. The position of the table. Defaults to position.top_right
verticalOffset (int) : (int) Optional. The vertical offset of the table from the top or bottom of the chart. Defaults to 0.
transposeTable (bool) : (bool) Optional. Will transpose all of the data in the matrices before rendering. Defaults to false.
textSize (string) : (string) Optional. The size of text to render in the table. Defaults to size.small.
borderWidth (int) : (int) Optional. The width of the border between table cells. Defaults to 2.
tableNumRows (int) : (int) Optional. The number of rows in the table. Not required, defaults to the number of rows in the provided matrix. If your matrix will have a variable number of rows, you must provide the max number of rows or the function will error when it attempts to set a cell value on a row that the table hadn't accounted for when it was defined.
blankCellText (string) : (string) Optional. Text to use cells when adding blank rows for vertical offsetting.
fromMatrix(dataMatrix, position, verticalOffset, transposeTable, textSize, borderWidth, tableNumRows, blankCellText)
Renders a float matrix as a table.
Parameters:
dataMatrix (matrix) : (matrix_float) The data to be rendered in a table
position (string) : (string) Optional. The position of the table. Defaults to position.top_right
verticalOffset (int) : (int) Optional. The vertical offset of the table from the top or bottom of the chart. Defaults to 0.
transposeTable (bool) : (bool) Optional. Will transpose all of the data in the matrices before rendering. Defaults to false.
textSize (string) : (string) Optional. The size of text to render in the table. Defaults to size.small.
borderWidth (int) : (int) Optional. The width of the border between table cells. Defaults to 2.
tableNumRows (int) : (int) Optional. The number of rows in the table. Not required, defaults to the number of rows in the provided matrix. If your matrix will have a variable number of rows, you must provide the max number of rows or the function will error when it attempts to set a cell value on a row that the table hadn't accounted for when it was defined.
blankCellText (string) : (string) Optional. Text to use cells when adding blank rows for vertical offsetting.
fromMatrix(dataMatrix, position, verticalOffset, transposeTable, textSize, borderWidth, tableNumRows, blankCellText)
Renders a string matrix as a table.
Parameters:
dataMatrix (matrix) : (matrix_string) The data to be rendered in a table
position (string) : (string) Optional. The position of the table. Defaults to position.top_right
verticalOffset (int) : (int) Optional. The vertical offset of the table from the top or bottom of the chart. Defaults to 0.
transposeTable (bool) : (bool) Optional. Will transpose all of the data in the matrices before rendering. Defaults to false.
textSize (string) : (string) Optional. The size of text to render in the table. Defaults to size.small.
borderWidth (int) : (int) Optional. The width of the border between table cells. Defaults to 2.
tableNumRows (int) : (int) Optional. The number of rows in the table. Not required, defaults to the number of rows in the provided matrix. If your matrix will have a variable number of rows, you must provide the max number of rows or the function will error when it attempts to set a cell value on a row that the table hadn't accounted for when it was defined.
blankCellText (string) : (string) Optional. Text to use cells when adding blank rows for vertical offsetting.
fromArray(dataArray, position, verticalOffset, transposeTable, textSize, borderWidth, blankCellText)
Renders a Cell array as a table.
Parameters:
dataArray (array) : (array) The data to be rendered in a table
position (string) : (string) Optional. The position of the table. Defaults to position.top_right
verticalOffset (int) : (int) Optional. The vertical offset of the table from the top or bottom of the chart. Defaults to 0.
transposeTable (bool) : (bool) Optional. Will transpose all of the data in the matrices before rendering. Defaults to false.
textSize (string) : (string) Optional. The size of text to render in the table. Defaults to size.small.
borderWidth (int) : (int) Optional. The width of the border between table cells. Defaults to 2.
blankCellText (string) : (string) Optional. Text to use cells when adding blank rows for vertical offsetting.
fromArray(dataArray, position, verticalOffset, transposeTable, textSize, borderWidth, blankCellText)
Renders a string array as a table.
Parameters:
dataArray (array) : (array_string) The data to be rendered in a table
position (string) : (string) Optional. The position of the table. Defaults to position.top_right
verticalOffset (int) : (int) Optional. The vertical offset of the table from the top or bottom of the chart. Defaults to 0.
transposeTable (bool) : (bool) Optional. Will transpose all of the data in the matrices before rendering. Defaults to false.
textSize (string) : (string) Optional. The size of text to render in the table. Defaults to size.small.
borderWidth (int) : (int) Optional. The width of the border between table cells. Defaults to 2.
blankCellText (string) : (string) Optional. Text to use cells when adding blank rows for vertical offsetting.
fromArray(dataArray, position, verticalOffset, transposeTable, textSize, borderWidth, blankCellText)
Renders a float array as a table.
Parameters:
dataArray (array) : (array_float) The data to be rendered in a table
position (string) : (string) Optional. The position of the table. Defaults to position.top_right
verticalOffset (int) : (int) Optional. The vertical offset of the table from the top or bottom of the chart. Defaults to 0.
transposeTable (bool) : (bool) Optional. Will transpose all of the data in the matrices before rendering. Defaults to false.
textSize (string) : (string) Optional. The size of text to render in the table. Defaults to size.small.
borderWidth (int) : (int) Optional. The width of the border between table cells. Defaults to 2.
blankCellText (string) : (string) Optional. Text to use cells when adding blank rows for vertical offsetting.
debug(message, position)
Renders a debug message in a table at the desired location on screen.
Parameters:
message (string) : (string) The message to render.
position (string) : (string) Optional. The position of the debug message. Defaults to position.middle_right.
Cell
Type for each cell's content and appearance
Fields:
content (series string)
bgColor (series color)
textColor (series color)
align (series string)
colspan (series int)
rowspan (series int)
Tables
Futures Open/High/Low TablesAdds (up to) 3 tables to a chart, displaying Open/High/Low data for today (RTH and extended hours), yesterday, and the current week / month -- to help with intraday analysis of a futures ticker.
The tables only appear on intraday charts (5min, 30min, etc). On a Daily/Weekly/etc chart they are not calculated or shown.
In addition to Open/High/Low, the "Current" table in the top-right shows a live measurement of # of points from the open, the RTH open, and the highs/lows.
Lastly, the 9:30am ET open and the 4pm RTH close are by default marked with a shaded background (on intraday charts) for easy visual reference, and also to help with adjusting the session time to accommodate time zone issues if they occur.
Tested on ES in Eastern Time Zone, but should work on any futures instrument and any time zone by adjusting the Session Time setting.

TableLibrary "Table"
This library provides an easy way to convert arrays and matrixes of data into tables. There are a few different implementations of each function so you can get more or less control over the appearance of the tables. The basic rule of thumb is that all matrix rows must have the same number of columns, and if you are providing multiple arrays/matrixes to specify additional colors (background/text), they must have the same number of rows/columns as the data array. Finally, you do have the option of spanning cells across rows or columns with some special syntax in the data cell. Look at the examples to see how the arrays and matrixes need to be built before they can be used by the functions.
floatArrayToCellArray(floatArray)
Helper function that converts a float array to a Cell array so it can be rendered with the fromArray function
Parameters:
floatArray (float ) : (array) the float array to convert to a Cell array.
Returns: array The Cell array to return.
stringArrayToCellArray(stringArray)
Helper function that converts a string array to a Cell array so it can be rendered with the fromArray function
Parameters:
stringArray (string ) : (array) the array to convert to a Cell array.
Returns: array The Cell array to return.
floatMatrixToCellMatrix(floatMatrix)
Helper function that converts a float matrix to a Cell matrix so it can be rendered with the fromMatrix function
Parameters:
floatMatrix (matrix) : (matrix) the float matrix to convert to a string matrix.
Returns: matrix The Cell matrix to render.
stringMatrixToCellMatrix(stringMatrix)
Helper function that converts a string matrix to a Cell matrix so it can be rendered with the fromMatrix function
Parameters:
stringMatrix (matrix) : (matrix) the string matrix to convert to a Cell matrix.
Returns: matrix The Cell matrix to return.
fromMatrix(CellMatrix, position, verticalOffset, transposeTable, textSize, borderWidth, tableNumRows, blankCellText)
Takes a CellMatrix and renders it as a table.
Parameters:
CellMatrix (matrix) : (matrix) The Cells to be rendered in a table
position (string) : (string) Optional. The position of the table. Defaults to position.top_right
verticalOffset (int) : (int) Optional. The vertical offset of the table from the top or bottom of the chart. Defaults to 0.
transposeTable (bool) : (bool) Optional. Will transpose all of the data in the matrices before rendering. Defaults to false.
textSize (string) : (string) Optional. The size of text to render in the table. Defaults to size.small.
borderWidth (int) : (int) Optional. The width of the border between table cells. Defaults to 2.
tableNumRows (int) : (int) Optional. The number of rows in the table. Not required, defaults to the number of rows in the provided matrix. If your matrix will have a variable number of rows, you must provide the max number of rows or the function will error when it attempts to set a cell value on a row that the table hadn't accounted for when it was defined.
blankCellText (string) : (string) Optional. Text to use cells when adding blank rows for vertical offsetting.
fromMatrix(dataMatrix, position, verticalOffset, transposeTable, textSize, borderWidth, tableNumRows, blankCellText)
Renders a float matrix as a table.
Parameters:
dataMatrix (matrix) : (matrix_float) The data to be rendered in a table
position (string) : (string) Optional. The position of the table. Defaults to position.top_right
verticalOffset (int) : (int) Optional. The vertical offset of the table from the top or bottom of the chart. Defaults to 0.
transposeTable (bool) : (bool) Optional. Will transpose all of the data in the matrices before rendering. Defaults to false.
textSize (string) : (string) Optional. The size of text to render in the table. Defaults to size.small.
borderWidth (int) : (int) Optional. The width of the border between table cells. Defaults to 2.
tableNumRows (int) : (int) Optional. The number of rows in the table. Not required, defaults to the number of rows in the provided matrix. If your matrix will have a variable number of rows, you must provide the max number of rows or the function will error when it attempts to set a cell value on a row that the table hadn't accounted for when it was defined.
blankCellText (string) : (string) Optional. Text to use cells when adding blank rows for vertical offsetting.
fromMatrix(dataMatrix, position, verticalOffset, transposeTable, textSize, borderWidth, tableNumRows, blankCellText)
Renders a string matrix as a table.
Parameters:
dataMatrix (matrix) : (matrix_string) The data to be rendered in a table
position (string) : (string) Optional. The position of the table. Defaults to position.top_right
verticalOffset (int) : (int) Optional. The vertical offset of the table from the top or bottom of the chart. Defaults to 0.
transposeTable (bool) : (bool) Optional. Will transpose all of the data in the matrices before rendering. Defaults to false.
textSize (string) : (string) Optional. The size of text to render in the table. Defaults to size.small.
borderWidth (int) : (int) Optional. The width of the border between table cells. Defaults to 2.
tableNumRows (int) : (int) Optional. The number of rows in the table. Not required, defaults to the number of rows in the provided matrix. If your matrix will have a variable number of rows, you must provide the max number of rows or the function will error when it attempts to set a cell value on a row that the table hadn't accounted for when it was defined.
blankCellText (string) : (string) Optional. Text to use cells when adding blank rows for vertical offsetting.
fromArray(dataArray, position, verticalOffset, transposeTable, textSize, borderWidth, blankCellText)
Renders a Cell array as a table.
Parameters:
dataArray (Cell ) : (array) The data to be rendered in a table
position (string) : (string) Optional. The position of the table. Defaults to position.top_right
verticalOffset (int) : (int) Optional. The vertical offset of the table from the top or bottom of the chart. Defaults to 0.
transposeTable (bool) : (bool) Optional. Will transpose all of the data in the matrices before rendering. Defaults to false.
textSize (string) : (string) Optional. The size of text to render in the table. Defaults to size.small.
borderWidth (int) : (int) Optional. The width of the border between table cells. Defaults to 2.
blankCellText (string) : (string) Optional. Text to use cells when adding blank rows for vertical offsetting.
fromArray(dataArray, position, verticalOffset, transposeTable, textSize, borderWidth, blankCellText)
Renders a string array as a table.
Parameters:
dataArray (string ) : (array_string) The data to be rendered in a table
position (string) : (string) Optional. The position of the table. Defaults to position.top_right
verticalOffset (int) : (int) Optional. The vertical offset of the table from the top or bottom of the chart. Defaults to 0.
transposeTable (bool) : (bool) Optional. Will transpose all of the data in the matrices before rendering. Defaults to false.
textSize (string) : (string) Optional. The size of text to render in the table. Defaults to size.small.
borderWidth (int) : (int) Optional. The width of the border between table cells. Defaults to 2.
blankCellText (string) : (string) Optional. Text to use cells when adding blank rows for vertical offsetting.
fromArray(dataArray, position, verticalOffset, transposeTable, textSize, borderWidth, blankCellText)
Renders a float array as a table.
Parameters:
dataArray (float ) : (array_float) The data to be rendered in a table
position (string) : (string) Optional. The position of the table. Defaults to position.top_right
verticalOffset (int) : (int) Optional. The vertical offset of the table from the top or bottom of the chart. Defaults to 0.
transposeTable (bool) : (bool) Optional. Will transpose all of the data in the matrices before rendering. Defaults to false.
textSize (string) : (string) Optional. The size of text to render in the table. Defaults to size.small.
borderWidth (int) : (int) Optional. The width of the border between table cells. Defaults to 2.
blankCellText (string) : (string) Optional. Text to use cells when adding blank rows for vertical offsetting.
debug(message, position)
Renders a debug message in a table at the desired location on screen.
Parameters:
message (string) : (string) The message to render.
position (string) : (string) Optional. The position of the debug message. Defaults to position.middle_right.
Cell
Type for each cell's content and appearance
Fields:
content (series string)
bgColor (series color)
textColor (series color)
align (series string)
colspan (series int)
rowspan (series int)

Crypto Daily WatchList And Screener [M]
Hi, this is a watchlist and screener indicator designed for traders in the field of cryptocurrencies who want to monitor developments in other currency pairs and indices.
The indicator consists of two tables. One of them is the table containing indices such as BTC dominance, total, total2, which allows you to track market developments and changes. In this table, you will find price information, daily change, stochastic, and trend information.
The other table includes cryptocurrencies like BTC/USDT, ETH/USDT, DOT/USDT, and more. In this table, you will see real-time prices, daily volume, daily change, stochastic, the correlation coefficient between the pair and Bitcoin, and the trend value calculated based on MACD.
The "Customize" section in the settings enables you to personalize the appearance of the tables according to your preferences.

Cobra's CryptoMarket VisualizerCobra's Crypto Market Screener is designed to provide a comprehensive overview of the top 40 marketcap cryptocurrencies in a table\heatmap format. This indicator incorporates essential metrics such as Beta, Alpha, Sharpe Ratio, Sortino Ratio, Omega Ratio, Z-Score, and Average Daily Range (ADR). The table utilizes cell coloring resembling a heatmap, allowing for quick visual analysis and comparison of multiple cryptocurrencies.
The indicator also includes a shortened explanation tooltip of each metric when hovering over it's respected cell. I shall elaborate on each here for anyone interested.
Metric Descriptions:
1. Beta: measures the sensitivity of an asset's returns to the overall market returns. It indicates how much the asset's price is likely to move in relation to a benchmark index. A beta of 1 suggests the asset moves in line with the market, while a beta greater than 1 implies the asset is more volatile, and a beta less than 1 suggests lower volatility.
2. Alpha: is a measure of the excess return generated by an investment compared to its expected return, given its risk (as indicated by its beta). It assesses the performance of an investment after adjusting for market risk. Positive alpha indicates outperformance, while negative alpha suggests underperformance.
3. Sharpe Ratio: measures the risk-adjusted return of an investment or portfolio. It evaluates the excess return earned per unit of risk taken. A higher Sharpe ratio indicates better risk-adjusted performance, as it reflects a higher return for each unit of volatility or risk.
4. Sortino Ratio: is a risk-adjusted measure similar to the Sharpe ratio but focuses only on downside risk. It considers the excess return per unit of downside volatility. The Sortino ratio emphasizes the risk associated with below-target returns and is particularly useful for assessing investments with asymmetric risk profiles.
5. Omega Ratio: measures the ratio of the cumulative average positive returns to the cumulative average negative returns. It assesses the reward-to-risk ratio by considering both upside and downside performance. A higher Omega ratio indicates a higher reward relative to the risk taken.
6. Z-Score: is a statistical measure that represents the number of standard deviations a data point is from the mean of a dataset. In finance, the Z-score is commonly used to assess the financial health or risk of a company. It quantifies the distance of a company's financial ratios from the average and provides insight into its relative position.
7. Average Daily Range: ADR represents the average range of price movement of an asset during a trading day. It measures the average difference between the high and low prices over a specific period. Traders use ADR to gauge the potential price range within which an asset might fluctuate during a typical trading session.
Utility:
Comprehensive Overview: The indicator allows for monitoring up to 40 cryptocurrencies simultaneously, providing a consolidated view of essential metrics in a single table.
Efficient Comparison: The heatmap-like coloring of the cells enables easy visual comparison of different cryptocurrencies, helping identify relative strengths and weaknesses.
Risk Assessment: Metrics such as Beta, Alpha, Sharpe Ratio, Sortino Ratio, and Omega Ratio offer insights into the risk associated with each cryptocurrency, aiding risk assessment and portfolio management decisions.
Performance Evaluation: The Alpha, Sharpe Ratio, and Sortino Ratio provide measures of a cryptocurrency's performance adjusted for risk. This helps assess investment performance over time and across different assets.
Market Analysis: By considering the Z-Score and Average Daily Range (ADR), traders can evaluate the financial health and potential price volatility of cryptocurrencies, aiding in trade selection and risk management.
Features:
Reference period optimization, alpha and ADR in particular
Source calculation
Table sizing and positioning options to fit the user's screen size.
Tooltips
Important Notes -
1. The Sharpe, Sortino and Omega ratios cell coloring threshold might be subjective, I did the best I can to gauge the median value of each to provide more accurate coloring sentiment, it may change in the future.
The median values are : Sharpe -1, Sortino - 1.5, Omega - 20.
2. Limitations - Some cryptos have a Z-Score value of NaN due to their short lifetime, I tried to overcome this issue as with the rest of the metrics as best I can. Moreover, it limits the time horizon for replay mode to somewhere around Q3 of 2021 and that's with using the split option of the top half, to remain with the older cryptos.
3. For the beginner Pine enthusiasts, I recommend scimming through the script as it serves as a prime example of using key features, to name a few : Arrays, User Defined Functions, User Defined Types, For loops, Switches and Tables.
4. Beta and Alpha's benchmark instrument is BTC, due to cryptos volatility I saw no reason to use SPY or any other asset for that matter.

Cleaner Screeners LibraryLibrary "cleanscreens"
Screener Panel.
This indicator displays a panel with a list of symbols and their indications.
It can be used as a screener for multiple timess and symbols
in any timeframe and with any indication in any combination.
#### Features
Multiple timeframes
Multiple symbols
Multiple indications per group
Vertical or horizontal layouts
Acceepts External Inputs
Customizable colors with 170 presets included (dark and light)
Customizable icons
Customizable text size and font
Customizable cell size width and height
Customizable frame width and border width
Customizable position
Customizable strong and weak values
Accepts any indicator as input
Only 4 functions to call, easy to use
#### Usage
Initialize the panel with _paneel = cleanscreens.init()
Add groupd with _screener = cleanscreens.Screener(_paneel, "Group Name")
Add indicators to screeener groups with cleanscreens.Indicator(_screener, "Indicator Name", _source)
Update the panel with cleanscreens.display(_paneel)
Thanks @ PineCoders , and the Group members for setting the bar high.
# local setup for methods on our script
import kaigouthro/cleanscreen/1
method Screener ( panel p, string _name) => cleanscreens.Screener ( p, _name)
method Indicator ( screener s , string _tf, string name, float val) => cleanscreens.Indicator ( s , _tf, name, val)
method display ( panel p ) => cleanscreens.display ( p )
init(_themein, loc)
# Panel init
> init a panel for all the screens
Parameters:
_themein (string) : string: Theme Preset Name
loc (int) : int :
1 = left top,
2 = middle top,
3 = right top,
4 = left middle,
5 = middle middle,
6 = right middle,
7 = left bottom,
8 = middle bottom,
9 = right bottom
Returns: panel
method Screener(p, _name)
# Screener - Create a new screener
### Example:
cleanscreens.new(panel, 'Crpyto Screeners')
Namespace types: panel
Parameters:
p (panel)
_name (string)
method Indicator(s, _tf, name, val)
# Indicator - Create a new Indicator
### Example:
cleanscreens.Inidcator('1h', 'RSI', ta.rsi(close, 14))
Namespace types: screener
Parameters:
s (screener)
_tf (string)
name (string)
val (float)
method display(p)
# Display - Display the Panel
### Example:
cleanscreens.display(panel)
Namespace types: panel
Parameters:
p (panel)
indication
single indication for a symbol screener
Fields:
name (series string)
icon (series string)
rating (series string)
value (series float)
col (series color)
tf (series string)
tooltip (series string)
normalized (series float)
init (series bool)
screener
single symbol screener
Fields:
ticker (series string)
icon (series string)
rating (series string)
value (series float)
bg (series color)
fg (series color)
items (indication )
init (series bool)
config
screener configuration
Fields:
strong (series float)
weak (series float)
theme (series string)
vert (series bool)
cellwidth (series float)
cellheight (series float)
textsize (series string)
font (series int)
framewidth (series int)
borders (series int)
position (series string)
icons
screener Icons
Fields:
buy (series string)
sell (series string)
strong (series string)
panel
screener panel object
Fields:
items (screener )
table (series table)
config (config)
theme (theme type from kaigouthro/theme_engine/1)
icons (icons)

Multiple Moving Average ToolkitFeatures Overview:
Multiple Moving Averages: The script allows you to plot up to five different Moving Averages (MAs) on your chart at the same time. You can choose the type of MA (EMA, SMA, HMA, WMA, DEMA, VWMA, VWAP) and the length of each one.
Color Ribbon: You can turn the MAs into a color ribbon by selecting the "Turn into Color Ribbon?" option. This will make the area between the MAs colored and can help you identify trends more easily.
MA Value Table: You can draw a table on your chart that displays the current values of each MA, whether the trend is bullish or bearish along with the length of the MAs. The current ATR value is also shown in the last cell of the table. You can choose the location of the table (Top Left, Top Right, Bottom Left, Bottom Right) and the transparency of the background color.
Crosses: The script can detect when two MAs cross over each other (1st MA crosses 5th MA and vice versa), indicating a potential trend reversal. It will plot crosses on the chart at the point of the crossover and give an alert if the "Bullish Cross Detected" or "Bearish Cross Detected" condition is met.
How to use:
Once the script is added to your chart, you can customize the settings to fit your preferences. You can choose the type and length of each MA, whether to turn them into a color ribbon, whether to plot crosses, and whether to draw the MA Value Table.
The MA Value Table can be moved to a different location on the chart by selecting the "Location of Table" option and choosing Top Left, Top Right, Bottom Left, or Bottom Right.
Watch for MA crossovers and alerts to identify potential trend reversals. The script can help you identify bullish and bearish trends by color-coding the area between the MAs and displaying the current values of each MA in the table.
Breakdown of the script:
User Inputs
The first section of the script defines several user inputs that allows you to customize the indicator. These include options for turning the MAs into a color ribbon, plotting crosses when there is a bullish or bearish cross of the MAs, drawing a table of the MA values, and setting the transparency of the ribbon. You can also select the location of the MA value table and customize the settings for each individual MA.
Moving Average Calculation
The script defines a function called "getMA" that calculates the moving average for a given type and length. The function uses a switch statement to determine which type of moving average to use, such as an exponential moving average (EMA), simple moving average (SMA), Hull moving average (HMA), weighted moving average (WMA), double exponential moving average (DEMA), volume-weighted moving average (VWMA), or volume-weighted average price (VWAP).
The script then calls this function to calculate the values of up to five different MAs, depending on the user input. The ATR (average true range) is also calculated using the TA library.
Color Filter and Cross Detection
The script sets a color filter based on the relationship between the MAs. If the shorter-term MAs are above the longer-term MAs, the filter is set to green to indicate a bullish trend, and if the shorter-term MAs are below the longer-term MAs, the filter is set to red to indicate a bearish trend. You can adjust the transparency of the ribbon to make it more or less visible.
The script also detects when there is a bullish or bearish cross of the MAs and can generate alerts to notify you.
MA Plotting
The script plots up to five MAs on the chart, depending on the user input. The MAs are plotted as lines with different colors and thicknesses, and you can choose to turn them into a color ribbon if desired.
Cross Plotting
The script plots crosses on the chart when there is a bullish or bearish cross of the MAs. The crosses are plotted as X shapes at the location of the cross and are color-coded to indicate the direction of the cross.
MA Value Table
Finally, the script draws a table of the MA values on the chart, displaying the values of each MA as well as the current trend and the ATR. You can customize the location of the table, and the table is colored to match the color filter of the MAs.
Feel free to message me or comment on the post with any questions or issues!
Much more to come!
Thanks for reading, enjoy!

MA Band Distance Monitor'MA Band Distance Monitor' indicator is a simple tool for traders who rely on moving averages to make trading decisions. This indicator plots two moving averages of your choice (you can select the type of the moving average), and fills the space between them, creating a "band".
The indicator also generates a table that displays the current price distance from both the fast and slow moving averages, as well as the average of the two. This allows you to quickly assess the strength of the trend and potential entry or exit points.
In addition, the table also shows the average price distance from one to another MA and also the current distance between them, allowing you to compare the current price action to the historical average. This information can help you identify potential trend reversals and assess the overall health of the market.
*** Slow length input must be greater than fast length input, otherwise indicator will produce faulty results

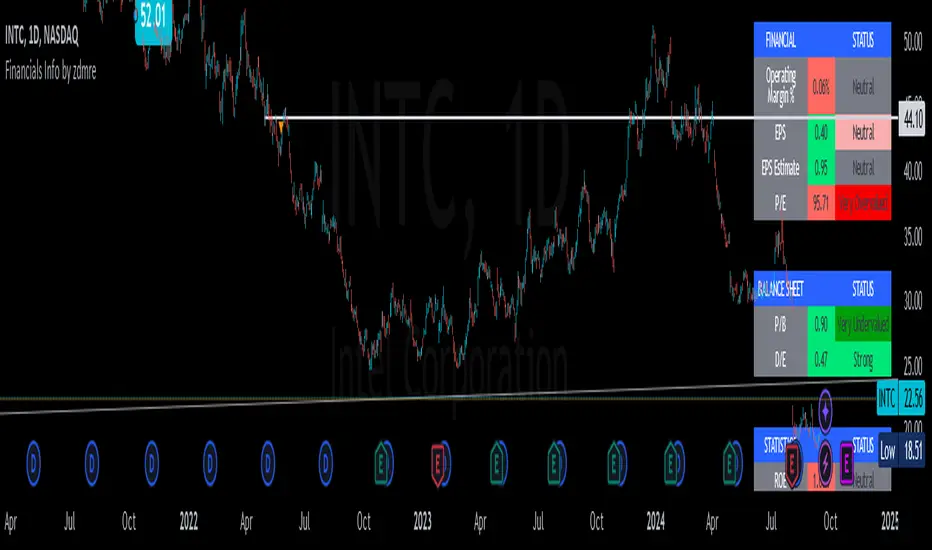
Financials - Comparing CompaniesHello All
For a while I have been working on this indicator to compare financials of the companies and sort them accordingly. Finally I completed and published it. I preferred using new object type feature in Pine language™ and I hope it might be an example and helpful for the developers.
First of all, as we have limitation on security calls, the indicator can get and compare financials for 5 companies only. also Chart time frame must be 1Day or higher! ( I recommend 1Day time frame ). if not then the indicator stops and shows the error message: "Please set the time frame 1Day or higher" . More important than others: You should choose the companies from the same sector! Compare apples to apples :)
The Financials in the indicator:
Earnings Per Share
Price to Earnings Ratio
Price to Sales Ratio
Price to Book Ratio
Profit Margin
Dept to Equity
Current Ratio
Market Capitalization
Also more information shown for each stocks:
Closing Price, sets the color accordingly
2 Simple/Exponential moving average, you can set the length, also it checks if it is rising/falling and sets the color accordingly
Volume info
Average volume (20 days), you can set the period
Currency for each security
Lets see some features in it:
it sorts the companies according to the financials:
If you move the mouse onto any header then it shows explanation about the financial:
You can change location and text size:
You can set the type of Moving averages as SMA or EMA and you can also set the length for both . Headers for both are changed automatically by MA type and length
Colors for Closing price and MA cells are set automatically:
For new Objects in Pine language click here
P.S. You can use this indicator while analyzing the financials of the companies in same sector/industry. So please don't ask for the alerts :)
Enjoy!

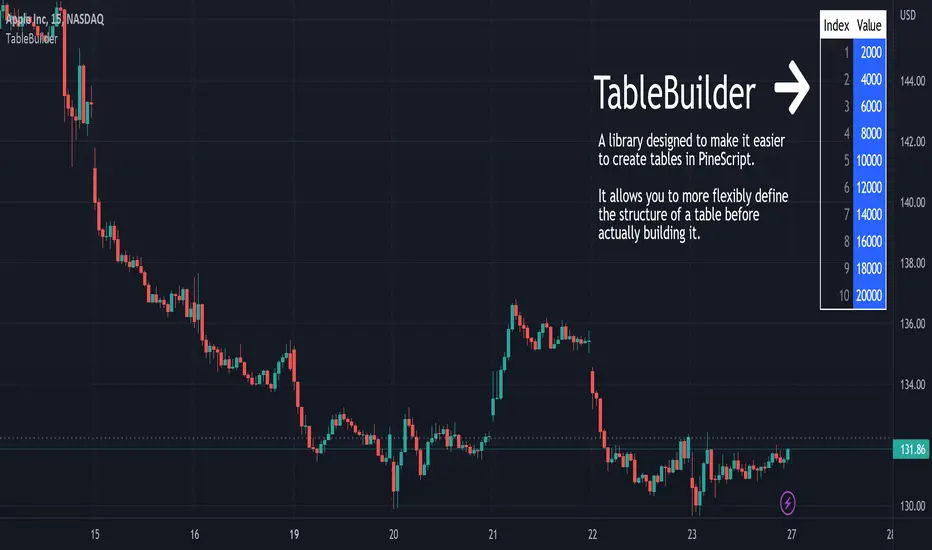
TableBuilderTableBuilder is a library designed to make it easier to create tables in PineScript.
It allows you to more flexibly define the structure of a table before actually building it.
Features:
Style inheritance: styles are inherited from Table, to Column, to Row, and then Cell.
Columns are useful for propagating/reusing style but they are not required.
Add rows with different numbers of cells. The resultant number of columns in the table will be determined by the max number of cells vs the number of defined columns.
Auto text color: Instead of having to set the font color for every cell, the color is automatically determined by the luminosity of the background color.
See the 'Demo' section of the code for an example.
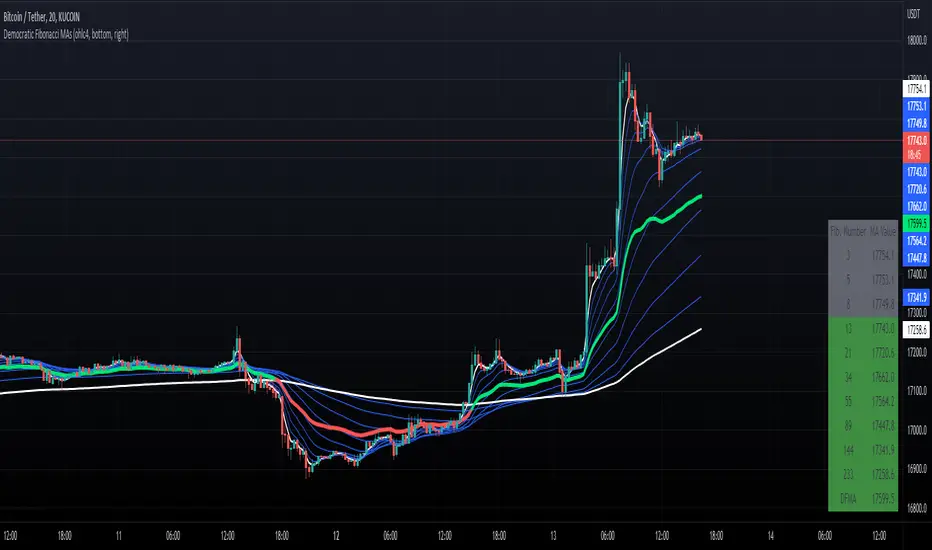
Democratic Fibonacci Moving AveragesWith this indicator, we have taken moving averages at Fibonacci lengths (3 to 233) as well as the average of these values, labeled the DFMA. Additionally, these values have been inputted into a table overlay. The cross of the FibMA(233) and the DFMA can be used as a signal for long or short.
The FibMA lengths of 3 and 233 are plotted in white by default, the FibMAs with lengths between 3 and 233 are plotted in blue by default, and the democratic line (DFMA) that averages these lines is plotted in green or red (depending on if the value is above or below the 233-length FibMA).
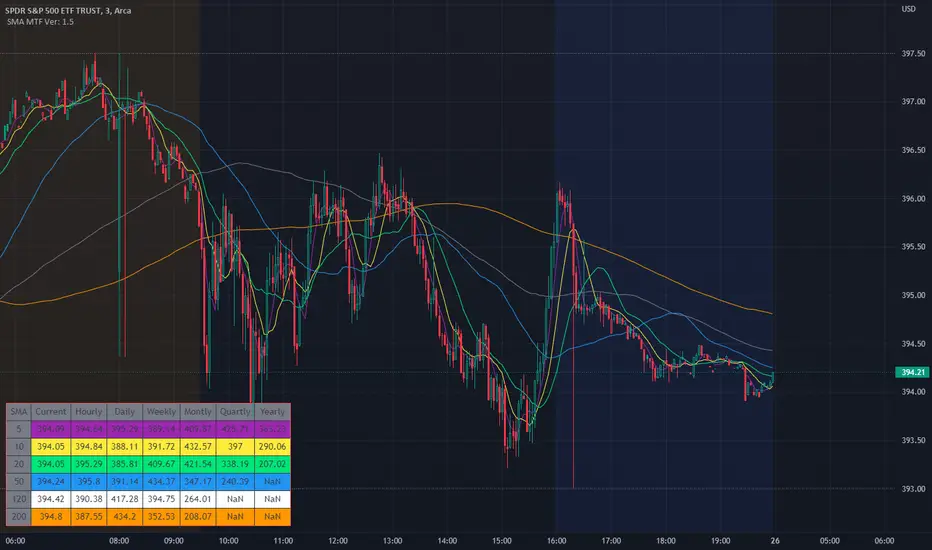
Multiple Moving Avg MTF TableThis script replaces the other script that was just the SMAs that where in a Multi Time Frame Table as this was a redo of that one and this one is SO MUCH MORE!!!!
Not only does this one do the Simple Moving Avg 5, 10, 20, 50, 120, 200 into a table that shows Current/Hourly/Daily/Weekly/Monthly/Quarterly ( 3M )/ Yearly. It now does Exponential Moving Avg , Weighted Moving Avg , and Volume Weight Moving Avg along with Simple Moving Avg.
I still use this script so that you can quickly capture the values so that short-term, and long-term resistance and support can be determined during market hours. Even better now you can select between SMA / EMA / WMA /or VWMA .
imgur.com
The table will change to the values based on the Choice of the type of Moving Avg and if you change the default values.
Now it will take a little bit for the table to show up, so please be patient. I have tested it with stocks, forex, and crypto.

SMA Multi Time Frame Table V1.5Since I couldn't find a script like this I made one so here is what it does.
The script will plot on the chart as well as post the related data into the table.
The default Simple Moving Avg are 5, 10, 20, 50, 120, 200 which can also be changed to whatever SMA you would like. The SMA values are then plotted on the charts so that quickly check to see where they are and how the candles are reacting to the SMAs.
Not only does the script plot the SMAs but it also places higher time frames into the table that is in the script, from current price, to daily, weekly, monthly, quarterly (3 months if you don't have it added) and yearly. The reason why was it price action of the stock does interact and can be rejected or find support from SMA on a higher time frames.
I still use this script so that you can quickly capture the values so that short-term, and long-term resistance and support can be determined during market hours.
Another good thing is that when you change the values in the script settings it also applies those settings to the table as well.
Now it will take a little bit for the table to show up, so please be patient. I have tested it with stocks, forex, and crypto.
I wanted to get this published and I am still working on the background to try and get EMAs. Where you can flip over to EMA to also see the EMA plots and table values for the MTF.
Financials Info by zdmreFundamentals provide a method to set the financial value of a company, security, or currency. Included in fundamental analysis is basic qualitative and quantitative information that contributes to the asset's financial or economic well-being. Macroeconomic fundamentals include topics that affect an economy at large. Microeconomic fundamentals focus on the activities within smaller segments of the economy. For businesses, information such as profitability, revenue, assets, liabilities, and growth potential are considered fundamentals
!!! When you change the values in the filter, you will see that the colors in the table change.
!!! Intrinsic Value Explained
There is no universal standard for calculating the intrinsic value of a company. The formula here is a partially differentiated version of the Ben Graham formula.
Formula;
Intrinsic value = Earning Per Share * MultiplierbySpecialRate * AveragePricetoEarnings * Power(Multiplier by SpecialRate, DiscountYear) * USMoneySupply2 / Power((1 + DiscountRate), DiscountYear) * USMoneySupply0
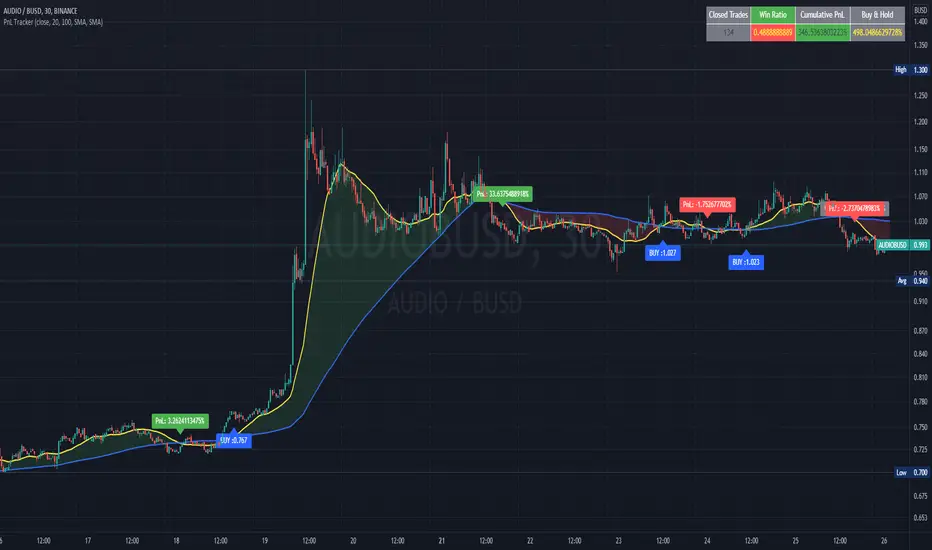
PnL and Buy & Hold TrackerIn this script I use a simple, not necessarily profitable, strategy of a cross of MAs to teach how to calculate and plot the PnL of each trade made by the indicator. I also show how to calculate the cumulative PnL of all trades and the Buy and Hold of the same period.
These calculations which are natively available in any strategy script, require a bit of resourcefulness to work in an indicator script.
It can be very useful to optimize parameters for the best performance of an indicator-based strategy.
I use variables to store the price of the asset at each buy signal to calculate the PnL with the closing price of that particular trade and another variable to store the price value of the first trade, which calculates the Buy and Hold percentage with the current price of the asset.
I plot the values of the trades in labels and the accumulated values in a table.
I also show how to calculate and plot the unrealized PnL of open trades.
Swing Dream - PAINT BARS | MA | EMA | DMA | VWAP | TABLE | ADR %- Swing Dream -
Script created for breakout-swing traders, in the style of QullaMaggie * , Dan Zanger, Oliver Kell, and Stockbee.
The following indicators are used by most successful breakout-swing traders such as mentioned above.
(As published) it contains:
Painted Bars, also known as inside/outside candles. Used for candle analysis and to determine breakout pivots & levels. For instance; use it in different timeframes and seek formations (ex, 3-1-2). For further inspiration, study Rob Smith's The Strat .
MA, Simple Moving Averages (Basic levels = 10,20,50,200). Use this indicator to define resistance/support areas as well as the overall long/swing-term trend. In breakout strategies such as EP, Flags, etc this can be used for trailing stops; an example, post-breakout, let the price ride the 20ma before exiting your position.
EMA, Exponential Moving Averages with periods inspired by Qullamaggie (10,20,65). Use this on shorter timeframes (ex, 1h) and for the same principles as MAs.
VWAP, Volume-Weighted Average Price. As for the previous, utilize this as a level indicator to find areas of resistance/support. Good for swing-trading as it implies whenever holders are profitable or not.
DMA, Displaced Moving Average (Horizontal). Personally, I use this a lot. Works very well for trailing stops (post breakout) and "bounce" areas. Choose your own offset and period.
ADR%, Average Daily Range Percentage. Displayed in the table and used to define a symbol's volatility. A very good tool for Qullamaggie-style trading. Personally, I try to find setups with over 6% ADR. Basic definition; low ADR% = Increased chance of a symbol to move slower and in smaller ranges. A higher value equals the opposite.
Table. A table with basic symbol-related information. Could save you plenty of time whenever you scan or search for new swing setups. Looking to add more features here.
Why should you use this script? Well, instead of having tens of different indicators, use this script and combine everything together with EP, Flag, or breakout principles. Suited for every plan, and more efficient in my opinion.
View settings to turn on/off different indicators.
* If you're looking for an introduction and further explanation of how Qullamaggie uses mentioned indicators, I could recommend checking out his website, stream, or participation in "Chat With Traders".
At last, I want to credit: @jkcqld @neolao @TheScrutiniser
This Script will get updated and improved.
// TechFille006

Simple Watchlist with % Change Screener & AlertsHi fellow traders..
TV has generously increased the number of alerts!!
A Simple Watchlist with heatmap based on % change on daily timeframe.
Gives % change and RSI
you can set the percentage in the input box and then set alerts on your favorite watchlist.
Alerts also include days high and low..
Simple Table and array based code.
set for scrip close >10 can be easily changed in line 43..
Hope you Like it!

OHLC-Tables New FeatureHello All,
The command shows the opening-high-low-closing-change values of that day based on the previous value in each period.
You can set the clock in any time zone you want.
You can use the indicator by adapting it wherever you want on your screen. You can adjust its position. Top-Left-Middle Left- Bottom Left/ Top Right-Middle Right- Bottom Right.
Although it is not a command with a Buy-Sell indicator, its user-friendliness and convenience were taken into account while developing it.
The purpose of the indicator is to allow you to consider the values while focusing not only on the chart you are watching.

Linear Regression & RSI Multi-Function Screener with Table-LabelHi fellow traders..
Happy to share a Linear Regression & RSI Multi-Function Custom Screener with Table-Labels...
The Screener scans for Linear Regression 2-SD Breakouts and RSI OB/OS levels for the coded tickers and gives Summary alerts
Uses Tables (dynamica resizing) for the scanner output instead of standard labels!
This Screener cum indicator collection has two distinct objectives..
1. Attempt re-entry into trending trades.
2. Attempt Counter trend trades using linear regression , RSI and Zigzag.
Briefly about the Screener functions..
a. It uses TABLES as Labels a FIRST for any Screener on TV.
b. Tables dynamically resize based on criteria..
c. Alerts for breakouts of the UPPER and the LOWER regression channels.(2 SD)
d. In addition to LinReg it also Screens RSI for OB/OS levels so a multifunction Screener.
e. Of course has the standard summary Alerts and programmable format for Custom functions.
f. Uses only the inbuilt Auto Fib and Lin Reg code for the screener.(No proprietary stuff)
g. The auto Zigzag code is derived(Auto fib).
Question what are all these doing in a single screener ??
ZigZag is very useful in determining Trend Up or Down from one Pivot to another.
So Once you have a firm view of the Current Trend for your chosen timeframe and ticker…
We can consider few possible trading scenarios..
a. Re-entry in an Up Trend - Combination of OS Rsi And a Lower Channel breach followed by a re-entry back into the regression channel CAN be used as an effective re-entry.
b. Similarily one can join a Down Trend on OB Rsi and Upper Channel line breach followed by re-entry into the regression channel.
If ZigZag signals a range-bound market, bound within channel lines then the Upper breakout can be used to Sell and vice-versa!
In short many possibilities for using these functions together with Scanner and Alerts.
This facilitates timely PROFITABLE Trending and Counter trend opportunities across multiple tickers.
You must give a thorough READ to the various available tutorials on ZigZag / Regression and Fib retracements before attempting counter trend trades using these tools!!
A small TIP – Markets are sideways or consolidating 70% of the time!!
Acknowledgements: - Thanks a lot DGTRD for the Auto ZigZag code and also for the eagerness to help wherever possible..Respect!!
Disclaimer: The Alerts and Screener are just few tools among many and not any kind of Buy/Sell recommendations. Unless you have sufficient trading experience please consult a Financial advisor before investing real money.
*The alerts are set for crossovers however for viewing tickers trading above or below the channel use code in line 343 and 344 after setting up the Alerts!
** RSI alerts are disabled by default to avoid clutter, but if needed one can activate code lines 441,442,444 and 445
Wish you all, Happy Profitable Trading!

SuperTrend - Custom Screener and Dynamic AlertsTrading View today published a desktop Bad Internet connection indicator ?! which set me thinking…
Despite recently introduced Dynamic Alerts many scripts do not leverage the information available for active traders and traders on the GO!
So decided to share this script totally ALERT focused on one of the most popular DAY trading indicators.
Of course no more BAD internet problem as long your TV APP is configured , you will have enough data for a mental picture of the chart..
The Alerts give you the BAR Close , %percent gain or loss over previous day CLOSE ++ Previous Day High and Low to effectively plan your trade without a chart!(just in case)
2 additions in the way Alerts are delivered over the last script :
1. You get SUMMARY alerts or concatenated alerts by default , however if you uncomment or activate code lines 48 and 55 you will get individual Stock alerts Too!
2. Summary Alerts will come only if there is some Buy or Sell signal NO more empty Alerts!
Few useful EXTRAS in the code :
1. Flexible code can convert any indicator to screener or Alert function.
2. You will NOT get Mutable Variable error while converting any indicator to screener as long as the function is in "GLOBAL" scope..
3. Many Custom Screeners are available but few give OHLC data in output so easily…and very difficult for traders to MODIFY hundreds of lines of code..
4. For UP or DOWN on SCREEN Stock monitoring copy /paste functions in line 41 and 42 in lieu of CROSS functions in 44 and 51 respectively..
5. You can also uncomment/activate lines 66 and 67 for labels in monitoring.
6. The default mode of the scripts is set to Alerts!
Max Stocks only 20!
Finally idea is to help traders to use the great features that TV works so hard to create and constantly improvise.
Enjoy Profitable Trading on the Fly !!

Technical Analysis Consulting Table (TACT)Inspired by Tradingview's own "Technical Analysis Summary", I present to you a table with analogous logic.
You can track any ticker you want, no matter your chart. You can even have multiple tables to track multiple tickers. By default it tracks the Total Crypto Cap.
You can change the resolution you want to track. By default it is the same as the chart.
You can position the table to whichever corner of the chart you want. By default it draws in the bottom right corner.
Background colors and text size can be adjusted.
Indicators Used:
Oscillators
RSI(14)
STOCH(14, 3, 3)
CCI(20)
ADX(14)
AO
Momentum(10)
MACD(12, 26)
STOCH RSI(3, 3, 14, 14)
%R(14)
Bull Bear Power
UO(7,14,28)
Moving Averages
EMA(5)
SMA(5)
EMA(10)
SMA(10)
EMA(20)
SMA(20)
EMA(30)
SMA(30)
EMA(50)
SMA(50)
EMA(100)
SMA(100)
EMA(200)
SMA(200)
Ichimoku Cloud(9, 26, 52, 26)
VMWA(20)
HMA(9)
Pivots
Traditional
Fibonacci
Camarilla
Woodie
WARNING: I have observed up to a couple of seconds of signal jitter/delay, so use it with caution in very small resolutions (1s to 1m).
I hope you enjoy this and good luck with your trading. Suggestions and feedback are most welcome.

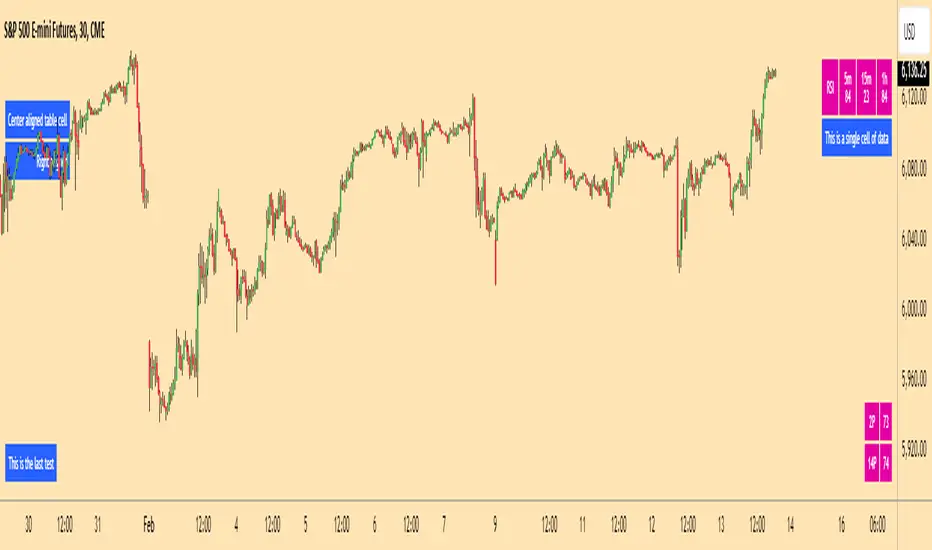
[edward_Z]Data tableThe purpose of this script is educational!
Create table with different inputs, various conditions, color changes, text format...
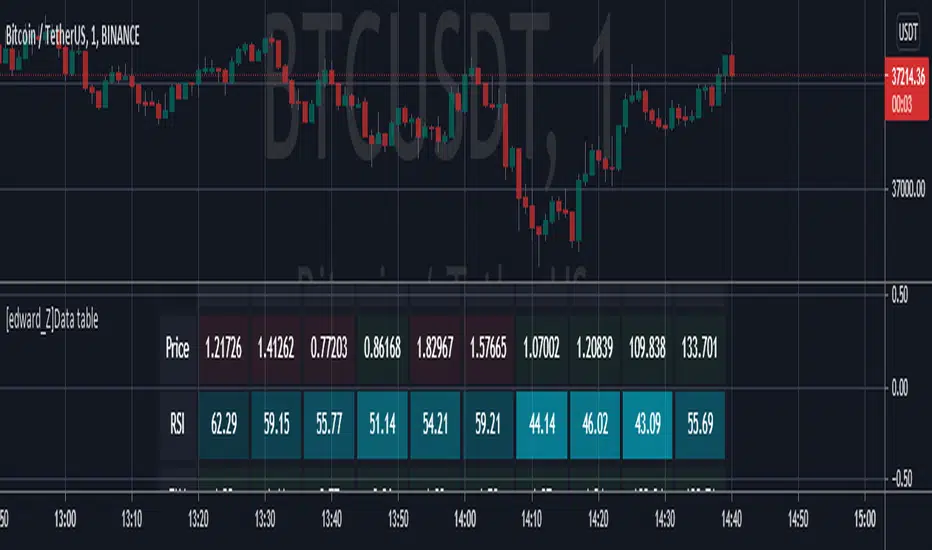
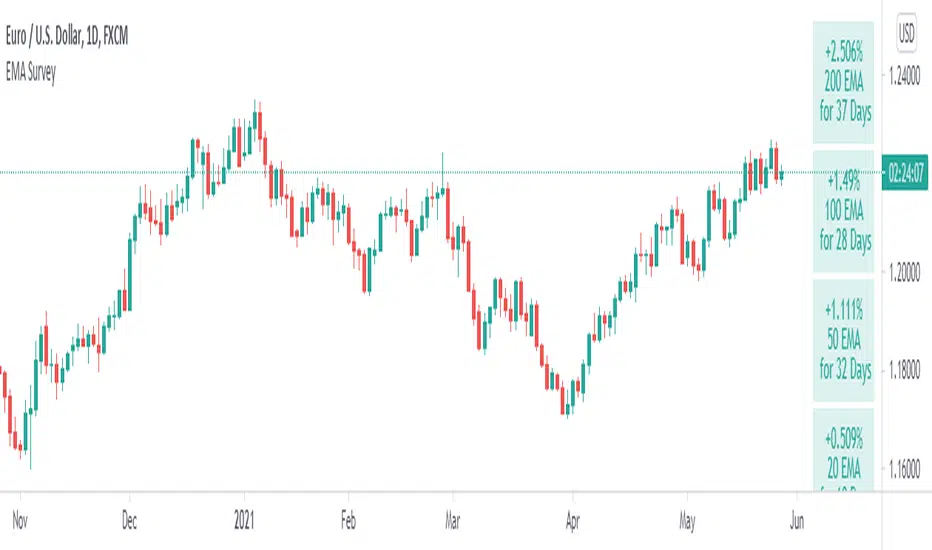
Table: EMA SurveillanceThis script will show information of interest about Moving Averages from the selected timeframe.
The idea is to provide data from higher timeframes (Daily preferably).
The information provided includes:
• selected length and calculation
• a relative position of the close to the average (above, below, and how much)
• how many periods passed since the moving average has been tested - any break counts as a test, it doesn't have to close on the opposite side
Global Settings:
• Timeframe of the moving averages
• Choose to see simple words such as "Above" / "Below" OR the specific percentage OR how much percentage % it moved from the moving average?
• EMA or SMA
Moving Average Settings:
• Up to 6 different lengths
• You can deactivate the averages you don't need
I hope it will be useful. Good luck!