RSI+PA+PrTPHi everybody,
This strategy is a RSI, Price Averaging, Pyramiding Strategy based on the earlier RSI+PA+DCA strategy. See below.
For this slightly different strategy I left the DCA option out and instead focused on the Take Profit calculation. In the previous strategy the Take Profit was directly connected to the Average Price level with a specified take profit %. When the price reached the Take Profit all positions where exited. The strategy opened multiple position based on the PA price levels. The separate positions can close when they reach separately specified Take Profit Limit. Each time the prices crosses the PA layer again the position can be re-opened. This causes the average price to drop each time a separate position is opened and closed.
I thought it was an interesting way to minimize losses and in general it works fine. Only when the market goes bearish it can cause significant losses
For the lack of a better word, I dubbed it Progressive Take Profit. The PrTP works different and is less risky. It doesn't directly follow the average price development and is calculated for a part based on the estimated profits of the separate closed positions. Every time a separate position is closed, the profit of that position is deducted of the Take Profit Limit. This causes the Take Profit Limit to drop les drastically then the average price and the whole position will only be closed when the separately opened and closed positions made up for the biggest losses.
There are still some aspects in the puzzle that are not fully worked out yet and I am still working on it, but I wanted to share this idea already and maybe you have some thoughts about it.
The next step is to re-implement a better worked out DCA function.
To be continued.
Takeprofit
Take profit Multi timeframeRepublish:
Take profit Multi timeframe:
In this scipts, I build risk-reward system managemant. You can take profit in two way: percent or at resistant in higher timeframe or both.
Strategy in this scripts, I use Wave trend indicator as example strategy.

ATR BandsIn many strategies, it's quite common to use a scaled ATR to help define a stop-loss, and it's not uncommon to use it for take-profit targets as well. While it's possible to use the built-in ATR indicator and manually calculate the offset value, we felt this wasn't particularly intuitive or efficient, and could lead to the potential for miscalculations. And while there are quite a few indicators that plot ATR bands in some form or another already on TV, we could not find one that actually performed the exact way that we wanted. They all had at least one of the following gaps:
The ATR offset was not configurable (usually hard-coded to be based off the high or low, while we generally prefer to use close)
It would only print a single band (either the upper or lower), which would require the same indicator to be added twice
The ATR scaling factor was either not configurable or only stepped in whole numbers (often time fractional factors like 1.5 yield better results)
To that end, we took to making this enhanced version to meet all of the above requirements. While we were doing so, we decided to take this opportunity to also make some non-functional enhancements as well:
Updated the indicator to the most recent version of Pine
Updated the indicator definition to allow alternate (non-chart) timeframe usage
Made the input types explicitly defined to improve consistency
Updated the inputs with appropriate minimum values and step sizes where appropriate
Separated settings into logical groups
Added helptext to the indicator settings noting usage and common settings values
Explicitly titled the on-chart plots of the ATR bands so that they can more easily be identified and referenced in other indicators/scripts, as well as the Data Window
Food for thought : When looking at some of the behaviors of these ATR bands, you can see that when price first levels out, you can draw a "consolidation zone" from the first peak of the upper ATR band to the first valley of the lower ATR band that price will generally respect. Look for price to break and close outside of that zone. When that happens, price will usually (but not always) make a notable move in that direction, which can be used as either a potential trigger or as an additional confluence with other indicators/price action.
Finally, while we have made what we feel are some noteworthy updates and enhancements to this indicator, and have every intention of continuing to do so as we find worthy opportunities for enhancement, credit is still due to the original author: AlexanderTeaH

Strategy Execution Template - Master PatternThis script is a template to execute your strategy with Stop Loss and Take Profit and showing Trades.
Then, you can write your strategy without taking care of Stop Loss and Take Profit method.
3x Fixed Percent Stop Loss, Trailing Percent Stop Loss, Trailing ATR Stop Loss, Tailing HHLL Stop Loss
3x Fixed Percent, Take Profit

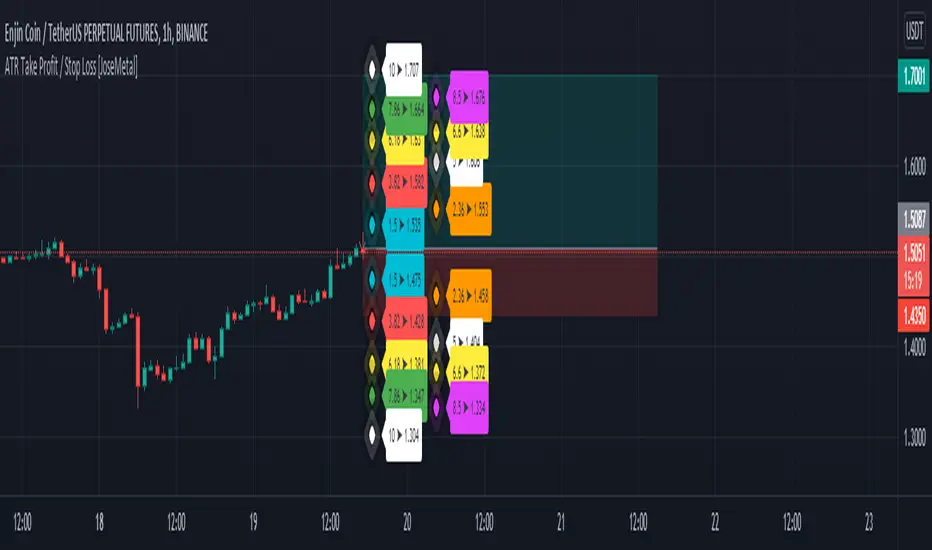
ATR Take Profit / Stop Loss [JoseMetal]============
ENGLISH
============
- Description:
This indicator is based on ATR to print current ATR multiple values for Take Profits or Stop Loss levels, it's real time, so you can use the replay feature to test it or calculate these levels anytime on any candle.
Therefore, levels are calculated by multiplying the ATR by the level multiplier.
- Visual:
Both a "diamond" and label with the ATR multiplier and price value are printed for each level.
Each level has a color for both, diamond and label to make it easier to read.
The levels are split in 2 columns for better visualization.
- Usage and recommendations:
Fibonacci's levels are used for default, but you can customize them as you like.
I usually take 3.82 level (red by default) as stop loss, and I take profit every 2 levels depending on the timeframe, is good to let a small part run until break even or ATR 10 (last level).
- Customization:
Custom ATR period, 10 is default.
Each level has custom multiplier and level.
Customizable offset for diamonds and labels.
Custom precision for prices (because it greatly depends on the asset you're working with).
============
ESPAÑOL
============
- Descripción:
Este indicador se basa en el ATR para mostrar múltiples niveles de Take Profits o Stop Loss, es en tiempo real, por lo que se puede utilizar la función de repetición para probarlo o calcular estos niveles en cualquier momento y en cualquier vela.
Por lo tanto, los niveles se calculan multiplicando el ATR por el multiplicador del nivel.
- Visual:
Tanto un "diamante" como una etiqueta con el multiplicador ATR y el valor del precio se imprimen para cada nivel.
Cada nivel tiene un color tanto para el diamante como para la etiqueta para facilitar su lectura.
Los niveles están divididos en 2 columnas para una mejor visualización.
- Uso y recomendaciones:
Se usan los niveles de Fibonacci defecto, pero puedes personalizarlos como quieras.
Yo suelo usar el nivel 3.82 (rojo por defecto) como stop loss, y tomo beneficios cada 2 niveles dependiendo de la temporalidad, es bueno dejar correr una pequeña parte hasta el break even o ATR 10 (último nivel).
- Personalización:
Periodo ATR personalizable, 10 es el predeterminado.
Cada nivel tiene multiplicador y nivel personalizables.
Desplazamiento (offset) personalizable para los diamantes y las etiquetas.
Precisión para decimales personalizada (porque depende mucho del activo con el que se trabaje).
Kahlman HullMA / WT Cross StrategyA strategy created using Hull Moving Average and WT Cross .
Hull Moving Average turns green and WT Cross crossover this is a long. Otherwise short.
Stop Loss and Take Profit settings are available. You can set it to the level you want or turn it off.
According to my measurements, it shows the best performance in the 4-hour period. But you can find the best settings that are correct from the Strategy settings.

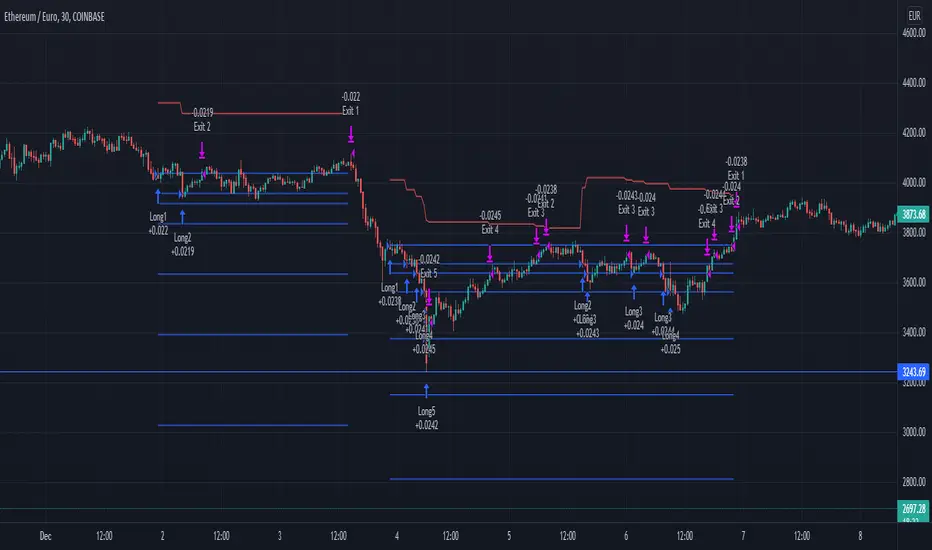
multiple orders - strategy - educationalHi,
Here is a 'template', using array's, for multiple orders and different SL/TP levels per trade (This is an example with max 5 open trades)
The 'switch' makes sure that the first available position will be used,
for example, when 'L1' is closed in the past, and a buy condition is triggered, position 'L1' will be filled,
should it be that 'L1', 'L2', 'L3' are already filled, then position 'L4' will be filled, ...
An extra table is added with data of the trades
Be aware, the 'Buy and Hold' resembles the profit when 100% of the available equity has been bought at the time of the very first trade and sold now. On the other hand, the positions work with a % of equity, 20% per trade (5 x 20 = 100%)
You can see that every trade exits on its own terms, without interference of other trades
Important, this technique only works if in the strategy() function:
- close_entries_rule -> set at 'ANY'
- pyramiding is set at max amount of trades or higher (in this case 5 or higher)
Cheers!
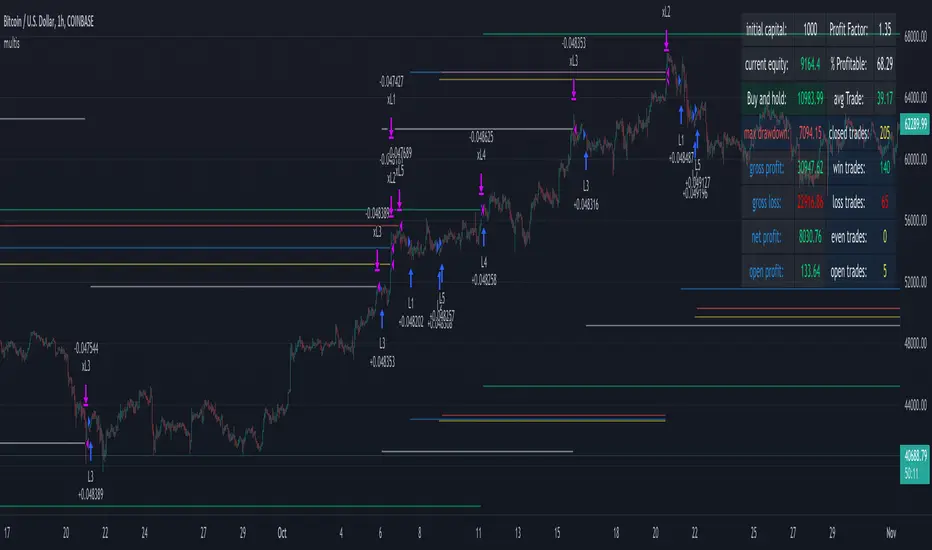
SuperTrend Multiple Risk Management SystemThis is an improved SuperTrend strategy that makes use of multiple types of risk management options.
We have for example :
1. Take profit and stop loss levels based on support and resistence created with RSI and Pivot Lines(dynamic)
For example, if we have an oversold level and a pivot low , we can take that low point for support.(or resistence for short)
If instead we have an overbought level and a pivot high, we can take that high point for resistence.(orsupport for short)
2. Take profit and stop loss levels based on swing low and swing high points calculated with highest high and lowest low function(dynamic)
For example we take the lowest point in the last 100 candles. We calculate the distance from the current point to that one, and we apply this value as a take profit point. Same for stop loss
3. Take profit and stop loss levels based on % movements(fixed)
For example we have a tp or sl of 10%. If either of them make a movement of 10% from the entry point, they will get triggered.
4. Break even stop loss once the asset moves certain % in our direction.
For example we have a long breakeven of 5%. If the asset moves 5% in our direction, we move the stop loss on the entry point so if the trade pullback and crosses with this point it will exit from the trade.
Notes:
All the exits from the strategy are happening at the end of the candle close, since we are checking if inside the current candle we cross with either high or low of the candles parts the set prices from any of the above options.
At the same time we can combine multiple of them into one, and we can either exit based on which one was hit first, or use a quantity reduction of the trade and exit multiple times when we hit any of the levels.
This tool is for educational purpose only.
Its main purpose is to show the difference between having a risk management or without.
For example on this scenario of BTC USD 4h, I found out that the drawdawn was reduced by more than half when using different type of risk management, compared to not use one at all, while at the same time increasing the profits by a huge margin.

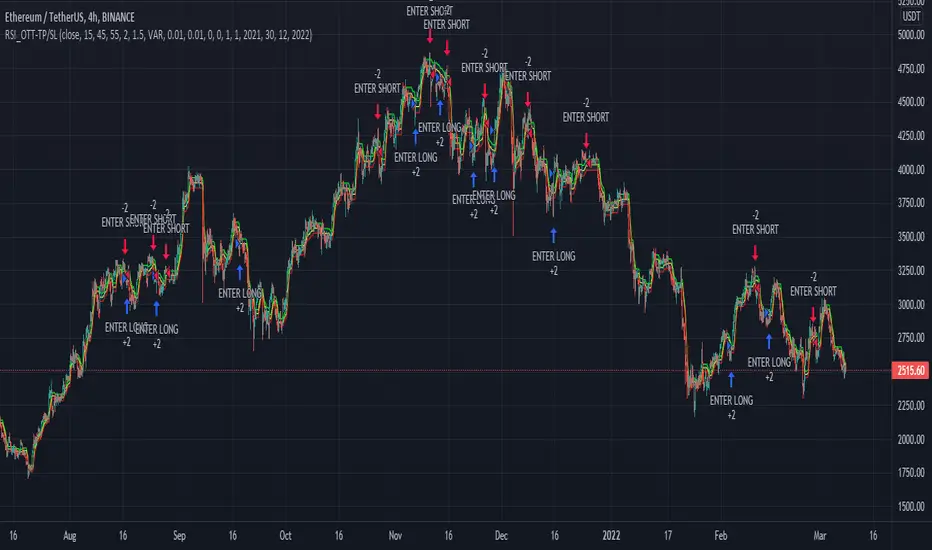
RSI_OTT - TP/SLWhile creating this strategy, I was inspired by "ott(by Anıl Özekşi)" and "RSI + Bollinger Double Strategy(by ChartArt)".
Basically, the strategy uses ott bands instead of bollinger bands in the "RSI+Bollinger Double Strategy".
User can select take profit, stop loss, position direction(long, short or both) and the other ott parameters via interface.
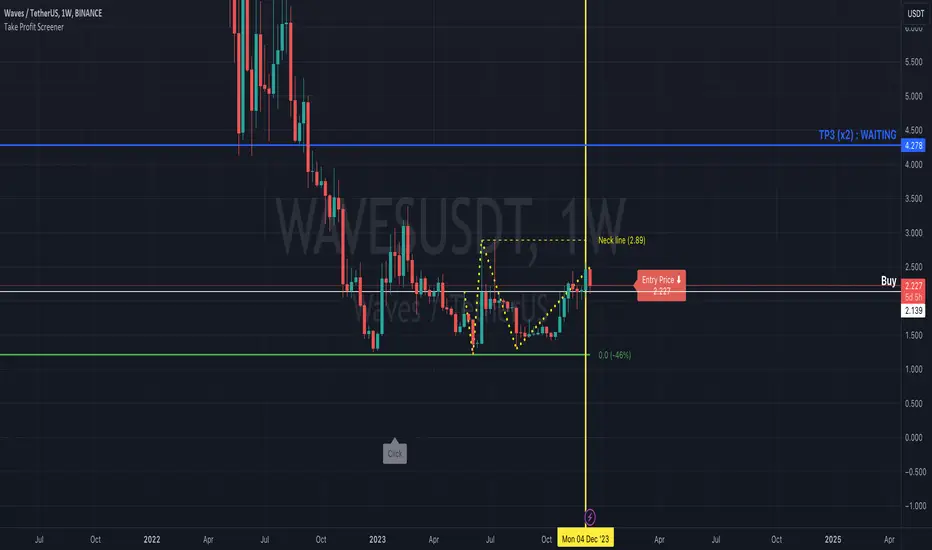
Take Profit ScreenerI'm going to introduce you to the Take Profit Screener tool.
It allows you to manually scan your watchlist to determine at a glance the assets that have the best profitability potential.
It is a 2 in 1 tool that allows you to :
identify where your Take Profit ratios are located whether you are in SHAD or Cycle Strategy
identify the potential reward percentages when approaching the key Fibonacci levels
Before you start using it, you need to:
sort your watchlist according to the price (Last) in order to have price ranges more or less close to each other when jumping from a symbol to another
disable the Auto Scale and Magnet feature
select your first symbol
display the tool (the indicator more exactly)
The settings dialog box is organised in 3 sections:
Strategy : By setting this section, you will answer the question " Where do my Take Profit ratios stand in relation to my entry price, and according to Risk Management Strategy adopted (SHAD or Cycle)? "
Fibonacci : By setting this section, you will answer the question " What percentage gain can I expect as I approach one of the key Fibonacci levels? "
Layout : This is the settings for the look and feel
Strategy Section
Active : This part of the indicator won't display on your chart if unchecked
Type : Choose between SHAD or Cycle Strategy. When choosing SHAD, you can select 2, 4, 8 or 16 SHAD Levels. When choosing Cycle, you can enter whatever ratio value you wish in the Strategy Ratio (Cycle only) input.
SHAD xNN : When choosing SHAD Strategy, you should select at least one level and more if need be.
Strategy Ratio (Cycle only) : When choosing Strategy Type Cycle, you can enter whatever ratio value you wish there.
Freeze Entry Price & Value : Leave it unchecked whenever the current price of the asset is located within your desired area (i.e. Reload Zone) while attempting to estimate its potential reward. Conversely, keep it checked whenever the current price of the asset is outside your desired area, but you need to anticipate the potential reward of this asset if its price reaches a certain level, your Entry price. Enter this price there and check the box.
Show price : If checked, both Take Profit ratio and Price are displayed. If unchecked, then price is hidden.
Extend Line : If checked, then lines showing Take Profit levels extend to the left.
Label Offset : If checked, then the label that displays Take Profit ratio and price shift to the right by a value that ranges from 0 to 100 candles.
Label Style : You can choose between Right or Top. This will determine the orientation of the label.
Fibonacci Section
Active : This part of the indicator won't display on your chart if unchecked
Type : Choose between SHAD or Cycle Strategy. When choosing SHAD, you can select 2, 4, 8 or 16 SHAD Levels. When choosing Cycle, you can enter whatever ratio value you wish in the Strategy Ratio (Cycle only) input.
SHAD xNN : When choosing SHAD Strategy, you should select at least one level and more if need be.
Strategy Ratio (Cycle only) : When choosing Strategy Type Cycle, you can enter whatever ratio value you wish there.
Freeze Entry Price : Leave it unchecked whenever the current price of the asset is located within your desired area (i.e. Reload Zone) while attempting to estimate its potential reward. Conversely, keep it checked whenever the current price of the asset is outside your desired area, but you need to anticipate the potential reward of this asset if its price reaches a certain level, your Entry price. Enter this price there and check the box.
Color : You can define the color of Fibonacci line levels
Buy Monday, Exit Tuesday with Stop Loss and Take ProfitStrategy to go long at end of Monday before market closes and exit before Tuesday close, or at stop loss or take profit percentages
This runs strategy on entering by weekday name and also by session time.
Implemented are also Take Profit and Stop Loss to exit position using custom inputs.
Added stoploss and take profit plot lines

Anna-LysaEspecially useful when using it for stocks in intraday screening for daytrading.
This gives you quick information about the volatility at the moment when you look at the stock.
The current range of the last candles (adjustable) is calculated so that you can stop based on the Vola.
In addition, the daily volume and daily range are calculated in the table and what is left of the average.
So that you can adjust your ideas for the movement in order to take profit. No matter what the timeframe, you can see how the volume compares to that of the previous few candles and thus anticipate the most likely breakout.
Then the most relevant day trading levels ( Premarkets, Lastday high/lows and some Ma´s ) are shown so that you can get a very fast overview of the stock at the moment.
All levels and labels and colors are adjustable or hidden in the settings.

MACD Cross [Momentum & Trend Filter]This is MTF MACD crossover and crossunder, with EMA trend filter and MTF RSI overbought/oversold filter.
Guidelines:
- User can set stop loss, take profit target and risk to reward ratio in setting
- ATR Stop and ATR Multiplier are use to set stop loss and take profit levels, setting are varies depend on what you are trading, play around and find appropriate number
- Don't trade if range between stop loss and target profit are too small or if there are too many small range try to increase multiplier
- If MACD Zero Line Filter enable, detect MACD crossover only under zero line for LONG, and detect MACD crossunder only above zero line for SHORT
- If EMA Trend Filter enable, detect MACD crossover which price above EMA for LONG, and detect MACD crossunder which price below EMA for SHORT
- RSI timeframe 1-3 should not lower than chart timeframe to display Overbought and Oversold correctly
- Enable MTF Overbought and Oversold just to display red background for Overbought, and green background for Oversold
There are 3 alert options:
(For those free user which can get only 1 alert, please choose "MACD crossover & crossunder" if you want to get alert for both long and short directions)
Have fun :)

Levels Of Greed
The Levels Of Greed indicator is based on the same idea as the Levels Of Fear one and was suggested by several traders in the comment section. It helps analyze price advances to find the best levels for closing a long position in an asset after a quick surge or longer up-trend. In finance, volatility is a term that describes the degree of variation of an asset price over time. It is usually denoted by the letter σ (sigma) and estimated as the standard deviation of the asset price or price returns. The Levels Of Greed indicator helps measure the current price advance in the standard deviation units. It plots seven levels at distances of 1, 2, 3, 4, 5, 6, and 7 standard deviations (sigmas) above the base price (the recent lowest price or lower bound of the established range). In what follows, we will refer to these levels as levels of greed.
HOW TO USE
When the price in its surge reaches a certain level of greed, it means that it has surged from its recent lowest value by a corresponding number of standard deviations. The indicator helps traders see the maximum levels to which the price may rise and estimate the potential height of the current surge. Five-seven sigma surges are relatively rare events and correspond to significant market exuberance. Careful traders and shorter-term ones would not want to participate in the bandwagon effect and herd behavior that drive market bubbles. They prefer to take their profits when the market is not exceedingly overbought.
SETTINGS
Window : the averaging window or period of the indicator. The algorithm uses this parameter to calculate the base level and standard deviations. Higher values are better for measuring deeper and longer surges.
Levels Stability : the parameter used in the up-move detection. The higher the value is, the more stable and long the greed levels are, but at the same time, the lag increases. The lower it is, the faster the indicator responds to the price changes, but the greed levels are recalculated more frequently and are less stable. This parameter is mostly for fine-tuning. It does not change the overall picture much.
Mode : the parameter that defines the style for the labels. In the Cool Guys Mode, the indicator displays the labels as emojis. In the Serious Guys Mode, labels show the distance from the base level measured in standard deviation units or sigmas.

Levels Of Greed [AstrideUnicorn]The Levels Of Greed indicator is based on the same idea as the Levels Of Fear one and was suggested by several traders in the comment section. It helps analyze price advances to find the best levels for closing a long position in an asset after a quick surge or longer up-trend. In finance, volatility is a term that describes the degree of variation of an asset price over time. It is usually denoted by the letter σ (sigma) and estimated as the standard deviation of the asset price or price returns. The Levels Of Greed indicator helps measure the current price advance in the standard deviation units. It plots seven levels at distances of 1, 2, 3, 4, 5, 6, and 7 standard deviations (sigmas) above the base price (the recent lowest price or lower bound of the established range). In what follows, we will refer to these levels as levels of greed.
HOW TO USE
When the price in its surge reaches a certain level of greed, it means that it has surged from its recent lowest value by a corresponding number of standard deviations. The indicator helps traders see the maximum levels to which the price may rise and estimate the potential height of the current surge. Five-seven sigma surges are relatively rare events and correspond to significant market exuberance. Careful traders and shorter-term ones would not want to participate in the bandwagon effect and herd behavior that drive market bubbles. They prefer to take their profits when the market is not exceedingly overbought.
SETTINGS
Window : the averaging window or period of the indicator. The algorithm uses this parameter to calculate the base level and standard deviations. Higher values are better for measuring deeper and longer surges.
Levels Stability : the parameter used in the up-move detection. The higher the value is, the more stable and long the greed levels are, but at the same time, the lag increases. The lower it is, the faster the indicator responds to the price changes, but the greed levels are recalculated more frequently and are less stable. This parameter is mostly for fine-tuning. It does not change the overall picture much.
Mode : the parameter that defines the style for the labels. In the Cool Guys Mode , the indicator displays the labels as emojis. In the Serious Guys Mode , labels show the distance from the base level measured in standard deviation units or sigmas.

SignalsThis script allows you to calculate position size, and future profit, loses.
- You can add 3 target values and 1 stop loss
- Optionally you can display table, position it as you like, and see risk ratio
Plans:
- add profit loss to the labels

Kzx PT mod v1.0 by RX-RAYKzx Position tracker mod v1.0 by RX-RAY
Original script by K-zax
The modification was made for the USDRUB ticker (the number of digits in the values of price, interest, lot volume and profit loss for other tickers may affect the positioning of the inscription, but it is fully operative and it may be used with other tickers )
Typical label view:
74.30 - ENTRY PRICE
+/-0.16% - % of price chang ( range +/-9.99)
20 - position value (range 0-99)
(S) - position type (L) - long (S) - short
+/-0017 - actual profit/loss in cash (range +/- 9999)
(All range value for correct label position,
but script mod can be used out off range)
List of additions and changes:
1. Added display of position value, short / long position type and profit / loss value (including broker commission).
2. Positive interest change now corresponds to profit, negative change in interest to loss in accordance with the type of position ( short/long )
3. The position of the inscription and the digits of the values are fixed and now insignificantly depends on the change in the time interval and the change in the scale of the graph and the change in data values and their signs.
4. Added changing the color of the inscription in the situation positive price change, but profit < commission fee. (critical gain).

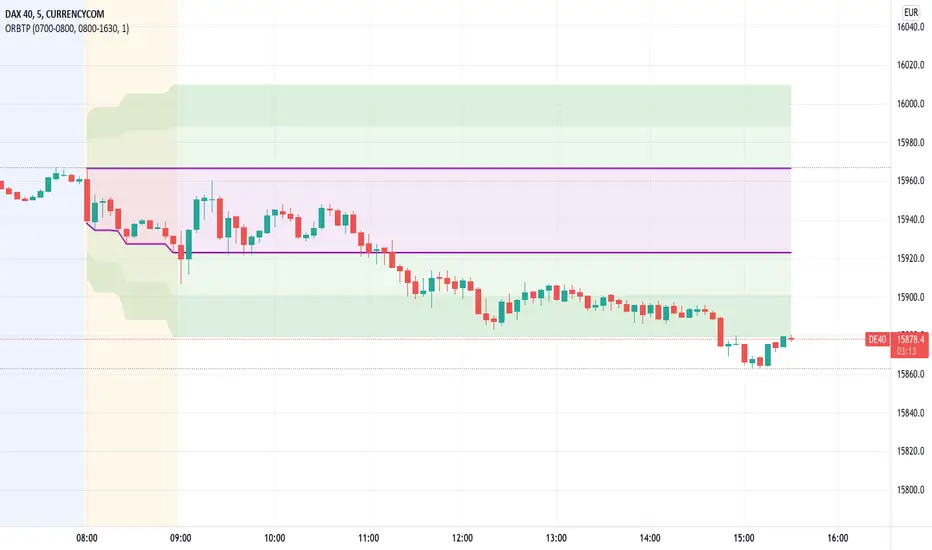
Open Range Breakout With Take Profit Zones
Open Range Breakout With Take Profit Zones prints the open range and profitable zones based on the high and low during the opening hours.
This indicator can be used to prepare breakout trades following the OPR strategy. The time window for the open range as well as for the market hours can be configured. Also custom alerting templates allow to create alerts when a breakout out of the opening range occurs or when 50% take profit level is reached.
The background of pre and post market hours is coloured according to the configured time windows.
This indicator was written to support scalping and day trading. It does not calculate or display results on hourly, daily or weekly charts.
The open range and trading hours must be adjusted to the market time zone of your instrument. Also please take care that these settings are saved on the layout and not per instrument. Eventually create multiple layouts for instruments with different market time zones.
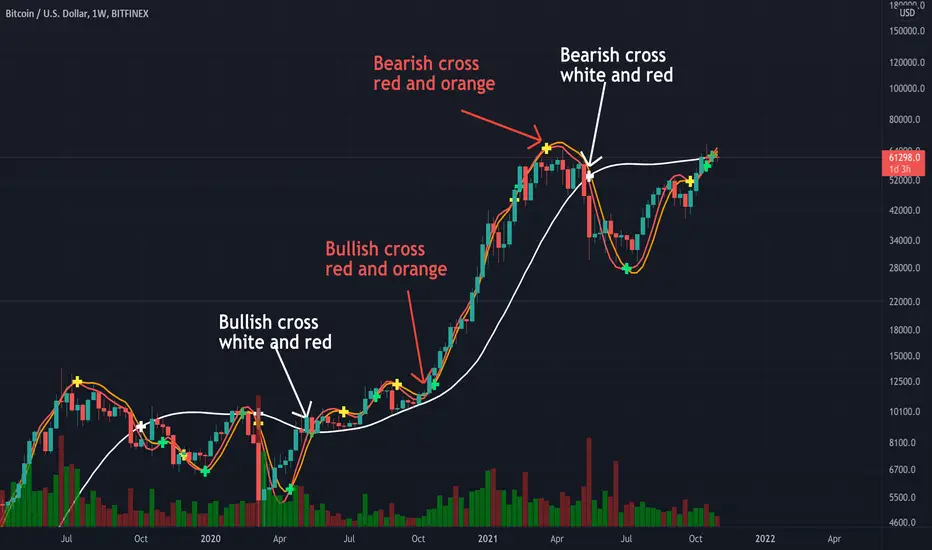
Triple Modified Hull Moving Average Cross By <Zakaria>Triple Modified Hull Moving Average Cross By
What is this?
this is a modified formula for Hull moving average, it is more accurate and predicts the golden and death cross earlier.
How to use?
Work better in high time frames (1D,1W)
the white line vs the red and the orange lines :
1 - when the white line crosses the red and the orange lines from the bottom the price will go down . Death cross!
2 - when the white line crosses the red and the orange lines from the top the price will go up . Golden Cross!
the red line vs the orange line :
1- when the orange line crosses the red line from the bottom the price will go down . Death cross!
2 - when the orange line crosses the red line from the top the price will go up . Golden Cross!
p.s: the lag between these two lines will be very small. use it in the 1W time frame to predict where exactly the bull market will end.
You can input your personalized values if you want!
GEMA-Indicador por Neil-------------------
DESCRIPTION
GEMA-INDICATOR is a indicator based on SMA, EMA, WMA, RMA that considers elements such as ADX, DMI, RSI, stochastic, Stoploss, Takeprofit, angles and values at present point.
HOW DOES IT WORK
The component works as an assistant to which you configure the previous elements and you see the performance that it offers you, in such a way that you pass that configuration to GEMA-INDICATOR so that you can receive alerts and do visual trading with notifications or automated trading by sending messages to platforms like 3Commas.
WHY USE IT
The resource operates with one of the most important strategies in the market, which is the price tracking line, which means that if prices go up, we follow it, if prices go down, we follow it; in this way you do not need to make large investments as is often the case with pure BOTs, which require large reserves for security orders.
HOW TO USE IT
Press the "Indicators" option, go to the "Public Library" segment, write the name "GEMA-Indicador por Neil", double click on the record in question and you will have it added in your work panel, now, it only remains to use it and configure its parameters.
-------------------
DESCRIPCIÓN
GEMA-INDICADOR en un indicador basado en SMA, EMA, WMA, RMA que considera elementos como ADX, DMI, RSI, Estocastico, Stoploss, Takeprofit, ángulos y valores a punto presente.
COMO FUNCIONA
El componente funciona como un asistente al que vas configurando lo elementos anteriores y vas viendo el rendimiento que te ofrece, de manera tal, que pases esa configuración a GEMA-INDICADOR para que puedas recibir alertas y hagas trading visual con notificaciones o trading automatizado enviando mensajes a plataformas como 3Commas.
POR QUÉ USARLO
El recurso opera con una de las estrategias mas importantes del mercado, que es la linea de seguimiento de precio, lo que significa que si los precios suben, lo seguimos, si los precios bajan, lo seguimos; de esta manera no necesita realizar grandes inversiones como suele ocurrir con los BOT puros, que exigen grandes reservas para las ordenes de seguridad.
COMO USARLO
Presione la opción "Indicadores", ubíquese en el segmento "Libreria Publica", escriba el nombre "GEMA-Indicador por Neil", haga doble clic sobre el registro en cuestión y lo tendrá agregado en su panel de trabajo, ahora, solo resta usarlo y configurar sus paramertos.

GEMA-Estrategia por neil-------------------
DESCRIPTION
GEMA-STRATEGY is a strategy generator based on SMA, EMA, WMA, RMA that considers elements such as ADX, DMI, RSI, stochastic, Stoploss, Takeprofit, angles and values at present point.
HOW DOES IT WORK
The component works as an assistant to which you configure the previous elements and you see the performance that it offers you, in such a way that you pass that configuration to GEMA-INDICATOR so that you can receive alerts and do visual trading with notifications or automated trading by sending messages to platforms like 3Commas.
WHY USE IT
The resource operates with one of the most important strategies in the market, which is the price tracking line, which means that if prices go up, we follow it, if prices go down, we follow it; in this way you do not need to make large investments as is often the case with pure BOTs, which require large reserves for security orders.
HOW TO USE IT
Press the "Indicators" option, go to the "Public Library" segment, write the name "GEMA-Estategia por Neil", double click on the record in question and you will have it added in your work panel, now, it only remains to use it and configure its parameters.
-------------------
DESCRIPCIÓN
GEMA-ESTRATEGIA en un generador de estrategias basado en SMA, EMA, WMA, RMA que considera elementos como ADX, DMI, RSI, Estocastico, Stoploss, Takeprofit, ángulos y valores a punto presente.
COMO FUNCIONA
El componente funciona como un asistente al que vas configurando lo elementos anteriores y vas viendo el rendimiento que te ofrece, de manera tal, que pases esa configuración a GEMA-INDICADOR para que puedas recibir alertas y hagas trading visual con notificaciones o trading automatizado enviando mensajes a plataformas como 3Commas.
POR QUÉ USARLO
El recurso opera con una de las estrategias mas importantes del mercado, que es la linea de seguimiento de precio, lo que significa que si los precios suben, lo seguimos, si los precios bajan, lo seguimos; de esta manera no necesita realizar grandes inversiones como suele ocurrir con los BOT puros, que exigen grandes reservas para las ordenes de seguridad.
COMO USARLO
Presione la opción "Indicadores", ubíquese en el segmento "Libreria Publica", escriba el nombre "GEMA-Estrategia por Neil", haga doble clic sobre el registro en cuestión y lo tendrá agregado en su panel de trabajo, ahora, solo resta usarlo y configurar sus paramertos.

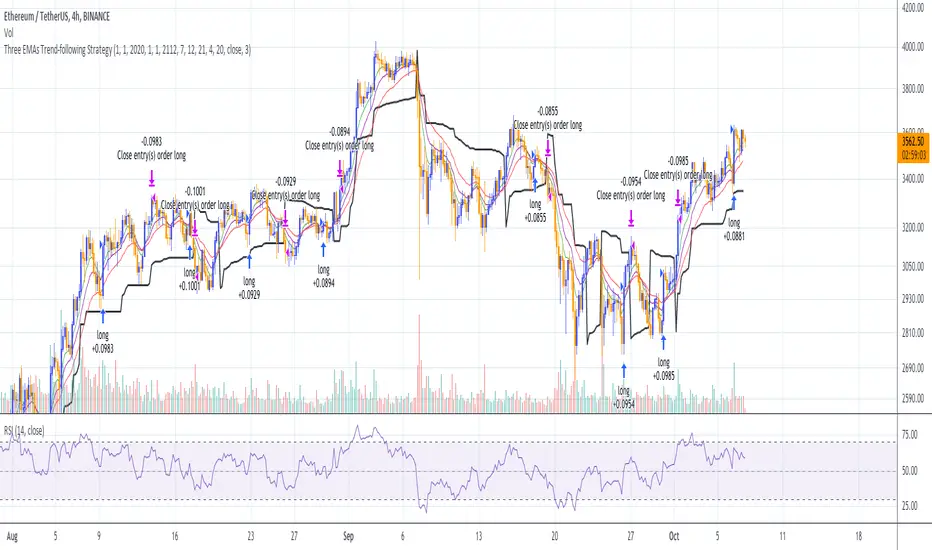
Three EMAs Trend-following Strategy (by Coinrule)Trend-following strategies are great because they give you the peace of mind that you're trading in line with the market.
However, by definition, you're always following . That means you're always a bit later than your want to be. The main challenges such strategies face are:
Confirming that there is a trend
Following the trend, hopefully, early enough to catch the majority of the move
Hopping off the trade when it seems to have run its course
This EMA Trend-following strategy attempts to address such challenges while allowing for a dynamic stop loss.
ENTRY
The trading system requires three crossovers on the same candle to confirm that a new trend is beginning:
Price crossing over EMA 7
Price crossing over EMA 14
Price crossing over EMA 21
The first benefit of using all three crossovers is to reduce false signals. The second benefit is that you know that a strong trend is likely to develop relatively soon, with the help of the fast setup of the three EMAs.
EXIT
The strategy comes with a fixed take profit and a volatility stop, which acts as a trailing stop to adapt to the trend's strength. That helps you get out of the way as soon as market conditions change. Depending on your long term confidence in the asset, you can edit the fixed take profit to be more conservative or aggressive.
The position is closed when:
The price increases by 4%
The price crosses below the volatility stop.
The best time frame for this strategy based on our backtest is the 4-hr. Shorter timeframes can also work well, although they exhibit larger volatility in their returns. In general, this approach suits medium timeframes. A trading fee of 0.1% is taken into account. The fee is aligned to the base fee applied on Binance, which is the largest cryptocurrency exchange.
You can execute this strategy on your favourite exchange at coinrule.com
Take Profit On Trend (by BHD_Trade_Bot)The purpose of strategy is to detect long-term uptrend and short-term downtrend so that you can easy to take profit.
The strategy also using BHD unit to detect how big you win and lose, so that you can use this strategy for all coins without worry about it have different percentage of price change.
ENTRY
The buy order is placed on assets that have long-term uptrend and short-term downtrend:
- Long-term uptrend condition: ema200 is going up (rsi200 greater than 51)
- Short-term downtrend condition: 2 last candles are down price (use candlestick for less delay)
CLOSE
The sell order is placed when take profit or stop loss:
- Take profit: price increase 1 BHD unit
- Stop loss: price decrease 2 BHD units
The strategy use $15 and trading fee is 0.1% for each order. So that, in the real-life, if you are using trade bot, it will need $1500 for trading 100 coins at the same time.
Pro tip : The 1-hour time frame for altcoin/USDT has the best results on average.
