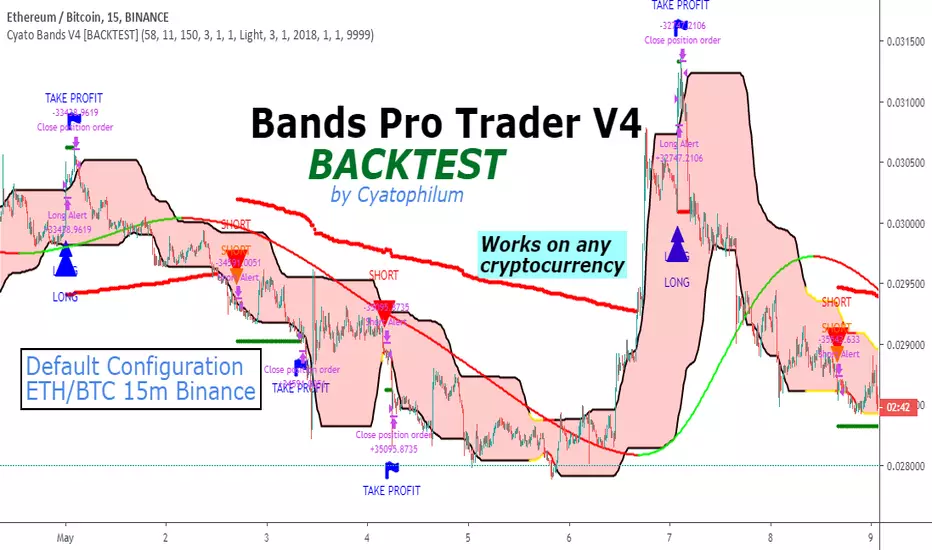
Cyatophilum Bands Pro Trader V4 [BACKTEST]This version includes a new feature, engineered to increase profitability.
About the backtest below:
Short + Long Strategy
0.05% Commission
10% of 10 000% equity per trade. Net Profit can be increased with a bigger % of equity.
Strategy data from 01/11/2019 to 30/04/2019
The Cyatophilum Bands, Trailing Stop Loss and Take Profit System are explained in the last version:
The access to this indicator and its Alert Setup version are included in the Cyatophilum Indicators pack available on my website blockchainfiesta.com
To get a free trial, leave a comment, thank you.
Takeprofit
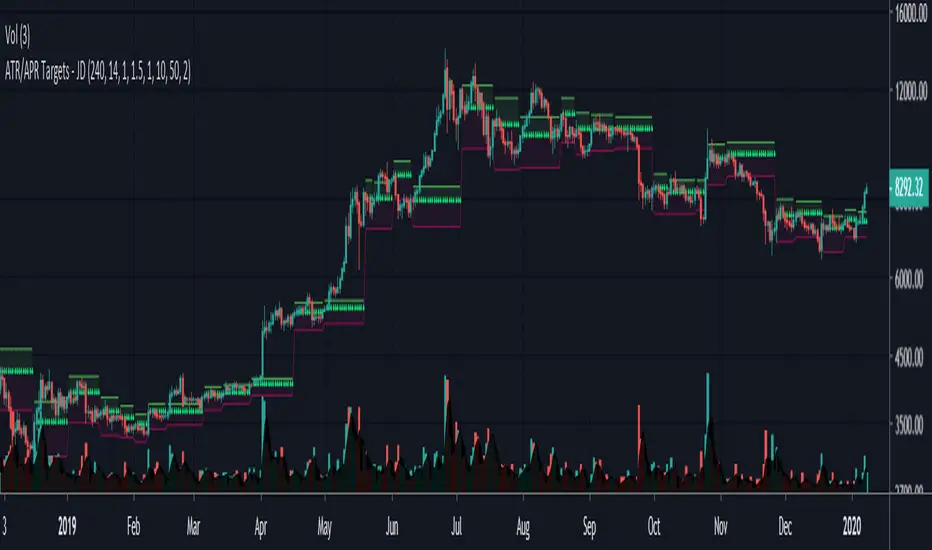
ATR Targets - JDA simple visual representation of ATR trading targets.
The indicator shows ATR targets (TP and SL) from the last swing points (if you entered there)
There is an option to chose targets for a long or short position.
JD.
#NotTradingAdvice #DYOR
I build these indicators for myself and provide them open source, to use for free to use and improve upon,
as I believe the best way to learn is toghether.
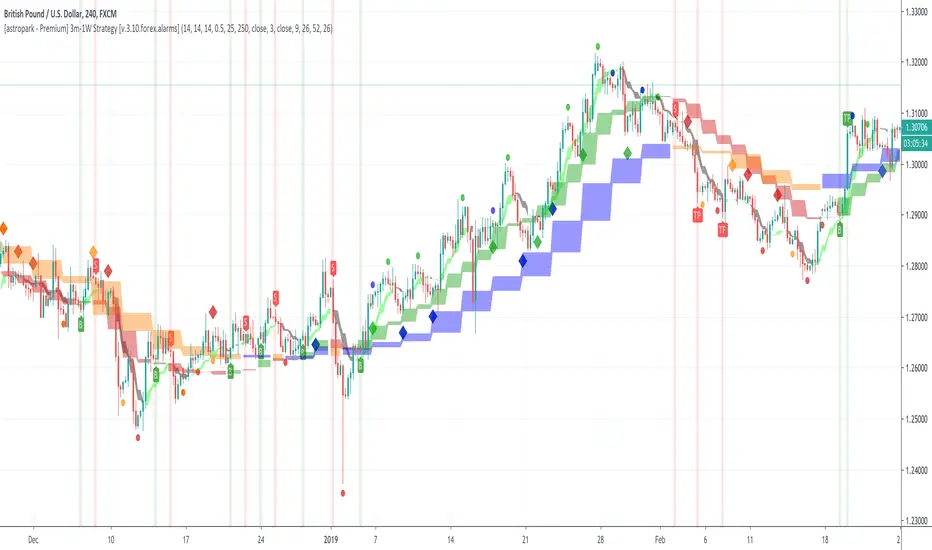
[astropark - Premium] Long-Short Strategy V3-FOREX [Alarms]This indicator is not holy grail , but it is an amazing trend finder and works nicely between 3m and 1W timeframes on FOREX :)))
With this indicator you can enjoy its trading signal and set the alarms you need!
In fact, if you want to set alerts on both buy, sell, take profit and stop-loss signals you must use this not-strategy indicator version!
This indicator is the non-strategy version of this one:
HOW TO USE THIS INDICATOR
Buy/Long when you see a green "B" label on the chart at best price you can, you have time till next candle's open price , trying to buy as low as possible near the green cloud or below it. Green cloud acts like a moving support for price, so use it for more buys/longs. The bigger the cloud, the stronger the bull-trend and so the support.
Sell/Short when you see a red "S" label on the chart at best price you can, you have time till next candle's open price , trying to sell as high as possible near the red cloud or over it. Red cloud acts like a moving resistance for price, so use it for more sells/shorts. The bigger the cloud, the stronger the bear-trend and so the resistance.
This indicator suggests some TP (Take Profit) for both longs (in green color) and shorts (in red color): you can start (at least partially!) closing the current trade (eventually you start new longs/shorts at cloud touch if you are a bold trader!).
Keep in mind that the lower the timeframe you work on, the easier is the trend to change rapidly, so always set a -2% / -5% stop-loss on trades and follow the trend with a nice trailing stop strategy.
Of course, as said at the beginning, this indicator suggests some TPs (Take Profits) for both longs (in green color) and shorts (in red color) operations: when you see a TP, you can start (at least partially!) taking profits over the current trade and move stop-loss higher (at least at break-even).
This is a premium indicator , so send me a private message in order to get access to this script.
Do you like my free scripts? Offer me a coffee, a beer, a pizza or whatever :)
BTC jar: 1K5kuYQPEqoNo6GRmJbHWMPmqwKM5S3oRR
ETH jar: 0x091b541a6dd6fe08c4e7bd909baafb2fce9b975e
LTC jar: LSVoAChsZrVsvbNyUfdpxtFpDAUSaUTUig
XRP jar: (XRP deposit tag) 103997763 (XRP deposit address) rEb8TK3gBgk5auZkwc6sHnwrGVJH8DuaLh
PS: Do you need a customization or do you need a dev who implements your strategy? send me a private message ;-)
[astropark - Premium] Long-Short V3-FOREX [Strategy]This indicator is not holy grail , but it is an amazing trend finder and works nicely between 3m and 1W timeframes on FOREX :)))
With this indicator you can enjoy its trading signal and backtest the strategy.
In order to check how much you could have been profitable with this script if you started trading from a specific timestamp, please use this nice website to get the integer number representing in seconds the date-time you want to start from: www.unixtimestamp.com
If you want to set alerts on both buy, sell, take profit and stop-loss signals you must use the following not-strategy indicator version:
HOW TO USE THIS INDICATOR
Buy/Long when you see a green "B" label on the chart at best price you can, you have time till next candle's open price , trying to buy as low as possible near the green cloud or below it. Green cloud acts like a moving support for price, so use it for more buys/longs. The bigger the cloud, the stronger the bull-trend and so the support.
Sell/Short when you see a red "S" label on the chart at best price you can, you have time till next candle's open price , trying to sell as high as possible near the red cloud or over it. Red cloud acts like a moving resistance for price, so use it for more sells/shorts. The bigger the cloud, the stronger the bear-trend and so the resistance.
This indicator suggests some TP (Take Profit) for both longs (in green color) and shorts (in red color): you can start (at least partially!) closing the current trade (eventually you start new longs/shorts at cloud touch if you are a bold trader!).
Keep in mind that the lower the timeframe you work on, the easier is the trend to change rapidly, so always set a -2% / -5% stop-loss on trades and follow the trend with a nice trailing stop strategy.
Of course, as said at the beginning, this indicator suggests some TPs (Take Profits) for both longs (in green color) and shorts (in red color) operations: when you see a TP, you can start (at least partially!) taking profits over the current trade and move stop-loss higher (at least at break-even).
This is a premium indicator , so send me a private message in order to get access to this script.
Do you like my free scripts? Offer me a coffee, a beer, a pizza or whatever :)
BTC jar: 1K5kuYQPEqoNo6GRmJbHWMPmqwKM5S3oRR
ETH jar: 0x091b541a6dd6fe08c4e7bd909baafb2fce9b975e
LTC jar: LSVoAChsZrVsvbNyUfdpxtFpDAUSaUTUig
XRP jar: (XRP deposit tag) 103997763 (XRP deposit address) rEb8TK3gBgk5auZkwc6sHnwrGVJH8DuaLh
PS: Do you need a customization or do you need a dev who implements your strategy? send me a private message ;-)

[astropark - Premium] Long-Short Strategy V3This indicator is not holy grail , but it is an amazing trend finder and works nicely between 3m and 1W timeframes :)))
With this indicator you can enjoy its trading signal and backtest the strategy.
In order to check how much you could have been profitable with this script if you started trading from a specific timestamp, please use this nice website to get the integer number representing in seconds the date-time you want to start from: www.unixtimestamp.com
If you want to set alerts on both buy, sell, take profit and stop-loss signals you must use this not-strategy indicator version
HOW TO USE THIS INDICATOR
Buy/Long when you see a green "B" label on the chart at best price you can, you have time till next candle's open price , trying to buy as low as possible near the green cloud or below it. Green cloud acts like a moving support for price, so use it for more buys/longs. The bigger the cloud, the stronger the bull-trend and so the support.
Sell/Short when you see a red "S" label on the chart at best price you can, you have time till next candle's open price , trying to sell as high as possible near the red cloud or over it. Red cloud acts like a moving resistance for price, so use it for more sells/shorts. The bigger the cloud, the stronger the bear-trend and so the resistance.
This indicator suggests some TP (Take Profit) for both longs (in green color) and shorts (in red color): you can start (at least partially!) closing the current trade (eventually you start new longs/shorts at cloud touch if you are a bold trader!).
Keep in mind that the lower the timeframe you work on, the easier is the trend to change rapidly, so always set a -2% / -5% stop-loss on trades and follow the trend with a nice trailing stop strategy.
Of course, as said at the beginning, this indicator suggests some TPs (Take Profits) for both longs (in green color) and shorts (in red color) operations: when you see a TP, you can start (at least partially!) taking profits over the current trade and move stop-loss higher (at least at break-even).
This is a premium indicator , so send me a private message in order to get access to this script.
Do you like my free scripts? Offer me a coffee, a beer, a pizza or whatever :)
BTC jar: 1K5kuYQPEqoNo6GRmJbHWMPmqwKM5S3oRR
ETH jar: 0x091b541a6dd6fe08c4e7bd909baafb2fce9b975e
LTC jar: LSVoAChsZrVsvbNyUfdpxtFpDAUSaUTUig
XRP jar: (XRP deposit tag) 103997763 (XRP deposit address) rEb8TK3gBgk5auZkwc6sHnwrGVJH8DuaLh
PS: Do you need a customization or do you need a dev who implements your strategy? send me a private message ;-)


Crypto Trading Helper - by @cryptomrdavisI was looking for a strategy on TradingView that can send me signals when i have to buy or sell.
The most strategys/indicators that i found where only paid once, so i decided to create my own.
Now, a few weeks later i can share it with you and this one is completely FREE.
Features:
Buy / sell signals
Take profit - default 5%, 10% & 15%
Fibonacci included
Set alerts (buy/sell, tp1, tp2 & tp3)
more to come
For now i recommend to use it on higher timeframes.
Happy trading!
Regards,
CryptoMrDavis
*** use this tool on your own risk ***
--------------------------------------------------------------------------------------------------------
BTC: 1AxLVKpgYjMtQtcRmeuFbhQNVKWKmJ5EZy
ETH: 0x7b825fa752b9926D3E8397cDb1d9E5473D074646
XLM GAXUQJSW55C7MAC4GI26NZUGIKSHFDVFRFKZCXPLMPY4HCADSDT55XK6
BCH: qz57n04ud6mn42u00aymqkku8tfh0lk4jv9c28mjvv
--------------------------------------------------------------------------------------------------------

market phases - JDThis indicator shows the relation of price against different period ma's.
When put in daily Timeframe it gives the 1400 Day (= 200 Weekly) and the 200 ,100 an 50 Daily.
The lines show the 200,100 and 50 ma in relation to the 1400 ma.
JD.
#NotTradingAdvice #DYOR

𝙇𝙄𝙌𝙐𝙄𝘿 𝙅𝘼𝘿𝙀 🇸🇨🇷🇮🇵🇹𝙇𝙄𝙌𝙐𝙄𝘿 𝙅𝘼𝘿𝙀 🇸🇨🇷🇮🇵🇹 v0.1
-Unique LJS breakout/reversal system
-Multi timeframe trend restricted trading
-Renko, ADX, MAs
-Risk Management, TP, SL
More to come!

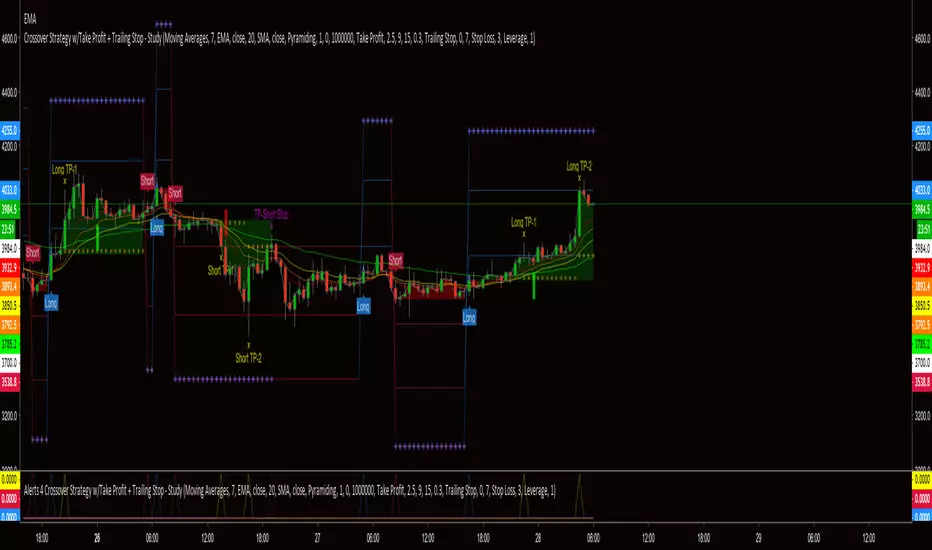
Crossover Strategy w/Take Profit + Trailing Stop - StudyThis script is a result of hours of trail, error and research. If something is not functioning as anticipated, please notify me with a description and possible screen shot of the issue.
The strategy is a basic crossover strategy. When MA1 crosses above MA2, it will trigger a long entry. When MA1 crosses below MA2, it will trigger a short entry.
When using the Take Profit function, the trailing stop will automatically activate at the defined TP3 level.
Also, when TP1 is hit a stop loss is set at 0.3% (this can be adjusted in settings) above/below the current entry. When TP2 is achieved, the stop will move up to the TP1 level.
If the trailing stop locks in LESS profit than the TP2 level, the stop will trigger at the TP2 level. This will continue until the trailing stop has moved to a level more advantageous than TP2.
There is a companion Alerts script for use with AutoView.
***AutoView syntax IS NOT provided***
[ALERTS]Super-Trend & SL/TP V3This simple script analyzes the trend in real time...
Alerts, SL, TP, bla, bla, bla...

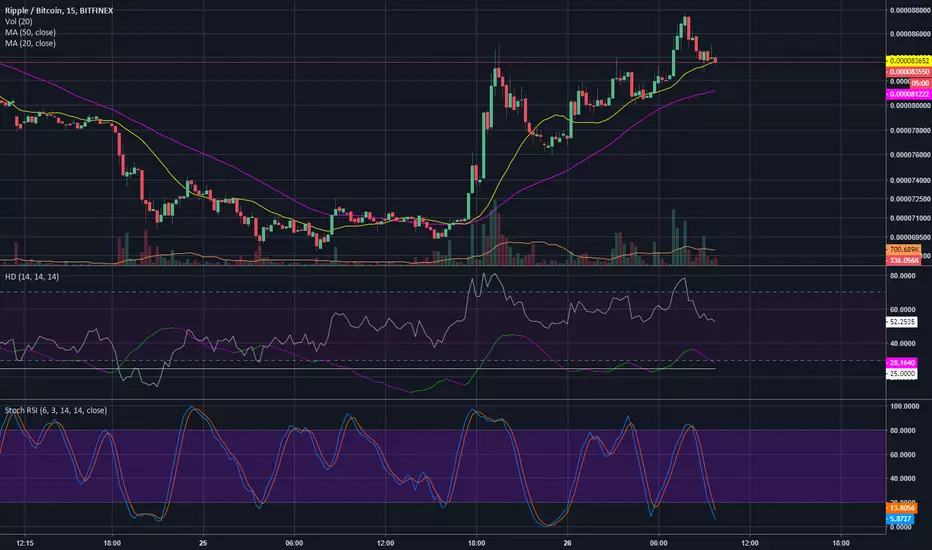
Hogland DivergenceThis is a good take profit indicator, a divergence on RSI (white line) followed by a reversal of green line into purple indicates the top (or bottom) of a trend.
lamBOTghini-ALERTador & SL/TP V3I publish the code again in case someone is interested in learning. I am not an expert, I learned from others who published their scripts and for this reason I do the same.
If someone tries to sell you a script it is because they do not make money with it in trading and they need to sell it to earn something.
It is a simple combination algorithm of 3 EMA with stop loss and Take profit and with alerts.
Enjoy!
¡Mucho ánimo a los Venezolanos!
¡Saludos desde España!

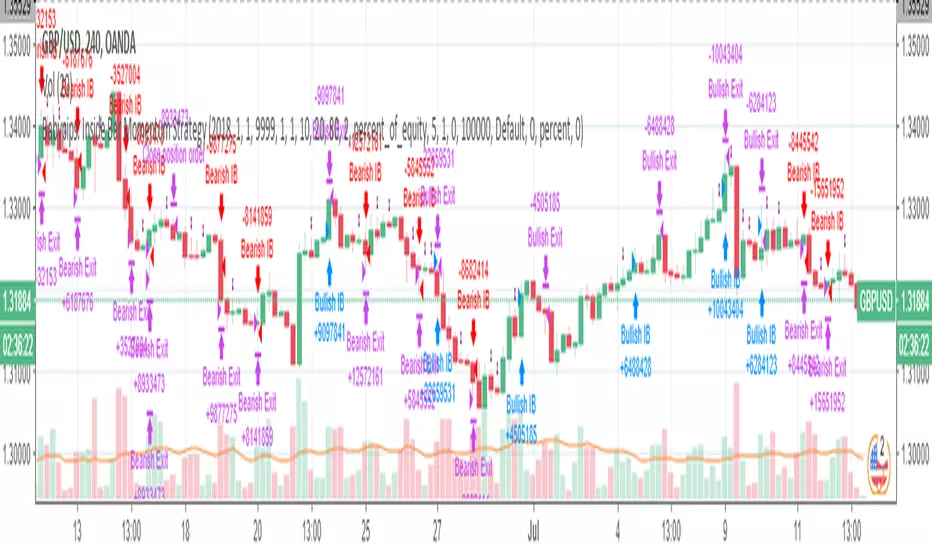
Babypips: Inside Bar Momentum StrategyThe strategy contained in this post comes courtesy of babypips (.com), an excellent resource for all thing forex related. If you are new to trading, the site is definitely worth checking out!
Code commentary and an introduction to Inside Bars are available for this post on the Backtest-Rookies (.com) website.
Note: If you are interested in custom development services, please check out our services page on the Backtest-Rookies site.
Strategy Overview
Inside Bar Momentum Strategy.
Inside Bar Detection
Position sizing based on stoploss distance ( Note: Based on equity and assumes that the account currency is the counter currency.
Stop buys for entries
Takeprofit / Stoplosses for exits
Control Stopbuy, Takeprofit and Stoploss targets with inputs
Control Backtest start/end dates
Linda Raschke's Holy GrailAnother script based on Linda Raschke's strategy with the same name from her book about swing trading.
Stupid strategyStrategy with simple stop-loss and take-profit in percentage. If last trade was a successful one then repeat it. If not successful - do a reversal trade.

The Falcon v2 [SETUP]Hello,
as requested here is the setup version of my previous script. Works perfectly for automatic trading using buy and sell simple strategy.
The indicator is built upon RSI , EMAs and some other personnal tricks so predict trends.
I coded a stop loss and take profit system : you have to set up the script parameters before creating the alert.
As usual I am selling access to the script, with a trial for those who want to test first. I am also open to development or reverse engineering commissions.

The Falcon v2 Long only strategy Using Stop loss and take profitHello,
Here is a backtest result from the beginning of the year on BTC. The white line is the Buy & Hold return.
Comission is set to 0.05% and there is no repainting : the price variable I'm using is heikenashi(tickerid).
The indicator is built upon RSI, EMAs and some other personnal tricks so predict trends.
I coded a stop loss and take profit system : the script will simply buy and sell upon conditions.
As usual I am selling access to the script, If some are interested I will publish an alert setup version. I am also open to development or reverse engineering commissions.

Take Profit Again Trend Score(Crpto Catcher)_BinanceTPA SCORE_BINANCE ver
또땃 스코어 바이낸스 ver
------------------------------------------------------------------------------
This indicator is designed to find coins that are strong in market conditions.
It is recommended that users have an understanding of basic charts.
Careful investment is needed after the trend of the score itself has been on the downward trend.
Coins usually give the strongest return that run at the top of the score.
The realization of the profit on the chart must be done by the person himself.
When purchasing coins at the top of the score chart, we recommend the number of sheets at the adjustment point on the chart.
Because this index is a trend score, you may not be able to catch the start wave. To do this, use a starting wave catcher.
The coins listed in this index are coins of the highest rank in order of trading volume and will be updated at regular intervals.
At last year's rise of coin, it is based on catching light coin, Qtum, ripple, Ada, Stella, Tron rise.
Indicator vouchers will only be available to a small number of paid subscribers.
Thank you.
---------------------------------------------------------------------------------------------
이 지표는 시장 상황에서 강세를 띠는 코인을 찾아내기 위해 만들어 졌습니다.
기본적인 차트에 대한 이해가 있는 사용자가 사용하길 권합니다.
스코어자체의 추세가 하향을 한 이후는 신중한 투자가 필요합니다.
통상 가장 강한 수익을 주는 코인이 스코어 최상단을 달립니다.
차트상의 수익실현은 본인이 직접 수행해야 합니다.
통상 스타팅 파동을 잡아내는 스타팅 파동 캐쳐와 함께 사용합니다.
스코어차트상 최상단의 코인을 매수 할 시 차트상 조정지점에서 매수를 권합니다.
본 지표는 트렌드 점수 이기 때문에 시작 파동을 잡아내지 못할 수 있습니다.
이를 위해선 스타팅웨이브 캐쳐를 함께 사용합니다.
본 지표에 나와있는 코인들은 거래량순으로 상위등급의 코인들이며 일정 간격으로 업데이트 될 것입니다.
작년 코인상승장에서, 라이트코인,Qtum,리플,에이다,스텔라,트론 상승을 잡아낸 기반지표 입니다.
지표 이용권은 소수의 유료 구독 사용자들에게만 공개될 예정입니다.
감사합니다.

SL/TP assistantThis is a simple script to quickly see changes in % in each candle.
In blue open/close variation. In red Histogram with range between high and low.
This helps me understand very quickly what's the typical change in % for a specific timeframe/pair, so I can fine tune my Stop Losses and Take Profits.

nATR Reversal StrategyATR Reversal Strategy that has been extended to add an additional ATR based stoploss, trailing stop and take profit.
This script was developed as part of a professional development service. It is published for customer verification and acceptance.
For people interested in professional services, please visit the backtest-rookies (.com) website.
Features
nATR based Stop Loss added
nATR based Trailing stop added
nATR based Take profit added
Switches for each exit type to turn them on or off in the strategy
Plotting of all exit levels on the chart
Prevent reversing when using newly added exits.
Allow reversing when all exit switches are off and opposite long/short conditions are met.
MA ExtensionThis indicator measures the vertical distance form the current close to the MA of your choice. I find that it does not work best as an oscillator, but it works well for providing early signals for taking profits when trend continuating. For example, if you go short due to a retracement to the MA (of your choice) take profits when a bearish trendline is broken (signalling the start of a bullish correction) that corresponds to the highs of the chart. The logic behind this indicator is that the breakouts of trendlines of an assets difference from an MA will precede corresponding breakouts of trendlines drawn on raw price. Kind of like Momentum, except it takes trend into account. Momentum has the same leading feature when it comes to drawing trendlines , but trendlines will be harder to draw due to the Momentum indicators oscillatory behavior.
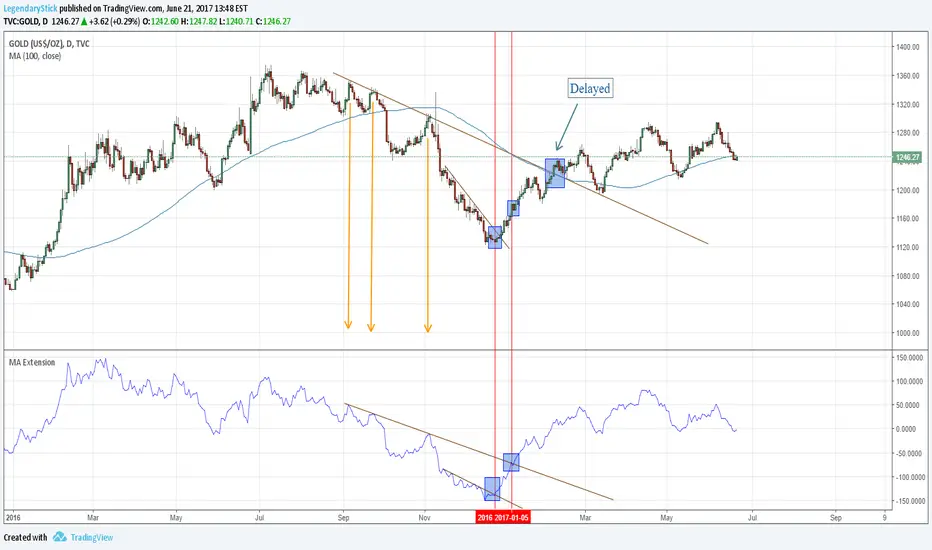
MA ExtensionThis indicator measures the vertical distance form the current close to the MA of your choice. I find that it does not work best as an oscillator, but it works well for providing early signals for taking profits when trend continuating. For example, if you go short due to a retracement to the MA (of your choice) take profits when a bearish trendline is broken (signalling the start of a bullish correction) that corresponds to the highs of the chart. The logic behind this indicator is that the breakouts of trendlines of an assets difference from an MA will precede corresponding breakouts of trendlines drawn on raw price. Kind of like Momentum, except it takes trend into account. Momentum has the same leading feature when it comes to drawing trendlines , but trendlines will be harder to draw due to the Momentum indicators oscillatory behavior.
