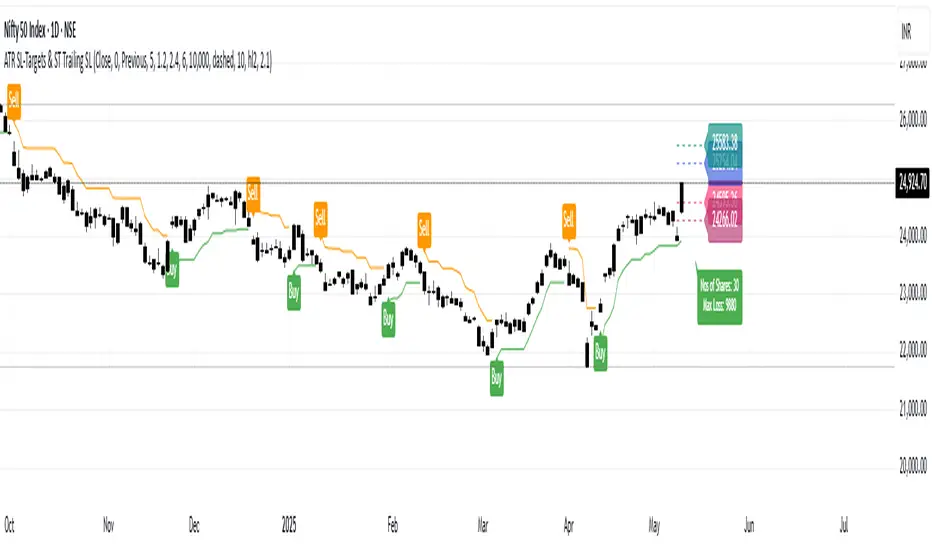
ATR Stop-Loss & TargetsATR and Supertrend-based SL/TP & Trailing System
This indicator combines Average True Range (ATR) and Supertrend logic to help traders define precise stop-loss, first target, and trailing stop-loss (TSL) levels.
⚙️ Key Features:
📏 ATR-based Stop-Loss & Target Lines:
Uses ATR (default period: 5) based on the previous day's candle for more stable risk management.
Traders can choose the price source: Close, Open, or enter a manual price.
SL and first target are calculated using multipliers:
Multiplier 1 = Stop Loss
Multiplier 2 = First Target
📉 Supertrend for Trailing Stop:
Built-in Supertrend logic for trailing stop-loss management.
Uses ATR(10) with a multiplier of 2.1, based on HL2.
Supertrend can be toggled ON/OFF from the settings.
Target
Trend Targets [AlgoAlpha]OVERVIEW
This script combines a smoothed trend-following model with dynamic price rejection logic and ATR-based target projection to give traders a complete visual framework for trading trend continuations. It overlays on price and automatically detects potential trend shifts, confirms rejections near dynamic support/resistance, and displays calculated stop-loss and take-profit levels to support structured risk-reward management. Unlike traditional indicators that only show trend direction or signal entries, this tool brings together a unique mix of signal validation, volatility-aware positioning, and layered profit-taking to guide decision-making with more context.
CONCEPTS
The core trend logic is built on a custom Supertrend that uses an ATR-based band structure with long smoothing chains—first through a WMA, then an EMA—allowing the trend line to respond to major shifts while ignoring noise. A key addition is the use of rejection logic: the script looks for consolidation candles that "hug" the smoothed trend line and counts how many consecutive bars reject from it. This behavior often precedes significant moves. A user-defined threshold filters out weak tests and highlights only meaningful rejections.
FEATURES
Trend Detection : Automatically identifies trend direction using a smoothed Supertrend (WMA + EMA), with shape markers on trend shifts and color-coded bars for clarity.
Rejection Signals : Detects price rejections at the trend line after a user-defined number of consolidation bars; plots ▲/▼ icons to highlight strong continuation setups.
Target Projection : On trend confirmation, plots entry, stop-loss (ATR-based), and three dynamic take-profit levels based on customizable multiples.
Dynamic Updates : All levels (entry, SL, TP1–TP3) auto-adjust based on volatility and are labeled in real time on the chart.
Customization : Users can tweak trend parameters, rejection confirmation count, SL/TP ratios, smoothing lengths, and appearance settings.
Alerts : Built-in alerts for trend changes, rejection events, and when TP1, TP2, or TP3 are reached.
Chart Overlay : Plots directly on price chart with minimal clutter and clearly labeled levels for easy trading.
USAGE
Start by tuning the Supertrend factor and ATR period to fit your asset and timeframe—higher values will catch bigger swings, lower values catch faster moves. The confirmation count should match how tightly you want to filter rejection behavior—higher values make signals rarer but stronger. When the trend shifts, the indicator colors the bars and line accordingly, and if enabled, plots the full entry-TP-SL structure. Rejection markers appear only after enough qualifying bars confirm price pressure at the trend line. This is especially useful for continuation plays where price retests the trend but fails to break it. All calculations are based on volatility (ATR), so targets naturally adjust with market conditions. Add alerts to get notified of important signals even when away from the chart.

Wolfe Wave Detector [LuxAlgo]The Wolfe Wave Detector displays occurrences of Wolfe Waves, alongside a target line. A multiple swing detection approach is used to maximize the number of detected waves.
The indicator includes a dashboard with the number of detected waves, as well as the number of reached targets.
🔶 USAGE
The Wolfe Wave pattern is a chart pattern composed of five segments, with the initial segment extremities (points XABCD) forming a channel containing price variations.
After the price reaches point D , we can expect a reversal toward a target line (point E ). The target line is obtained by connecting and extending point X -> C .
The script draws the XABCD pattern and a projection of where E might potentially be located.
The projection is derived from the intersection between the target line and a line starting from D , parallel to B-C . From this line, margins are added, left and right, creating a wedge-shaped figure in most cases.
When the price passes the target line, this is highlighted by a dot. The dot and pattern are green by default when the target is above D and red when the target is below D . Colors can be edited in the settings. The dashed target line is colored in the opposite color.
As seen in the above example, the price trend can reverse after reaching the target line.
🔹 Symmetry
Ideally, the Wolfe Wave must have a degree of symmetry; every upward line should have a similar angle to the other upward lines, and the same should be true for the downward lines.
Also, the lines forming the channel should be as parallel as possible.
Users have the option to adjust the tolerance:
Margin controls the wave symmetry of the pattern
Angle controls the channel symmetry of the pattern
It's important to note that in both cases, a lower number will lead to more symmetrical patterns, but they may appear less frequently.
It is also important to note that increasing the Margin can delay validating the pattern. In the meantime, the price could surpass the channel in the opposite direction, invalidating and deleting the otherwise valid pattern.
🔹 Multiple Swings
Users can set a Minimum Swing length (for example 2) and a Maximum Swing length (for example 100) which defines the range of the swing point detection length, higher values for these settings will detect longer-term Wolfe patterns, while a larger range will allow for the detection of a larger number of patterns.
By using multiple swings, it is possible to find smaller next to larger patterns at the same time.
The dashboard shows the number of patterns found and targets reached. When, for example, bullish patterns are disabled in the settings, the dashboard only shows the results of bearish patterns.
🔹 Extend Target Line
The publication includes a setting that allows the Target Line to be extended up to 50 bars further. As seen in the above example, the Target Line can still be reached even after the pattern has been finalized. Once the Target Line is reached, it won't be updated further.
Here is another example of a Target Line being reached later on.
The Target Line acted as a support level, after which where the price changed direction.
🔹 Show Progression
An option is included to show the progression before the pattern is completed. Users can make use of the XABC pattern or visualize where point D should be positioned.
The focus lies on the bar range (between the left and right borders of the grey rectangle). The pattern is considered invalid and deleted when point D is beyond these limits. The height of the rectangle is optional. Ideally, the price should be located between the top and bottom of the rectangle, but it is not mandatory.
Show Progression has three options including:
Full: Show all lines of XABC plus line C-D and rectangle for the position of point D
Partial: Show line C-D and rectangle for the position of point D
None: Only show valid completed patterns
The 'Partial' option in the 'Show Progression' feature is designed to help users locate the desired position of point D without the visual clutter caused by the XABC lines. This can be useful for those who prefer a cleaner visual representation of the evolving pattern.
🔶 SETTINGS
🔹 Swing Length
Minimum: Minimum length used for the swing detection.
Maximum Swing Length: Maximum length used for the swing detection.
🔹 Tolerance
Margin: Influences the symmetry of the pattern; with a higher number allowing for less symmetry.
Angle: Influences the symmetry of the channel; with a higher number allowing for less symmetry.
🔹 Style
Toggle: Bullish/Bearish + colors
Extend Target Line: Extend a maximum of 50 bars or until Target Line is reached
Show Progression: Show pattern progression
Dot Size: The size of the dot when the Target Line is reached
🔹 Dashboard
Show Dashboard: Toggle dashboard which shows the number of found patterns and targets reached.
Location: Location of the dashboard on the chart.
Text Size: Text size.
🔹 Calculation
Calculated Bars: Allows the usage of fewer bars for performance/speed improvement

Volatility Adjusted Profit Target
In my 'Volatility Adjusted Profit Target' indicator, I've crafted a dynamic tool for calculating target profit percentages suitable for both long and short trading strategies. It evaluates the highest and lowest prices over the anticipated duration of your trade, establishing a profit target that shifts with market volatility. As volatility increases, the potential for profit follows, with the target percentage rising accordingly; conversely, it declines with decreasing volatility. As a trader, setting an optimal Take Profit level has always been a challenge. This indicator not only helps in determining that level but also dynamically adjusts it throughout the trade's duration, providing a strategic edge in volatile markets.

Blockunity Level Presets (BLP)A simple tool for setting performance targets.
Level Presets (BLP) is a simple tool for setting upside and downside levels relative to the current price of any asset. In this way, you can track which price the asset needs to move towards in order to achieve a defined performance.
How to Use
This indicator is very easy to use, you can set up to 5 upward and downward targets in the parameters.
Elements
The main elements of this tool are upward (default green) and downward (default red) levels.
Settings
Several parameters can be defined in the indicator configuration.
In addition to configuring which performance value to set the level at, you can choose not to display it if you don't need it. For example, here we display only two levels:
You can also choose not to display the labels:
Also concerning labels, you can choose not to display them in currency format, but in numerical format only (for example, if you're viewing a non-USD pair, such as ETHBTC):
Finally, you can modify design elements such as colors, level widths and text size:
How it Works
Here's how upside (_u) and downside (_d) levels are calculated:
source = close
level_1_u = source + (source * (level_1 / 100))
level_1_d = math.max(source - (source * (level_1 / 100)), 0)

Targets For Many Indicators [LuxAlgo]The Targets For Many Indicators is a useful utility tool able to display targets for many built-in indicators as well as external indicators. Targets can be set for specific user-set conditions between two series of values, with the script being able to display targets for two different user-set conditions.
Alerts are included for the occurrence of a new target as well as for reached targets.
🔶 USAGE
Targets can help users determine the price limit where the price might start deviating from an indication given by one or multiple indicators. In the context of trading, targets can help secure profits/reduce losses of a trade, as such this tool can be useful to evaluate/determine user take profits/stop losses.
Due to these essentially being horizontal levels, they can also serve as potential support/resistances, with breakouts potentially confirming new trends.
In the above example, we set targets 3 ATR's away from the closing price when the price crosses over the script built-in SuperTrend indicator using ATR period 10 and factor 3. Using "Long Position Target" allows setting a target above the price, disabling this setting will place targets below the price.
Users might be interested in obtaining new targets once one is reached, this can be done by enabling "New Target When Reached" in the target logic setting section, resulting in more frequent targets.
Lastly, users can restrict new target creation until current ones are reached. This can result in fewer and longer-term targets, with a higher reach rate.
🔹 Dashboard
A dashboard is displayed on the top right of the chart, displaying the amount, reach rate of targets 1/2, and total amount.
This dashboard can be useful to evaluate the selected target distances relative to the selected conditions, with a higher reach rate suggesting the distance of the targets from the price allows them to be reached.
🔶 DETAILS
🔹 Indicators
Besides 'External' sources, each source can be set at 1 of the following Build-In Indicators :
ACCDIST : Accumulation/distribution index
ATR : Average True Range
BB (Middle, Upper or Lower): Bollinger Bands
CCI : Commodity Channel Index
CMO : Chande Momentum Oscillator
COG : Center Of Gravity
DC (High, Mid or Low): Donchian Channels
DEMA : Double Exponential Moving Average
EMA : Exponentially weighted Moving Average
HMA : Hull Moving Average
III : Intraday Intensity Index
KC (Middle, Upper or Lower): Keltner Channels
LINREG : Linear regression curve
MACD (macd, signal or histogram): Moving Average Convergence/Divergence
MEDIAN : median of the series
MFI : Money Flow Index
MODE : the mode of the series
MOM : Momentum
NVI : Negative Volume Index
OBV : On Balance Volume
PVI : Positive Volume Index
PVT : Price-Volume Trend
RMA : Relative Moving Average
ROC : Rate Of Change
RSI : Relative Strength Index
SMA : Simple Moving Average
STOCH : Stochastic
Supertrend
TEMA : Triple EMA or Triple Exponential Moving Average
VWAP : Volume Weighted Average Price
VWMA : Volume-Weighted Moving Average
WAD : Williams Accumulation/Distribution
WMA : Weighted Moving Average
WVAD : Williams Variable Accumulation/Distribution
%R : Williams %R
Each indicator is provided with a link to the Reference Manual or to the Build-In Indicators page.
The latter contains more information about each indicator.
Note that when "Show Source Values" is enabled, only values that can be logically found around the price will be shown. For example, Supertrend , SMA , EMA , BB , ... will be made visible. Values like RSI , OBV , %R , ... will not be visible since they will deviate too much from the price.
🔹 Interaction with settings
This publication contains input fields, where you can enter the necessary inputs per indicator.
Some indicators need only 1 value, others 2 or 3.
When several input values are needed, you need to separate them with a comma.
You can use 0 to 4 spaces between without a problem. Even an extra comma doesn't give issues.
The red colored help text will guide you further along (Only when Target is enabled)
Some examples that work without issues:
Some examples that work with issues:
As mentioned, the errors won't be visible when the concerning target is disabled
🔶 SETTINGS
Show Target Labels: Display target labels on the chart.
Candle Coloring: Apply candle coloring based on the most recent active target.
Target 1 and Target 2 use the same settings below:
Enable Target: Display the targets on the chart.
Long Position Target: Display targets above the price a user selected condition is true. If disabled will display the targets below the price.
New Target Condition: Conditional operator used to compare "Source A" and "Source B", options include CrossOver, CrossUnder, Cross, and Equal.
🔹 Sources
Source A: Source A input series, can be an indicator or external source.
External: External source if 'External" is selected in "Source A".
Settings: Settings of the selected indicator in "Source A", entered settings of indicators requiring multiple ones must be comma separated, for example, "10, 3".
Source B: Source B input series, can be an indicator or external source.
External: External source if 'External" is selected in "Source B".
Settings: Settings of the selected indicator in "Source B", entered settings of indicators requiring multiple ones must be comma separated, for example, "10, 3".
Source B Value: User-defined numerical value if "value" is selected in "Source B".
Show Source Values: Display "Source A" and "Source B" on the chart.
🔹 Logic
Wait Until Reached: When enabled will not create a new target until an existing one is reached.
New Target When Reached: Will create a new target when an existing one is reached.
Evaluate Wicks: Will use high/low prices to determine if a target is reached. Unselecting this setting will use the closing price.
Target Distance From Price: Controls the distance of a target from the price. Can be determined in currencies/points, percentages, ATR multiples, ticks, or using multiple of external values.
External Distance Value: External distance value when "External Value" is selected in "Target Distance From Price".

Targets For Overlay Indicators [LuxAlgo]The Targets For Overlay Indicators is a useful utility tool able to display targets during crossings made between the price and external indicators on the user chart. Users can display a series of two targets, one for crossover events and another one for crossunder event.
Alerts are included for the occurrence of a new target as well as for reached targets.
🔶 USAGE
In order for targets to be displayed users need to select an appropriate input source from the "Source" drop-down input setting. In the example above we apply the indicator to a volatility stop.
This can also easily be done by adding the "Targets For Overlay Indicators" script on the VStop indicator directly.
Targets can help users determine the price limit where the price might start deviating from an indication given by one or multiple indicators. In the context of trading, targets can help secure profits/reduce losses of a trade, as such this tool can be useful to evaluate/determine user take profits/stop losses.
Due to these essentially being horizontal levels, they can also serve as potential support/resistances, with breakouts potentially confirming new trends.
Users might be interested in obtaining new targets once one is reached, this can be done by enabling "New Target When Reached" in the target logic setting section, resulting in more frequent targets.
Lastly, users can restrict new target creation until current ones are reached. This can result in fewer and longer-term targets, with a higher reach rate.
🔹 Examples
The indicator can be applied to many overlay indicators that naturally produce crosses with the price, such as moving average, trailing stops, bands...etc.
Users can use trailing stops such as the SuperTrend or VStop to more easily create clean targets. Do note that certain SuperTrend scripts separate the upper and lower extremities of the SuperTrend into two different plot, which cannot be used with this tool, you may use the provided SuperTrend script below to have a compatible version with our tool:
//@version=5
indicator("SuperTrend", overlay = true)
factor = input.float(3, 'Factor', minval = 0)
atrLen = input.int(10, 'ATR Length', minval = 1)
= ta.supertrend(factor, atrLen)
plot(spt, 'SuperTrend', dir != dir ? na : dir < 0 ? #089981 : #f23645, 2)
plot(spt, 'Circles', dir > dir ? #f23645 : dir < dir ? #089981 : na, 3, plot.style_circles)
Using moving averages can produce more targets than other overlay indicators.
Users can apply the tool twice when using bands or any overlay indicator returning two outputs, using crossover targets for obtaining targets using the upper band as source and crossunder targets for targets using the lower band. We can also use the Trendlines with breaks indicator as example:
🔹 Dashboard
A dashboard is displayed on the top right of the chart, displaying the amount, reach rate of targets 1/2, and total amount.
This dashboard can be useful to evaluate the selected target distances relative to the selected conditions, with a higher reach rate suggesting the distance of the targets from the price allows them to be reached.
🔶 SETTINGS
Source: Indicator source used to create targets. Targets are created when the closing price crosses the specified source.
Show Target Labels: Display target labels on the chart.
Candle Coloring: Apply candle coloring based on the most recent active target.
🔹 Target
Crossover and Crossunder targets use the same settings below:
Show Target: Determines if the target is displayed or not.
Above Price Target: If selected, will create targets above the closing price.
Wait Until Reached: When enabled will not create a new target until an existing one is reached.
New Target When Reached: Will create a new target when an existing one is reached.
Evaluate Wicks: Will use high/low prices to determine if a target is reached. Unselecting this setting will use the closing price.
Target Distance From Price: Controls the distance of a target from the price. Can be determined in currencies/points, percentages, ATR multiples, or ticks.

Risk Management GO8686: Stop Loss, Position Size & TargetFull Name: Risk Management GO8686: Stop Loss, Position Size & Target
What this indicator provides:
A dashboard to calculate Stop Loss, Position Size and Target, where users can customize Risk Management parameters in the setting.
Position Size: calculated from "initialCapital", "Leverage", "Max Loss", "feeMaker", "feeTaker".
Stop Loss Price: using pivots, default length is set to 3, with an extra ATR value controlled by "'Multiplier OF Extra ATR".
Target: calculated from entry price, risk reward, distance between entry and stop loss, fees
What the indicator does Not provides:
entries of positions: The Long/Short entries displayed are just MACD signal crossing zero, users can apply their own entry logic, by modifying ready2L / ready2S variables.
What the indicator does Not guarantee:
the integrity, timeliness, accuracy, and comprehensiveness of the data, calculation method, calculation results, etc.
Two types labels:
1. Automated labels: they are displayed when MACD signal crossing zero, use "Display History Labels" to toggle display or not.
2. Setup Manually label: located at the right side of the latest bar, to display results when users setup manually
The settings of the indicator:
"Toggle to Reload",
"InitialCapital", "Leverage", "Max Loss % per trade", "feeMaker", "feeTaker",
4 length inputs for Pivot, "Multiplier of Extra ATR for stop loss",
"Toggle To setup manually", "Toggle between Long / Short", "Entry Price, set manually", "Stop Loss Price, set manually", "Risk-Reward Ratio"
"Display History Labels"
---------- Disclaimer ----------
Before using or requesting access to the indicator, customers/users acknowledge that they have read and accepted that the indicator, any associated contents on all social medias and any communication with the indicator author, including but not limited to: product and service details, signals, alerts, data, calculation methods, calculation results, user manual, tutorials, ideas, videos, chats, messages, emails, blogs, tweets, etc. are provided solely for educational purpose and Not as financial advice. Customers/users understand and agree to use the aforementioned indicator and information at their own risk.
---------- Updates ----------
The latest updates override the previous content.
To activate a update, if it does not load as expected: close the indicator, save the chart, clear browser caches, restart the browser, reload the chart and apply the indicator to the chart.

Range BreakerStrategy Description: Range Breaker
The Range Breaker strategy is a breakout trading strategy that aims to capture profits when the price of a financial instrument moves out of a defined range. The strategy identifies swing highs and swing lows over a specified lookback period and enters long or short positions when the price breaks above the swing high or below the swing low, respectively. It also employs stop targets based on a percentage to manage risk and protect profits.
Beginner's Guide:
Understand the concepts:
a. Swing High: A swing high is a local peak in price where the price is higher than the surrounding prices.
b. Swing Low: A swing low is a local trough in price where the price is lower than the surrounding prices.
c. Lookback Period: The number of bars or periods the strategy analyzes to determine swing highs and swing lows.
d. Stop Target: A predetermined price level at which the strategy will exit the position to manage risk and protect profits.
Configure the strategy:
a. Set the initial capital, order size, commission, and pyramiding as needed for your specific trading account.
b. Choose the desired lookback period to identify the swing highs and lows.
c. Set the stop target multiplier and stop target percentage as desired to manage risk and protect profits.
Backtest the strategy:
a. Set the backtest start date to analyze the strategy's historical performance.
b. Observe the backtesting results to evaluate the strategy's effectiveness and adjust the parameters if necessary.
Implement the strategy:
a. Apply the strategy to your preferred financial instrument on the TradingView platform.
b. Monitor the strategy's performance and adjust the parameters as needed to optimize its effectiveness.
Risk management:
a. Always use a stop target to protect your trading capital and manage risk.
b. Don't risk more than a small percentage of your trading capital on a single trade.
c. Be prepared to adjust the strategy or stop trading it if the market conditions change significantly.
Adjusting the Lookback Period and Timeframes for Optimal Strategy Performance
The Range Breaker strategy uses a lookback period to identify swing highs and lows, which serve as the basis for determining entry and exit points for long and short positions. By adjusting the lookback period and analyzing different timeframes, you can potentially find the best strategy configuration for each specific asset.
Adjusting the lookback period:
The lookback period is a critical parameter that affects the sensitivity of the strategy to price movements. A shorter lookback period will make the strategy more sensitive to smaller price fluctuations, resulting in more frequent trading signals. On the other hand, a longer lookback period will make the strategy less sensitive, generating fewer signals but potentially capturing larger price movements.
To optimize the lookback period for a specific asset, you can test different lookback values and compare their performance in terms of risk-adjusted returns, win rate, and other relevant metrics. Keep in mind that using an overly short lookback period may lead to overtrading and increased transaction costs, while an overly long lookback period may cause the strategy to miss profitable trading opportunities.
Analyzing different timeframes:
Timeframes refer to the duration of each bar or candlestick on the chart. Shorter timeframes (e.g., 5-minute, 15-minute, or 30-minute) focus on intraday price movements, while longer timeframes (e.g., daily, weekly, or monthly) capture longer-term trends. The choice of timeframe affects the number of trading signals generated by the strategy and the length of time each position is held.
To find the best strategy for each asset, you can test the Range Breaker strategy on different timeframes and analyze its performance. Keep in mind that shorter timeframes may require more active monitoring and management due to the increased frequency of trading signals. Longer timeframes, on the other hand, may require more patience as positions are held for extended periods.
Finding the best strategy for each asset:
Every asset has unique price characteristics that may affect the performance of a trading strategy. To find the best strategy for each asset, you should:
a. Test various lookback periods and timeframes, observing the strategy's performance in terms of profitability, risk-adjusted returns, and win rate.
b. Consider the asset's historical price behavior, such as its volatility, liquidity, and trend-following or mean-reverting tendencies.
c. Evaluate the strategy's performance during different market conditions, such as bullish, bearish, or sideways markets, to ensure its robustness.
d. Keep in mind that each asset may require a unique set of strategy parameters for optimal performance, and there may be no one-size-fits-all solution.
By experimenting with different lookback periods and timeframes, you can fine-tune the Range Breaker strategy for each specific asset, potentially improving its overall performance and adaptability to changing market conditions. Always practice proper risk management and be prepared to make adjustments as needed.
Remember that trading strategies carry inherent risk, and past performance is not indicative of future results. Always practice proper risk management and consider your own risk tolerance before trading with real money.

Scaled Order Sizing and Take Profit Target ArraysWOAH Order Scaling!
This Provides a user with methods to create a list of profit targets and order sizes which grow or shrink. For size, the will add up to specific sum. for Targets they will include the first and last, and can lean towards either, to scale the order grid.
And thanks to @Hoanghetti for the markdown, i've included a basic usage example within the hover , o you don't need to search for the usage example, simply import, and when writing, the code hint contains a full example.
scaled_sizes(total_size, count, weight, min_size, as_percent)
create an array of sizes which grow or shrink from first to last
which add up to 1.0 if set the as_percent flag , or a total value / sum.
Parameters:
total_size : (float) total size to divide ito split
count : (int ) desired number of splits to create
weight : (float) a weight to apply to grow or shrink the split either towards the last being most, or the first being most, or 1.0 being each is equally sized as 1/n count
min_size : (float) a minimum size for the smallest value (in value of ttotal_size units)
as_percent : (float) a minimum size for the smallest value (in value of total_size units)
Returns: Array of Sizes for each split
scaled_targets(count, weight, minimum, maximum)
create a list of take profitt targets from the smallest to larget distance
Parameters:
count : (int ) number of targets
weight : (float) weight to apply to growing or shrinking
minimum : (float) first value of the output
maximum : (float) last value of the output
Returns: Array of percentage targets

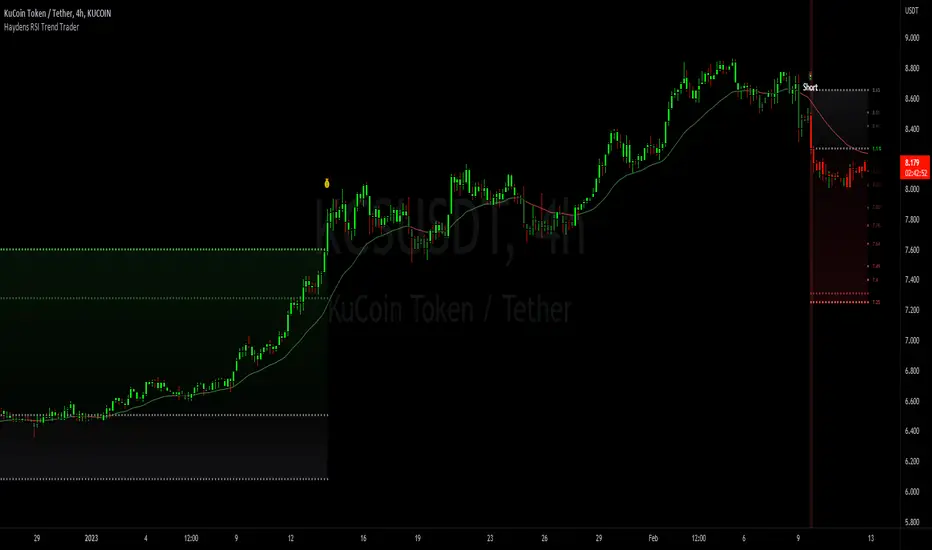
Haydens RSI Trend TraderThis is a simple trend trading companion indicator for Hayden's Advanced RSI, which can be found here:
For best results, please be sure your oscillator and chart companion settings match. Detailed trade information & statistics can be found when hovering over any of the indicator labels. The backtesting results are not calculated the same as TradingView, and the original code can be found here
Shoutout to the following authors for the code snippets that were used in making this indicator: @lazybear @kiosefftrading @Koalafied_3 @mabonyi @Capissimo
Calculate target by Range [Wyckoff,PnF]First of all, I would like to thank the author @LonesomeTheBlue.
This indicator developed on the source code "Point and Figure (PnF)" by author @LonesomeTheBlue.
This indicator calculate the range (Cause) of Phase accumulation or distribution to calculate the taget (Effect) based on the Wyckoff Method.
Formula for calculate move value target : Col * BoxSize * Reversal
Col -> Number of Column (PnF) in the range (Cause)
BoxSize -> Value in one Box (PnF)
Reversal -> Reversal (PnF)

Spinn ATR targetNot quite the usual approach to plotting targets on the chart, where the price will come with a given probability.
The indicator draws targets by studying the ATR of the target timeframe. More precisely, this is not exactly an ATR - the price move is taken from the closing price of the previous bar and is calculated both up and down separately.
The settings specify the percentage used to calculate the price move, at which the specified percentage of bars reached this price move in the past.
Simply put, if we set 50% in the settings, this means that a line will be drawn at the level at which the price reached this level in 50% of cases over a given period.
--
Не совсем обычный подход к построению целей на графике, куда цена придет с заданной вероятностью.
Индикатор рисует цели, изучая ATR целевого таймфрейма. Точнее, это не совсем ATR - ход цены берется от цены закрытия предыдущего бара и считается отдельно как вверх, так и вниз.
В настройках задается процент, исходя из которого вычисляется ход цены, при котором заданный процент баров достигал этого хода цены ранее.
Проще говоря, если мы задаем в настройках 50%, то это означает, что будет построена линия на том уровне, на котором цена в 50% случаев за заданный период достигала этого уровня.

No-lose trading targets (Based on MFI) By Mustafa ÖZVERThis code shows expected reaction target prices after sudden moving based on MFI . Red area means the price is on overbought area, green area means the price is on oversold area. If you see red area under price, you can make short option to next to the horizontal beginning price of red area. If you see green area over price, you can make long option to next to the horizontal beginning price of green area.
When this code works
- The green area starts where mfi value is on oversold
- The red area starts where mfi value is on overbought
Of course, this code may be failed, do not forget the target may never come. But hopefully price will cross over the target.
And you (as developers) can develop this code by using anything instead of mfi to get up-down target prices.
But only this values can not guarantee good results for trading. BE CAREFUL

ATR BandsIn many strategies, it's quite common to use a scaled ATR to help define a stop-loss, and it's not uncommon to use it for take-profit targets as well. While it's possible to use the built-in ATR indicator and manually calculate the offset value, we felt this wasn't particularly intuitive or efficient, and could lead to the potential for miscalculations. And while there are quite a few indicators that plot ATR bands in some form or another already on TV, we could not find one that actually performed the exact way that we wanted. They all had at least one of the following gaps:
The ATR offset was not configurable (usually hard-coded to be based off the high or low, while we generally prefer to use close)
It would only print a single band (either the upper or lower), which would require the same indicator to be added twice
The ATR scaling factor was either not configurable or only stepped in whole numbers (often time fractional factors like 1.5 yield better results)
To that end, we took to making this enhanced version to meet all of the above requirements. While we were doing so, we decided to take this opportunity to also make some non-functional enhancements as well:
Updated the indicator to the most recent version of Pine
Updated the indicator definition to allow alternate (non-chart) timeframe usage
Made the input types explicitly defined to improve consistency
Updated the inputs with appropriate minimum values and step sizes where appropriate
Separated settings into logical groups
Added helptext to the indicator settings noting usage and common settings values
Explicitly titled the on-chart plots of the ATR bands so that they can more easily be identified and referenced in other indicators/scripts, as well as the Data Window
Food for thought : When looking at some of the behaviors of these ATR bands, you can see that when price first levels out, you can draw a "consolidation zone" from the first peak of the upper ATR band to the first valley of the lower ATR band that price will generally respect. Look for price to break and close outside of that zone. When that happens, price will usually (but not always) make a notable move in that direction, which can be used as either a potential trigger or as an additional confluence with other indicators/price action.
Finally, while we have made what we feel are some noteworthy updates and enhancements to this indicator, and have every intention of continuing to do so as we find worthy opportunities for enhancement, credit is still due to the original author: AlexanderTeaH

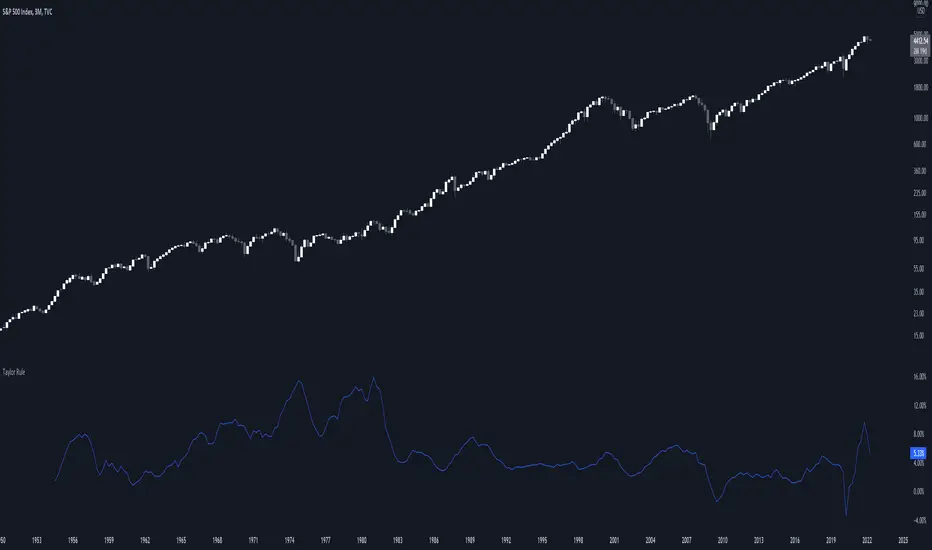
Taylor RuleThe Taylor rule is a simple formula that John Taylor devised to guide policymakers. It calculates what the federal funds rate should be, as a function of the output gap and current inflation. Here, we measure the output gap as the difference between potential output and real GDP. Inflation is measured by changes in the CPI, and we use a target inflation rate of 2%. We also assume a steady-state real interest rate of 2%.
Bias Pivot PointA simple indicator that uses Pivot Points as a filter and to generate a Directional Bias .
How to use this indicator?
1. Directional Bias
Bullish => Closing Price > Pivot Point
Bearish => Closing Price < Pivot Point
2. Support / Resistance
Each Pivot Points can be used as Support or Resistance
3. Take Profit Targets
Each Pivot Points can be used as targets for taking profit

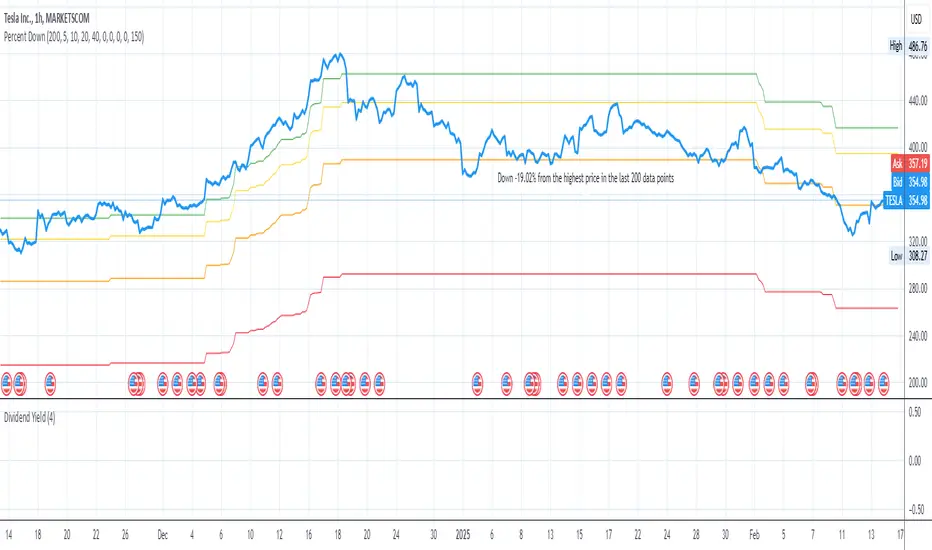
Price Target Pullback Correction or BearPrice Target percent drop is an indicator that allows you to set default percentage down from the 52 week high.
A pullback, correction, bear and a bear market is marked as a 5%, 10%, 20% or 40% drop from the 52 week highest price, so this will show the target price to buy at if these thresholds are hit.
You can change the default values of 5%, 10%, 20% and 40% to any percentage and the price will reflect the change of the default value. Furthermore, the default to use 52 weeks can be changed to find the highest price from the last 26 weeks or 104 weeks.
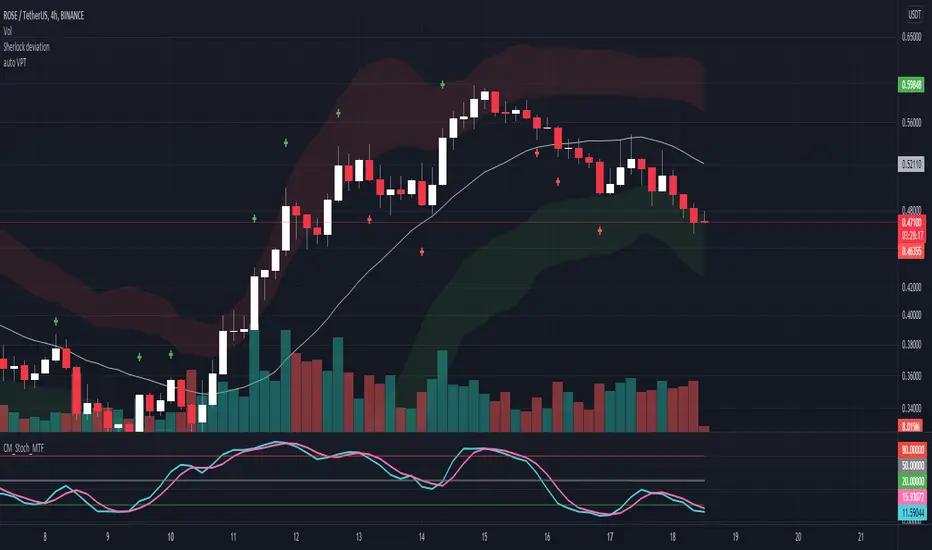
Auto VPTWhenever the volume of a candle is at or over 1.5 times the previous volume, it automatically places a cross on the Volume Price Target (candle range projected from the close) of the candle with abnormal volume.
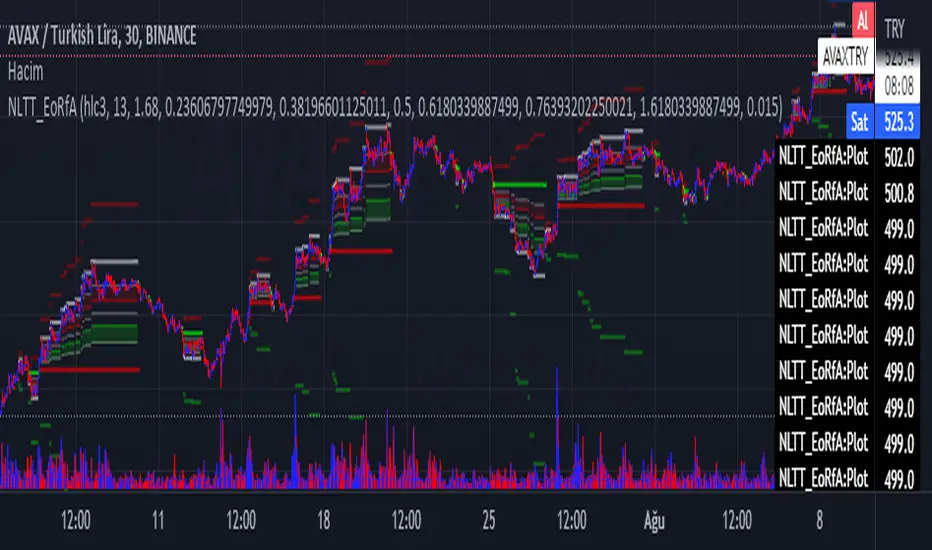
No-lose trading targets (Based on EoRfA) By Mustafa ÖZVERThis code shows expected reaction target prices after sudden moving based on (EoRfA) Escaping of Rate from Avarage. Red area means the price is on overbought area, green area means the price is on oversold area. If you see red area under price, you can make short option to next to the horizontal beginning price of red area. If you see green area over price, you can make long option to next to the horizontal beginning price of green area.
When this code works
- The green area starts where EoRfA value is on oversold
- The red area starts where EoRfA value is on overbought
Of course, this code may be failed, do not forget the target may never come. But hopefully price will cross over the target.
And you (as developers) can develop this code by using anything instead of EoRfA to get up-down target prices.
But only this values can not guarantee good results for trading. BE CAREFUL
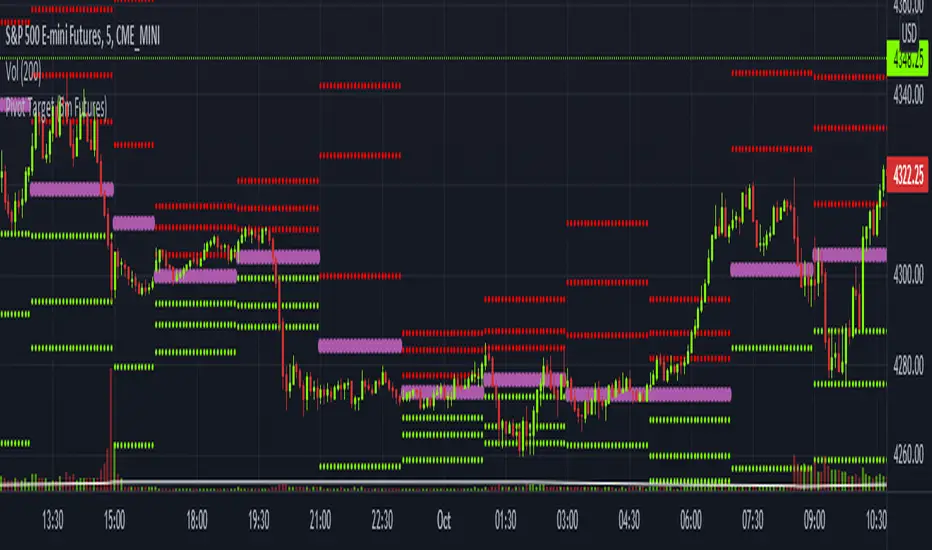
Pivot Target (5m Futures)I am new to both Futures Trading and Pivots. Looking for shorter-term profitable opportunities, I have investigated the use of pivots from a higher timeframe. All the work of this script is performed using two lines. It calculates the pivot from the previous 2-hour bar and draws this pivot line on the 5-minute timeframe. Many many times, the price will reach back to this pivot point - sometimes fairly quickly within the same horizontal pivot line and sometimes farther out (4-hours to 6-hours, or within the next few days). Price tends to reach the level around ninety percent of the time, making for plenty of short-term trading opportunities.
I get the best results when I see the price rise or fall from the pivot, along with a second indicator indicating a possible reversal (my favorite is Divergence for Many Indicators v4 by LonesomeTheBlue . Who knew divergence (both regular and hidden) was so common and useful for finding probable reversals? If I find the price above or below the pivot line with a second signal, I'll place a buy or sell within that same 2-hour window the price tends to return back to the higher timeframe pivot for a nice profit very quickly. Other times it does take a little longer to return with only a small percentage of time not returning within a reasonable amount of time, or very unusually, not at all. The image above shows a number of profitable trading opportunities using a combination of the Pivot Target and LonesomeTheBlue's Divergence for Many Indicators v4. You can further limit risk by only taking trades that are in the same direction of the overall trend, possibly confirmed on a higher timeframe.
This script will only be visible on the 5-minute timeframe the way it is written right now. I wouldn't suggest shorter or longer timeframes unless some editing is done by you. It doesn't seem to work as well with stocks, but is best on Futures due to the wave-like natures of the futures market. Trade safe, trade with the trend, use stops and limits appropriately and stay safe.
No-lose trading targets (based on RSI) By Mustafa ÖZVERThis code shows expected reaction target prices after sudden moving based on RSI. Red area means the price is on overbought area, green area means the price is on oversold area. If you see red area under price, you can make short option to next to the horizontal beginning price of red area. If you see green area over price, you can make long option to next to the horizontal beginning price of green area.
When this code works
- The green area starts where rsi value is on oversold
- The red area starts where rsi value is on overbought
Of course, this code may be failed, do not forget the target may never come. But hopefully price will cross over the target.
And you (as developers) can develop this code by using anything instead of rsi to get up-down target prices.
But only this values can not guarantee good results for trading. BE CAREFUL

MultiPrice AlertThis is an alert script using Pinescript version 4. This enables one to set 5 alerts (1 StopLoss, 4 Targets), on 3 different symbols, at using a single alert in the UI.
Every visible line will only appear on the symbols that are selected. After setting targets when making an alert, select this indicator as a condition. Change the name to whatever you want, usually the names of the set of tickers.
The Alert message is dyanmic showing which Symbol with each type of alert, at whatever price.
Ability to disable the targets + symbols.
Alerts work by Stop Loss crossing under price and Targets Cross Over. Enabling the "Short" Targets reverses this.
The line that is being displayed is actually the price of the asset being moved over x number of bars. I have not found a way to plot a traditional horizontal line, as the code for it uses a fixed price.
As it being a user input, it is a variable. Any help with this would be appreicated.
Alerts are set to once per bar.
Known bug that sometimes if the prices that you set are inside the current candle stick, then your alert will immeaditally fire, either change the timeframe or let it fire and wait fo
After a target is hit, I reccomend setting the alert to 0 and REMAKING the alert. You MUST REMAKE THE ALERT AFTER ANY CHANGES. This script WILL NOT CHANGE ALERTS AS YOU CHANGE SETTINGS.
TradingView Alerts are not this smart , at least I haven't found a way to do this yet.
