4 Bar Momentum Reversal strategy█ STRATEGY DESCRIPTION
The "4 Bar Momentum Reversal Strategy" is a mean-reversion strategy designed to identify price reversals following a sustained downward move. It enters a long position when a reversal condition is met and exits when the price shows strength by exceeding the previous bar's high. This strategy is optimized for indices and stocks on the daily timeframe.
█ WHAT IS THE REFERENCE CLOSE?
The Reference Close is the closing price from X bars ago, where X is determined by the Lookback period. Think of it as a moving benchmark that helps the strategy assess whether prices are trending upwards or downwards relative to past performance. For example, if the Lookback is set to 4, the Reference Close is the closing price 4 bars ago (`close `).
█ SIGNAL GENERATION
1. LONG ENTRY
A Buy Signal is triggered when:
The close price has been lower than the Reference Close for at least `Buy Threshold` consecutive bars. This indicates a sustained downward move, suggesting a potential reversal.
The signal occurs within the specified time window (between `Start Time` and `End Time`).
2. EXIT CONDITION
A Sell Signal is generated when the current closing price exceeds the high of the previous bar (`close > high `). This indicates that the price has shown strength, potentially confirming the reversal and prompting the strategy to exit the position.
█ ADDITIONAL SETTINGS
Buy Threshold: The number of consecutive bearish bars needed to trigger a Buy Signal. Default is 4.
Lookback: The number of bars ago used to calculate the Reference Close. Default is 4.
Start Time and End Time: The time window during which the strategy is allowed to execute trades.
█ PERFORMANCE OVERVIEW
This strategy is designed for trending markets with frequent reversals.
It performs best in volatile conditions where price movements are significant.
Backtesting results should be analysed to optimize the Buy Threshold and Lookback parameters for specific instruments.
Tdsequential

Favorite Signals w/EMA FilterThe script combines my favorite signals then filters them with three EMAs.
Via the Style tab, you can choose to either have the signals color the bar and/or plot a shape above/below.
All signals can be turned off via the Inputs tab, which will remove the bar color and/or shape (if not already off in the Style tab) as well as remove the pattern from the alerts function.
Remember when using TV alerts, if you change the script settngs, you must create a new alert if you wish to be alerted for the changes you've made.
LONG/SHORT SIGNALS INCLUDED FOR:
- TD8s
- TD9s
- Hammer
- Shooting Star
- Bullish Harami
- Bearish Harami
- RSI Divergences
EMA FILTER LOGIC LONGS:
- Price < Fast EMA & Med EMA > Slow EMA = Possible Long Entry
- Price > Fast EMA & Med EMA > Slow EMA = Possible Reversal, Tighten Stop or Reduce Position
EMA FILTER LOGIC SHORTS:
- Price > Fast EMA & Med EMA < Slow EMA = Possible Short Entry
- Price < Fast EMA & Med EMA < Slow EMA = Possible Reversal, Tighten Stop/Reduce Position
Big up to @spdoinkal, @HPotter, @LonesomeTheBlue, for writing the originals scripts for the signals above.
Enjoy!
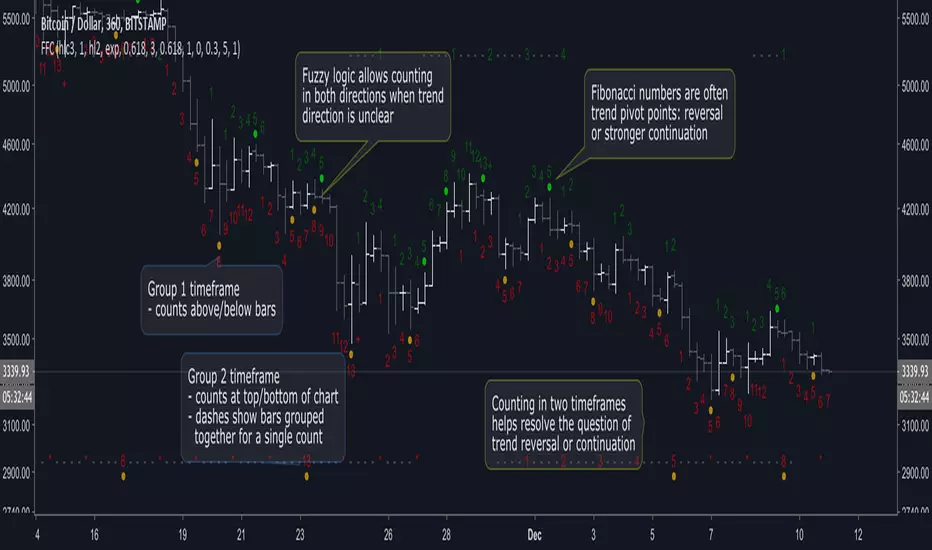
Fuzzy Fib CountsA new approach to trend/time analysis. This indicator counts up/down price moves using fuzzy logic in two time frames. Counts reaching Fibonacci numbers are often significant to trend momentum: either reversal or stronger continuation. See the script’s beginning comments for details.
I’m amazed with DeMark and all his indicators. But after coding a TD_Sequential script, I began to wonder if there wasn’t an easier way to identify high probability entry/exit points without all the intricate logic. It took awhile, but a different paradigm eventually came into focus: Fuzzy Fib Counts (FFC).
FFC is like “analog” compared to TD_Sequential’s “digital” approach. And FFC is much simpler: no buy/sell/perfected/deferred signals, just up/down counts. It’s uncanny how often a trend is refocused at Fibonacci numbers, but like TD_Sequential… it’s not perfect! As with all indicators, consult your intuition, before pulling the trigger.
The default values have been effective for me in Bitcoin (and I’m surprised how well it works in smaller time frames). However, for less volatile markets, you may need to reduce the fuzz level and/or adjust the filter (averaging) parameters.
FFC has been helpful to me. Hope it helps you too! If so, donations appreciated… Thanks!
BTC: 36FdUcETrwmGxt5qazq7Bo7kad9kuNawMF
LTC: MJYHzwJYjsnB35dzb5L9hCpqZf8RyqViEm
ETH: 0x3db7557bea61ca4c096c6ed7bdb2a0d69e455fe1
Looking for trailblazers to help explore new possibilities… Add constructive comments below!