MestreDoFOMO MACD VisualMasterDoFOMO MACD Visual
Description
MasterDoFOMO MACD Visual is a custom indicator that combines a unique approach to MACD with stochastic logic and simulated Renko-based direction signals. It is designed to help traders identify entry and exit opportunities based on market momentum and trend changes, with a clear and intuitive visualization.
How It Works
Stylized MACD with Stochastic: The indicator calculates the MACD using EMAs (exponential moving averages) normalized by stochastic logic. This is done by subtracting the lowest price (lowest low) from a defined period and dividing by the range between the highest and lowest price (highest high - lowest low). The result is a MACD that is more sensitive to market conditions, magnified by a factor of 10 for better visualization.
Signal Line: An EMA of the MACD is plotted as a signal line, allowing you to identify crossovers that indicate potential trend reversals or continuations.
Histogram: The difference between the MACD and the signal line is displayed as a histogram, with distinct colors (fuchsia for positive, purple for negative) to make momentum easier to read.
Simulated Renko Direction: Uses ATR (Average True Range) to calculate the size of Renko "bricks", generating signals of change in direction (bullish or bearish). These signals are displayed as arrows on the chart, helping to identify trend reversals.
Purpose
The indicator combines the sensitivity of the Stochastic MACD with the robustness of Renko signals to provide a versatile tool. It is ideal for traders looking to capture momentum-based market movements (using the MACD and histogram) while confirming trend changes with Renko signals. This combination reduces false signals and improves accuracy in volatile markets.
Settings
Stochastic Period (45): Sets the period for calculating the Stochastic range (highest high - lowest low).
Fast EMA Period (12): Period of the fast EMA used in the MACD.
Slow EMA Period (26): Period of the slow EMA used in the MACD.
Signal Line Period (9): Period of the EMA of the signal line.
Overbought/Oversold Levels (1.0/-1.0): Thresholds for identifying extreme conditions in the MACD.
ATR Period (14): Period for calculating the Renko brick size.
ATR Multiplier (1.0): Adjusts the Renko brick size.
Show Histogram: Enables/disables the histogram.
Show Renko Markers: Enables/disables the Renko direction arrows.
How to Use
MACD Crossovers: A MACD crossover above the signal line indicates potential bullishness, while below suggests bearishness.
Histogram: Fuchsia bars indicate bullish momentum; purple bars indicate bearish momentum.
Renko Arrows: Green arrows (upward triangle) signal a change to an uptrend; red arrows (downward triangle) signal a downtrend.
Overbought/Oversold Levels: Use the levels to identify potential reversals when the MACD reaches extreme values.
Notes
The chart should be set up with this indicator in isolation for better clarity.
Adjust the periods and ATR multiplier according to the asset and timeframe used.
Use the built-in alerts ("Renko Up Signal" and "Renko Down Signal") to set up notifications of direction changes.
This indicator is ideal for day traders and swing traders who want a visually clear and functional tool for trading based on momentum and trends.
Technicalindicators

Volume Block Order AnalyzerCore Concept
The Volume Block Order Analyzer is a sophisticated Pine Script strategy designed to detect and analyze institutional money flow through large block trades. It identifies unusually high volume candles and evaluates their directional bias to provide clear visual signals of potential market movements.
How It Works: The Mathematical Model
1. Volume Anomaly Detection
The strategy first identifies "block trades" using a statistical approach:
```
avgVolume = ta.sma(volume, lookbackPeriod)
isHighVolume = volume > avgVolume * volumeThreshold
```
This means a candle must have volume exceeding the recent average by a user-defined multiplier (default 2.0x) to be considered a significant block trade.
2. Directional Impact Calculation
For each block trade identified, its price action determines direction:
- Bullish candle (close > open): Positive impact
- Bearish candle (close < open): Negative impact
The magnitude of impact is proportional to the volume size:
```
volumeWeight = volume / avgVolume // How many times larger than average
blockImpact = (isBullish ? 1.0 : -1.0) * (volumeWeight / 10)
```
This creates a normalized impact score typically ranging from -1.0 to 1.0, scaled by dividing by 10 to prevent excessive values.
3. Cumulative Impact with Time Decay
The key innovation is the cumulative impact calculation with decay:
```
cumulativeImpact := cumulativeImpact * impactDecay + blockImpact
```
This mathematical model has important properties:
- Recent block trades have stronger influence than older ones
- Impact gradually "fades" at rate determined by decay factor (default 0.95)
- Sustained directional pressure accumulates over time
- Opposing pressure gradually counteracts previous momentum
Trading Logic
Signal Generation
The strategy generates trading signals based on momentum shifts in institutional order flow:
1. Long Entry Signal: When cumulative impact crosses from negative to positive
```
if ta.crossover(cumulativeImpact, 0)
strategy.entry("Long", strategy.long)
```
*Logic: Institutional buying pressure has overcome selling pressure, indicating potential upward movement*
2. Short Entry Signal: When cumulative impact crosses from positive to negative
```
if ta.crossunder(cumulativeImpact, 0)
strategy.entry("Short", strategy.short)
```
*Logic: Institutional selling pressure has overcome buying pressure, indicating potential downward movement*
3. Exit Logic: Positions are closed when the cumulative impact moves against the position
```
if cumulativeImpact < 0
strategy.close("Long")
```
*Logic: The original signal is no longer valid as institutional flow has reversed*
Visual Interpretation System
The strategy employs multiple visualization techniques:
1. Color Gradient Bar System:
- Deep green: Strong buying pressure (impact > 0.5)
- Light green: Moderate buying pressure (0.1 < impact ≤ 0.5)
- Yellow-green: Mild buying pressure (0 < impact ≤ 0.1)
- Yellow: Neutral (impact = 0)
- Yellow-orange: Mild selling pressure (-0.1 < impact ≤ 0)
- Orange: Moderate selling pressure (-0.5 < impact ≤ -0.1)
- Red: Strong selling pressure (impact ≤ -0.5)
2. Dynamic Impact Line:
- Plots the cumulative impact as a line
- Line color shifts with impact value
- Line movement shows momentum and trend strength
3. Block Trade Labels:
- Marks significant block trades directly on the chart
- Shows direction and volume amount
- Helps identify key moments of institutional activity
4. Information Dashboard:
- Current impact value and signal direction
- Average volume benchmark
- Count of significant block trades
- Min/Max impact range
Benefits and Use Cases
This strategy provides several advantages:
1. Institutional Flow Detection: Identifies where large players are positioning themselves
2. Early Trend Identification: Often detects institutional accumulation/distribution before major price movements
3. Market Context Enhancement: Provides deeper insight than simple price action alone
4. Objective Decision Framework: Quantifies what might otherwise be subjective observations
5. Adaptive to Market Conditions: Works across different timeframes and instruments by using relative volume rather than absolute thresholds
Customization Options
The strategy allows users to fine-tune its behavior:
- Volume Threshold: How unusual a volume spike must be to qualify
- Lookback Period: How far back to measure average volume
- Impact Decay Factor: How quickly older trades lose influence
- Visual Settings: Labels and line width customization
This sophisticated yet intuitive strategy provides traders with a window into institutional activity, helping identify potential trend changes before they become obvious in price action alone.

MultiTime Stochastics ProMultiTime Stochastics Pro
This indicator is an enhanced version of the stochastic indicator, featuring two separate stochastics. This functionality allows you to adjust the settings and time frame for each stochastic individually, enabling a more precise analysis of market fluctuations.
The Double Stochastic indicator enables you to simultaneously analyze the market in different time frames with two separate stochastics. One of the standout features of this indicator is that when the chart's time frame changes, each stochastic is displayed according to the time set for it and does not change in other time frames. This feature provides greater flexibility and accuracy in market analysis.
How the Indicator Works
This indicator calculates two separate stochastics:
The first stochastic (K1 and D1) with its own specific time frame and settings.
The second stochastic (K2 and D2) with a different time frame and settings.
These two stochastics are displayed simultaneously on one chart, and overbought and oversold lines are also included.
How to Use
Parameter Adjustment : Adjust the parameters K1 Length, D1 Smoothing, and K1 Time Frame as desired. Do the same for the second stochastic.
Signal Analysis : Analyze buy and sell signals based on the stochastic values and the overbought and oversold lines.
Advantages
Greater Precision : With two separate stochastics, you can follow market fluctuations with greater accuracy.
Flexibility : The ability to individually set the time frame and parameters for each stochastic makes this indicator highly flexible.
Stronger Signals : The simultaneous display of two stochastics allows you to receive stronger buy and sell signals.
Multi-time frame Analysis : The ability to analyze the market in different time frames simultaneously.
This indicator is suitable for traders seeking more precise and flexible market analysis tools. I hope these explanations help you publish your indicator in the best possible way!

Options Series - NonOverlay_Technical
⭐ 1. Purpose:
The script is designed to show technical indicators in a non-overlay form using candlestick representations. It combines multiple popular technical analysis tools to gauge the market's bullish or bearish conditions.
⭐ 2. Indicators:
The script uses several indicators across different timeframes: Exponential Moving Averages (EMA) for 5, 20, 50 periods. Simple Moving Average (SMA) for 200 periods. RSI (Relative Strength Index) for momentum. VWAP (Volume Weighted Average Price) for average price evaluation. PSAR (Parabolic SAR) for trend direction. Daily and multi-day (2-day and 3-day) data for broader market context.
⭐ 3. Candlestick Representation:
The script uses color-coded candlesticks to visually represent various indicators and their bullish/bearish states: Green candlesticks for bullish conditions. Red candlesticks for bearish conditions. Neutral/transparent for non-significant conditions.
⭐ 4. Important Conditions:
It calculates bullish and bearish conditions for each indicator: MA20: When the price is above or below the 20-period EMA. RSI: When RSI is above or below 50. VWAP: When the price is above or below the VWAP. PSAR: When the price is above or below the PSAR. 2-day and 3-day Moving Averages: Evaluating the broader trend.
⭐ 5. Bullish vs. Bearish Calculation:
The script sums up bullish and bearish signals to determine the overall market condition: Current_logical_bull: Counts the number of bullish indicators. Current_logical_bear: Counts the number of bearish indicators. The script compares these values to conclude whether the market is more bullish or bearish.
⭐ 6. Visual Plotting:
The script uses plotcandle to display the non-overlay signals at different levels for each condition, stacked vertically from MA20 to PSAR. Additionally, a master candle combines all indicators to show an overall market trend.
⭐ 7. Neon Effect on MA20:
It adds a neon-like effect to the MA20 line, making it visually prominent: A standard plot line with the base color. Two additional neon layers with increasing transparency to enhance the effect.
⭐ 8. Daily Timeframes and Lookahead:
The script fetches daily data using the lookahead feature to get a broader view of the market trend. It tracks the previous day’s and two days' data for comparison.
⭐ 9. Labels and Customization:
The script dynamically adds labels to the chart for the different plotted indicators at the last bar, making it easier to identify which indicator is being represented.
🚀 Conclusion:
The script combines multiple technical indicators, such as EMA, RSI, VWAP, PSAR, and multi-day moving averages, to visually assess bullish and bearish market conditions. It uses color-coded candlesticks to represent each indicator and sums up the signals to determine the overall trend.

Big Candle HighlighterBig Candle Highlighter
The Big Candle Highlighter indicator highlights significant candles based on their percentage difference between the open and close prices. This tool helps traders quickly identify candles with substantial price movements, which can be crucial for spotting key price action, potential reversals, or significant market events.
Key Features:
Percentage Threshold : Customize the minimum percentage difference from open to close required to mark a candle as "big."
Bullish and Bearish Markers : Bullish big candles are marked with a label below the bar in green, while bearish big candles are marked with a label above the bar in red.
Background Highlighting : Optionally highlight the background of big candles for better visual emphasis.
Inputs:
Percentage Threshold (% ): Set the percentage threshold to define what constitutes a "big" candle. For example, a threshold of 2.0 means that only candles with a 2% or more difference between open and close will be marked.
Color for Big Bullish Candle : Choose the color for labeling and highlighting bullish big candles.
Color for Big Bearish Candle : Choose the color for labeling and highlighting bearish big candles.
Usage :
This indicator is useful for traders looking to identify significant price movements and potential trading opportunities. By focusing on candles that show substantial changes from open to close, you can better understand market dynamics and make more informed trading decisions.
Add the Big Candle Marker to your charts to enhance your technical analysis and stay ahead of market trends.

Fisher Transform on RSIOverview
The Fisher Transform on RSI indicator combines the Relative Strength Index (RSI) with the Fisher Transform to offer a refined tool for identifying market turning points and trends. By applying the Fisher Transform to the RSI, this indicator converts RSI values into a Gaussian normal distribution, enhancing the precision of detecting overbought and oversold conditions. This method provides a clearer and more accurate identification of potential market reversals than the standard RSI.
Key/Unique Features
Fisher Transform Applied to RSI : Transforms RSI values into a Gaussian normal distribution, improving the detection of overbought and oversold conditions.
Smoothing : Applies additional smoothing to the Fisher Transform, reducing noise and providing clearer signals.
Signal Line : Includes a signal line to identify crossover points, indicating potential buy or sell signals.
Custom Alerts : Built-in alert conditions for bullish and bearish crossovers, keeping traders informed of significant market movements.
Visual Enhancements : Background color changes based on crossover conditions, offering immediate visual cues for potential trading opportunities.
How It Works
RSI Calculation : The indicator calculates the Relative Strength Index (RSI) based on the selected source and period length.
Normalization : The RSI values are normalized to fit within a range of -1 to 1, which is essential for the Fisher Transform.
Fisher Transform : The normalized RSI values undergo the Fisher Transform, converting them into a Gaussian normal distribution.
Smoothing : The transformed values are smoothed using a simple moving average to reduce noise and provide more reliable signals.
Signal Line : A signal line, which is a simple moving average of the smoothed Fisher Transform, is plotted to identify crossover points.
Alerts and Visuals : Custom alert conditions are set for bullish and bearish crossovers, and the background color changes to indicate these conditions.
Usage Instructions
Trend Identification : Use the Fisher Transform on RSI to identify overbought and oversold conditions with enhanced precision, aiding in spotting potential trend reversals.
Trade Signals : Monitor the crossovers between the smoothed Fisher Transform and the signal line. A bullish crossover suggests a potential buying opportunity, while a bearish crossover indicates a potential selling opportunity.
Alerts : Set custom alerts based on the built-in conditions to receive notifications when important crossover events occur, ensuring you never miss a trading opportunity.
Visual Cues : Utilize the background color changes to quickly identify bullish (green) and bearish (red) conditions, providing immediate visual feedback on market sentiment.
Complementary Analysis : Combine this indicator with other technical analysis tools and indicators to enhance your overall trading strategy and make more informed decisions.

EngulfScanEngulf Scan
Introduction:
The Engulf Scan indicator helps users identify bullish and bearish engulfing candlestick patterns on their charts. These patterns are often used as signals for trend reversals and are important indicators for traders. Engulf Scan signals are generated when an engulfing pattern is swallowed by another candlestick of the opposite color.The signal of a candle engulfment formation is generated when the 1st candle is engulfed by the 2nd candle and the 2nd candle is engulfed by the 3rd candle.
Features:
Bullish Engulfing Pattern: Indicates the start of an upward trend and typically signals that the market is likely to move higher.
Bearish Engulfing Pattern: Indicates the start of a downward trend and typically signals that the market is likely to move lower.
Color Coding: Users can customize the background colors for bullish and bearish engulfing patterns.
Usage Guide:
Adding the Indicator: Add the "Engulf Scan" indicator to your TradingView chart.
Color Settings: Choose your preferred colors for bullish and bearish engulfing patterns from the indicator settings.
Pattern Detection: View the engulfing patterns on the chart with the specified colors and symbols. These patterns help identify potential trend reversal points.
Parameters and Settings:
Bullish Engulfing Color: Background color for the bullish engulfing pattern.( Green)
Bearish Engulfing Color: Background color for the bearish engulfing pattern. (Red)
Examples:
Bullish Engulfing Example: On the chart below, you can see bullish engulfing patterns highlighted with a green background. (Green)
Bearish Engulfing Example: On the chart below, you can see bearish engulfing patterns highlighted with a red background. (Red)
Frequently Asked Questions (FAQ):
How are engulfing patterns detected?
Engulfing patterns are formed when a candlestick completely engulfs the previous candlestick. For a bullish engulfing pattern, a bullish candlestick follows a bearish one. For a bearish engulfing pattern, a bearish candlestick follows a bullish one.
Which timeframes work best with this indicator?
Engulfing patterns are generally more reliable on daily and higher timeframes, but you can test the indicator on different timeframes to see if it fits your trading strategy.
Can I detect a reversal or trend?
As can be seen in the image, it sometimes appears as a return signal and sometimes as a harbinger of an ongoing trend.But it may be a mistake to use the indicator only for these purposes. However, this indicator may not be sufficient when used alone. It can be combined with different indicators from the Tradingview library.
Updates and Changelog:
v1.0: Initial release. Added detection and color coding for bullish and bearish engulfing patterns.
-Please feel free to write your valuable comments and opinions. I attach importance to your valuable opinions so that I can improve myself.

HelperTALibrary "HelperTA"
This library contains useful technical indicators that I use regularly in my charts.
`stockRSI` is not mine, but included because used often and referenced by internal functions.
`DCO` is a normalisation of the donchian channels; the price relative to the donchian channels, on a range.
`MarketCycle` is a weighted aggregate of RSI, Stochastic RSI & DCO (demo on the chart)
stockRSI(src, K, D, rsiPeriod, stochPeriod)
stockRSI
Parameters:
src (float)
K (int)
D (int)
rsiPeriod (simple int)
stochPeriod (int)
Returns:
DCO(price, donchianPeriod, smaPeriod)
DCO
Parameters:
price (float)
donchianPeriod (int)
smaPeriod (int)
Returns:
MarketCycle(donchianPrice, rsiPrice, srsiPrice, donchianPeriod, donchianSmoothing, rsiPeriod, rsiSmoothing, srsiPeriod, srsiSmoothing, srsiK, srsiD, rsiWeight, srsiWeight, dcoWeight)
MarketCycle
Parameters:
donchianPrice (float)
rsiPrice (float)
srsiPrice (float)
donchianPeriod (simple int)
donchianSmoothing (simple int)
rsiPeriod (simple int)
rsiSmoothing (int)
srsiPeriod (simple int)
srsiSmoothing (simple int)
srsiK (simple int)
srsiD (simple int)
rsiWeight (simple float)
srsiWeight (simple float)
dcoWeight (simple float)
Returns:

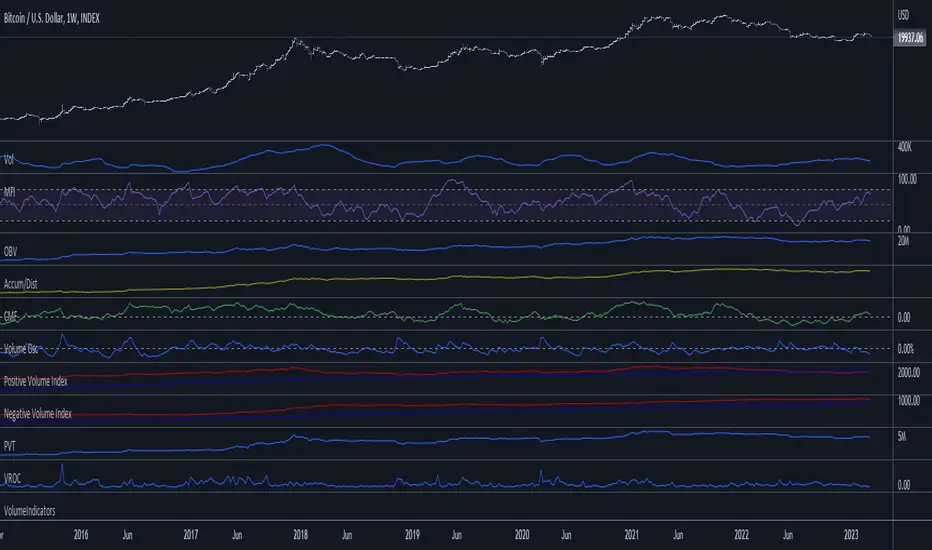
VolumeIndicatorsLibrary "VolumeIndicators"
This is a library of 'Volume Indicators'.
It aims to facilitate the grouping of this category of indicators, and also offer the customized supply of the source, not being restricted to just the closing price.
Indicators:
1. Volume Moving Average (VMA):
Moving average of volume. Identify trends in trading volume.
2. Money Flow Index (MFI): Measures volume pressure in a range of 0 to 100.
Calculates the ratio of volume when the price goes up and when the price goes down
3. On-Balance Volume (OBV):
Identify divergences between trading volume and an asset's price.
Sum of trading volume when the price rises and subtracts volume when the price falls.
4. Accumulation/Distribution (A/D):
Identifies buying and selling pressure by tracking the flow of money into and out of an asset based on volume patterns.
5. Chaikin Money Flow (CMF):
A variation of A/D that takes into account the daily price variation and weighs trading volume accordingly.
6. Volume Oscillator (VO):
Identify divergences between trading volume and an asset's price. Ratio of change of volume, from a fast period in relation to a long period.
7. Positive Volume Index (PVI):
Identify the upward strength of an asset. Volume when price rises divided by total volume.
8. Negative Volume Index (NVI):
Identify the downward strength of an asset. Volume when price falls divided by total volume.
9. Price-Volume Trend (PVT):
Identify the strength of an asset's price trend based on its trading volume. Cumulative change in price with volume factor
vma(length, maType, almaOffset, almaSigma, lsmaOffSet)
@description Volume Moving Average (VMA)
Parameters:
length : (int) Length for moving average
maType : (int) Type of moving average for smoothing
almaOffset : (float) Offset for Arnauld Legoux Moving Average
almaSigma : (float) Sigma for Arnauld Legoux Moving Average
lsmaOffSet : (float) Offset for Least Squares Moving Average
Returns: (float) Moving average of Volume
mfi(source, length)
@description MFI (Money Flow Index).
Uses both price and volume to measure buying and selling pressure in an asset.
Parameters:
source : (float) Source of series (close, high, low, etc.)
length
Returns: (float) Money Flow series
obv(source)
@description On Balance Volume (OBV)
Same as ta.obv(), but with customized type of source
Parameters:
source : (float) Series
Returns: (float) OBV
ad()
@description Accumulation/Distribution (A/D)
Returns: (float) Accumulation/Distribution (A/D) series
cmf(length)
@description CMF (Chaikin Money Flow).
Measures the flow of money into or out of an asset over time, using a combination of price and volume, and is used to identify the strength and direction of a trend.
Parameters:
length
Returns: (float) Chaikin Money Flow series
vo(shortLen, longLen, maType, almaOffset, almaSigma, lsmaOffSet)
@description Volume Oscillator (VO)
Parameters:
shortLen : (int) Fast period for volume
longLen : (int) Slow period for volume
maType : (int) Type of moving average for smoothing
almaOffset
almaSigma
lsmaOffSet
Returns: (float) Volume oscillator
pvi(source)
@description Positive Volume Index (PVI)
Same as ta.pvi(), but with customized type of source
Parameters:
source : (float) Series
Returns: (float) PVI
nvi(source)
@description Negative Volume Index (NVI)
Same as ta.nvi(), but with customized type of source
Parameters:
source : (float) Series
Returns: (float) PVI
pvt(source)
@description Price-Volume Trend (PVT)
Same as ta.pvt(), but with customized type of source
Parameters:
source : (float) Series
Returns: (float) PVI
fontilabLibrary "fontilab"
Provides function's indicators for pivot - trend - resistance.
pivots(src, lenght, isHigh) Detecting pivot points (and returning price + bar index.
Parameters:
src : The chart we analyse.
lenght : Used for the calcul.
isHigh : lookging for high if true, low otherwise.
Returns: The bar index and the price of the pivot.
calcDevThreshold(tresholdMultiplier, closePrice) Calculate deviation threshold for identifying major swings.
Parameters:
tresholdMultiplier : Usefull to equilibrate the calculate.
closePrice : Close price of the chart wanted.
Returns: The deviation threshold.
calcDev(basePrice, price) Custom function for calculating price deviation for validating large moves.
Parameters:
basePrice : The reference price.
price : The price tested.
Returns: The deviation.
pivotFoundWithLines(dev, isHigh, index, price, dev_threshold, isHighLast, pLast, iLast, lineLast) Detecting pivots that meet our deviation criteria.
Parameters:
dev : The deviation wanted.
isHigh : The type of pivot tested (high or low).
index : The Index of the pivot tested.
price : The chart price wanted.
dev_threshold : The deviation treshold.
isHighLast : The type of last pivot.
pLast : The pivot price last.
iLast : Index of the last pivot.
lineLast : The lst line.
Returns: The Line and bool is pivot High.
getDeviationPivots(thresholdMultiplier, depth, lineLast, isHighLast, iLast, pLast, deleteLines, closePrice, highPrice, lowPrice) Get pivot that meet our deviation criteria.
Parameters:
thresholdMultiplier : The treshold multiplier.
depth : The depth to calculate pivot.
lineLast : The last line.
isHighLast : The type of last pivot
iLast : Index of the last pivot.
pLast : The pivot price last.
deleteLines : If the line are draw or not.
closePrice : The chart close price.
highPrice : The chart high price.
lowPrice : The chart low price.
Returns: All pivot the informations.
getElIntArrayFromEnd() Get the last element of an int array.
getElFloatArrayFromEnd() Get the last element of an float array.
getElBoolArrayFromEnd() Get the last element of a bool array.
isTrendContinuation(isTrendUp, arrayBounds, lastPrice, precision) Check if last price is between bounds array.
Parameters:
isTrendUp : Is actual trend up.
arrayBounds : The trend array.
lastPrice : The pivot Price that just be found.
precision : The percent we add to actual bounds to validate a move.
Returns: na if price is between bounds, true if continuation, false if not.
getTrendPivots(trendBarIndexes, trendPrices, trendPricesIsHigh, interBarIndexes, interPrices, interPricesIsHigh, isTrendHesitate, isTrendUp, trendPrecision, pLast, iLast, isHighLast) Function to update array and trend related to pivot trend interpretation.
Parameters:
trendBarIndexes : The array trend bar index.
trendPrices : The array trend price.
trendPricesIsHigh : The array trend is high.
interBarIndexes : The array inter bar index.
interPrices : The array inter price.
interPricesIsHigh : The array inter ishigh.
isTrendHesitate : The actual status of is trend hesitate.
isTrendUp : The actual status of is trend up.
trendPrecision : The var precision to add in "iscontinuation" function.
pLast : The last pivot price.
iLast : The last pivot bar index.
isHighLast : The last pivot "isHigh".
Returns: trend & inter arrays, is trend hesitate, is trend up.
drawBoundLines(startIndex, startPrice, endIndex, endPrice, breakingPivotIndex, breakingPivotPrice, isTrendUp) Draw bounds and breaking line of the trend.
Parameters:
startIndex : Index of the first bound line.
startPrice : Price of first bound line.
endIndex : Index of second bound line.
endPrice : price of second bound line.
breakingPivotIndex : The breaking line index.
breakingPivotPrice : The breaking line price.
isTrendUp : The actual status of the trend.
Returns: The lines bounds and breaking line.

Indicator PanelHello All,
This script shows Indicator panel in a Table. Table.new() is a new feature and released today! Thanks a lot to Pine Team to add this new great feature! This new feature is a game changer!
The script shows indicator values for each symbol and changes background color of each cell by using current and last values of the indicators for each symbol. if current value is greater than last value then backgroung color is green, if lower than last value then red, if they are equals then gray.
You can choose the indicators to display. Number of columns in the table is dynamic and is changed by number of the indicators.
You can choose 5 different Symbols, 6 Indicators and 2 Simple or Exponential Moving averages, you can set type of moving averages and the lengths. You can also set the lengths for each Indicators.
Indicators:
- RSI
- MACD ( MACD and Signal and Histogram )
- DMI ( +DI and -DI + and ADX )
- CCI
- MFI
- Momentum
- MA with Length 50 (length can be set)
- MA with Length 200 (length can be set)
In this example RSI, MACD and MA 200 were chosen, you can see how table size changes dynamically:
Enjoy!

RSI Tops and BottomsHello Traders
This script finds Tops when RSI is in overbought area or Bottoms when RSI is in oversold area and checks the divergence between them. it checks divergence at tops/bottoms after RSI exited from OB/OS areas.
You can change overbought / oversold levels.
You can limit the time that RSI is in OB/OS area with the option "Max Number of Bars in OB/OS"
you can set the minimum/maximum distances between Tops/Bottoms with the options "Min Number of Bars between Tops/Bottoms" and "Max Number of Bars between Topss/Bottoms"
and you can set the color and line widths as you wish.
These tops or bottom must be sequential, means there mustn't be another top while checking tops or bottom while checking bottoms between them.
in next example you can see valid and invalid bottoms:
After you got signal then you better use Stop Order, a few pips higher than the high of colored candle for long positions, ( vise versa in short positions ). so you may escape from traps. ("Stop order" is filled when the price reached a pre-specified price. for example the price is now 10.0 and you set Buy Stop Order at 11.0 then if price reaches 11.0 then your buy order get filled. you can put stoploss a few pips lower than the low of colored candle or you can use ATR to decice stoploss level. how you wish)
For example in following screenshot you can see that buy stop order was not filled and you didn't take long position.
Enjoy!

Indicator Panel MTF (MACD, RSI, Momentum, Stoch, CCI)This script shows the values of MACD, RSI, Momentum, Stoch, CCI for current and higher time frames in a panel. if higher time frame is equal or smaller than current time frame and it doesn't show the values for HTF.
And also it shows if their values are increasing, decreasing or equal to last value with "▲", "▼", "="
The signal length for all indicators is 9 and used EMA.
histogram value is indicator value - it's signal value. with this value you can see that indicator and its signal getting closer or not. you may think it's as momentum.
Some functions and idea is used from following scripts:
Thanks to Lucf for the following script:
Thanks to Ricardo Santos for the following script:

Average Indicators Positionsby this script you can see the average level of macd, macd-asprey, rsi, stochastic, cci, momentum, obv, DI, volume weighted macd, cmf indicators within a period. It also calculates and creates the same graph for higher time frame, so you can see average levels for current and higher time frame. you can also check it for divergence/convergence. You can use it as you wish and add/remove indicators.
