$ADD LevelsThis Pine Script is designed to track and visualize the NYSE Advance-Decline Line (ADD). The Advance-Decline Line is a popular market breadth indicator, showing the difference between advancing and declining stocks on the NYSE. It’s often used to gauge overall market sentiment and strength.
1. //@version=5
This line tells TradingView to use Pine Script v5, the latest and most powerful version of Pine.
2. indicator(" USI:ADD Levels", overlay=false)
• This creates a new indicator called ” USI:ADD Levels”.
• overlay=false means it will appear in a separate pane, not on the main price chart.
3. add = request.security(...)
This fetches real-time data from the symbol USI:ADD (Advance-Decline Line) using a 1-minute timeframe. You can change the timeframe if needed.
add_symbol = input.symbol(" USI:ADD ", "Market Breadth Symbol")
add = request.security(add_symbol, "1", close)
4. Key Thresholds
These define the market sentiment zones:
Zone. Value. Meaning
Overbought +1500 Extremely bullish
Bullish +1000 Generally bullish trend
Neutral ±500 Choppy, unclear market
Bearish -1000 Generally bearish trend
Oversold -1500 Extremely bearish
5. Plot the ADD Line hline(...)
Draws static lines at +1500, +1000, +500, -500, -1000, -1500 for reference so you can visually assess where ADD stands.
6. Horizontal Threshold Lines bgcolor(...)
• Green background if ADD > +1500 → extremely bullish.
• Red background if ADD < -1500 → extremely bearish.
7. Background Highlights alertcondition(...)
• Green background if ADD > +1500 → extremely bullish.
• Red background if ADD < -1500 → extremely bearish.
8. Alert Conditions. alertcondition(...)
Lets you create automatic alerts for:
• USI:ADD being very high or low.
• Crosses above +1000 (bullish trigger).
• Crosses below -1000 (bearish trigger).
You can use these to trigger trades or monitor sentiment shifts.
Summary: When to Use It
• Use this script in a market breadth dashboard.
• Combine it with price action and volume analysis.
• Monitor for ADD crosses to signal potential market reversals or momentum.
TICK

TICK Extreme Levels & AlertsAutomatically draws horizontal lines at +1000 and -1000 TICK levels
Sends alerts when TICK crosses those levels (for potential scalping/reversal setups)
Strategy: How to Use TICK in Real-Time Trading
1. Confirm Market Breadth
Use TICK to confirm broad participation in the move:
• Long S&P futures or SPY? Only buy breakouts if TICK is above +600 to +1000
• Shorting? Confirm with TICK below –600 to –1000
2. Fade Extremes for Scalps
Look for reversals at extreme levels:
• Fade +1200+: market likely overbought short term → scalp short
• Fade –1200–: market likely oversold → scalp long
Use in combo with other signals (like price exhaustion, candlestick reversal, or VWAP touches)
3. Avoid Trading in the Choppy Zone
If TICK remains between –400 and +400, institutions are not committed. This is where fakeouts are common.
4. Time Entries with TICK Swings
For example:
• TICK moves from –800 to +600 = momentum shift → look for long entries
• TICK stalling around +1000 = momentum climax → partial profit or fade play

Cumulative Histogram TickThis script is designed to create a cumulative histogram based on tick data from a specific financial instrument. The histogram resets at the start of each trading session, which is defined by a fixed time.
Key Components:
Tick Data Retrieval:
The script fetches the closing tick values from the specified instrument using request.security("TICK.NY", timeframe.period, close). This line ensures that the script works with the tick data for each bar on the chart.
Session Start and End Detection:
Start Hour: The script checks if the current bar's time is 9:30 AM (hour == 9 and minute == 30). This is used to reset the cumulative value at the beginning of each trading session.
End Hour: It also checks if the current bar's time is 4:00 PM (hour == 16). However, this condition is used to prevent further accumulation after the session ends.
Cumulative Value Management:
Reset: When the start hour condition is met (startHour), the cumulative value (cumulative) is reset to zero. This ensures that each trading session starts with a clean slate.
Accumulation: For all bars that are not at the end hour (not endHour), the tick value is added to the cumulative total. This process continues until the end of the trading session.
Histogram Visualization:
The cumulative value is plotted as a histogram using plot.style_histogram. The color of the histogram changes based on whether the cumulative value is positive (green) or negative (red).
Usage
This script is useful for analyzing intraday market activity by visualizing the accumulation of tick data over a trading session. It helps traders identify trends or patterns within each session, which can be valuable for making informed trading decisions.

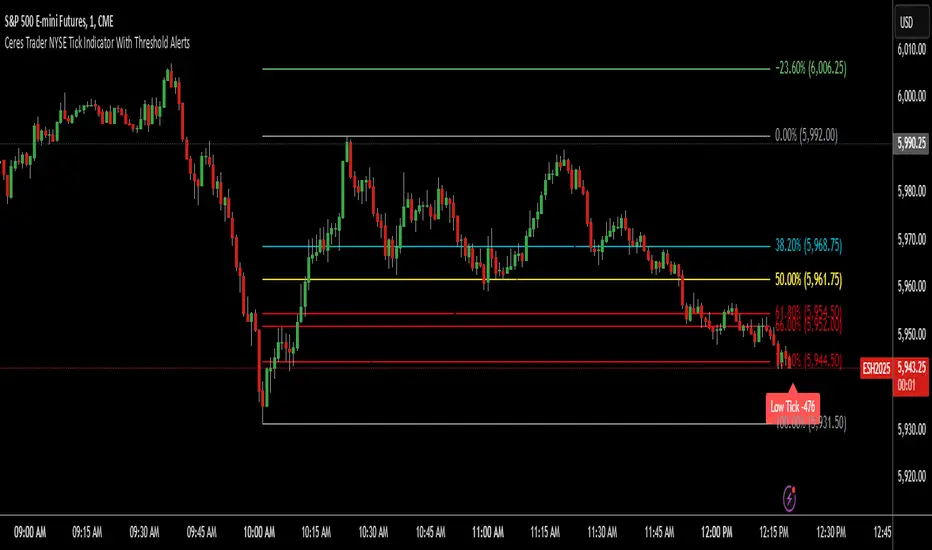
Ceres Trader NYSE Tick Indicator With Threshold AlertsThe Ceres Trader NYSE Tick Indicator provides real-time alerts for significant shifts in the NYSE Tick, empowering traders to identify potential overbought and oversold market conditions. It displays labels directly on the chart when the Tick reaches predefined thresholds, offering a clear and immediate visual representation of market sentiment.
Key Features:
Threshold-Based Alerts:
Highlights "High Tick" and "Low Tick" conditions when the Tick exceeds user-defined thresholds (default: 400 and -400).
Identifies "Extreme High Tick" and "Extreme Low Tick" conditions for more significant shifts (adjusted default: 800 and -800).
Visual Labels:
Displays colored labels directly on the price chart, indicating the type of Tick event and its value.
Green labels signal potential overbought conditions, while red labels indicate potential oversold conditions.
Low tick labels are placed below the price bar, and high tick labels are placed above the price bar for improved visibility.
Real-Time Data:
Utilizes the NYSE Tick symbol ("TICK") to provide up-to-the-minute market data.
User-Friendly Design:
Simple and intuitive design, suitable for traders of all experience levels.
How to Use:
Add the "Ceres Trader NYSE Tick Indicator with Threshold Alerts" to your TradingView chart.
Observe the colored labels that appear when the Tick reaches the specified thresholds.
Use these alerts to identify potential trading opportunities based on overbought or oversold market conditions.
Consider adjusting the threshold values within the indicator settings to align with your specific trading strategy.
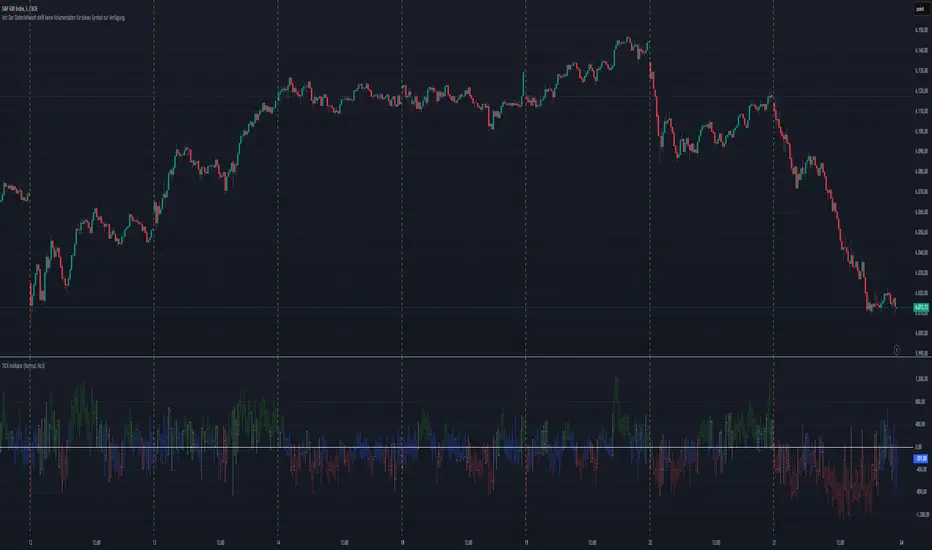
TICK Indikator
English:
The TICK Indicator measures in real time the number of up ticking stocks minus the number of down ticking stocks on the New York Stock Exchange (NYSE). It can display either the current TICK value ("Normal" mode) or the cumulative TICK values over the trading day ("Cumulative" mode). Positive values indicate market strength, while negative values signal weakness. Colored bars visualize momentum: green shades for rising, red for falling values. The zero line acts as a reference between buying and selling pressure.
Interpretation:
> +1000 and/or continuos lows above 0 → strong buying pressure
< -1000 and/or continuos highs below 0 → strong selling pressure
Around 0 → balanced market
Deutsch:
Der TICK Indikator misst in Echtzeit die Anzahl der Aktien, die an der New York Stock Exchange (NYSE) steigen, minus der Anzahl der fallenden Aktien. Der Indikator kann im "Normal"-Modus den aktuellen TICK-Wert anzeigen oder im "Cumulative"-Modus die kumulierten TICK-Werte über den Tag hinweg summieren. Positive Werte deuten auf eine allgemeine Markstärke hin, während negative Werte Schwäche signalisieren. Farbige Balken visualisieren die Dynamik: grüne Töne bei steigenden, rote bei fallenden Werten. Die Nullinie dient als Referenzpunkt zwischen Kauf- und Verkaufsdruck.
Interpretation:
> +1000 und/oder mehrere aufeinander folgende Tiefs über 0 → starker Kaufdruck
< -1000 und/oder mehrere aufeinander folgende Hochs unter 0 → starker Verkaufsdruck
Nahe 0 → ausgeglichener Markt
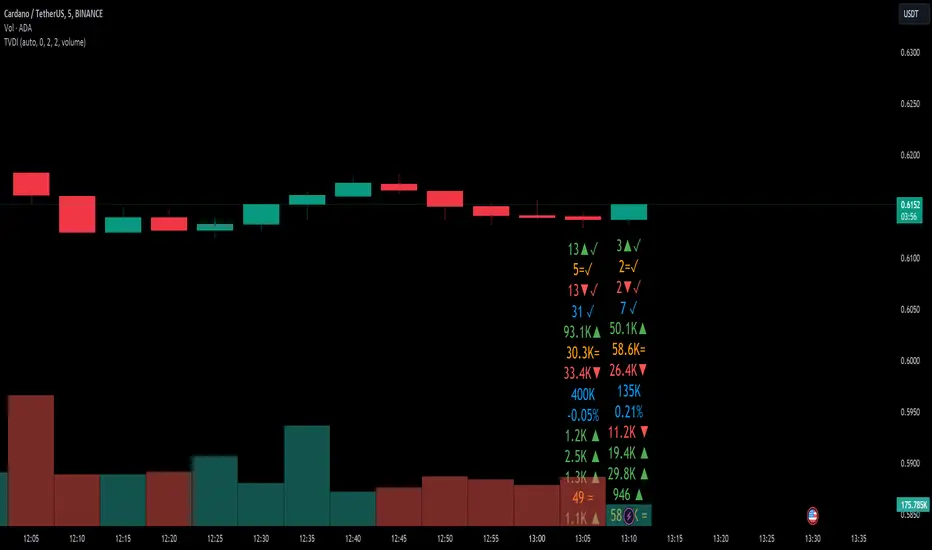
Tick CVD [Kioseff Trading]Hello!
This script "Tick CVD" employs live tick data to calculate CVD and volume delta! No tick chart required.
Features
Live price ticks are recorded
CVD calculated using live ticks
Delta calculated using live ticks
Tick-based HMA, WMA, EMA, or SMA for CVD and price
Key tick levels (S/R CVD & price) are recorded and displayed
Price/CVD displayable as candles or lines
Polylines are used - data visuals are not limited to 500 points.
Efficiency mode - remove all the bells and whistles to capitalize on efficiently calculated/displayed tick CVD and price
How it works
While historical tick-data isn't available to non-professional subscribers, live tick data is programmatically accessible. Consequently, this indicator records live tick data to calculate CVD, delta, and other metrics for the user!
Generally, Pine Scripts use the following rules to calculate volume/price-related metrics:
Bullish Volume: When the close price is greater than the open price.
Bearish Volume: When the close price is less than the open price.
This script, however, improves on that logic by utilizing live ticks. Instead of relying on time-series charts, it records up ticks as buying volume and down ticks as selling volume. This allows the script to create a more accurate CVD, delta, or price tick chart by tracking real-time buying and selling activity.
Price can tick fast; therefore, tick aggregation can occur. While tick aggregation isn't necessarily "incorrect", if you prefer speed and efficiency it's advised to enable "efficiency mode" in a fast market.
The image above highlights the tick CVD and price tick graph!
Green price tick graph = price is greater than its origin point (first script load)
Red price tick graph = price is less than its origin point
Blue tick CVD graph = CVD, over the calculation period, is greater than 0.
Red tick CVD graph = CVD is less than 0 over the calculation period.
The image above explains the right-oriented scales. The upper scale is for the price graph and the lower scale for the CVD graph.
The image above explains the circles superimposed on the scale lines for the price graph and the CVD graph.
The image above explains the "wavy" lines shown by the indicator. The wavy lines correspond to tick delta - whether the recorded tick was an uptick or down tick and whether buy volume or sell volume transpired.
The image above explains the blue/red boxes displayed by the indicator. The boxes offer an alternative visualization of tick delta, including the magnitude of buying/selling volume for the recorded tick.
Blue boxes = buying volume
Red boxes = selling volume
Bright blue = high buying volume (relative)
Bright red = high selling volume (relative)
Dim blue = low buying volume (relative)
Dim red = low selling volume (relative)
The numbers displayed in the box show the numbered tick and the volume delta recorded for the tick.
The image above further explains visuals for the CVD graph.
Dotted red lines indicate key CVD peaks, while dotted blue lines indicate key CVD bottoms.
The white dotted line reflects the CVD average of your choice: HMA, WMA, EMA, SMA.
The image above offers a similar explanation of visuals for the price graph.
The image above offers an alternative view for the indicator!
The image above shows the indicator when efficiency mode is enabled. When trading a fast market, enabling efficiency mode is advised - the script will perform quicker.
Of course, thank you to @RicardoSantos for his awesome library I use in almost every script :D
Thank you for checking this out!

NYSE TickThe NYSE Tick indicator is a market breadth indicator used to determine short-term bullish or bearish market sentiment. The NYSE Tick index compares the number of stocks on the New York Stock Exchange that are ticking up to the number of stocks ticking down at a specific moment in time. When the NYSE Tick is hovering around the zero line, roughly the same number of stocks are ticking up as are ticking down. When the overall market is rising it will usually present on the NYSE Tick as a rise in value that will generally stay mostly above the zero line for a period of time. The opposite is true when the general market is falling and can be seen as the NYSE Tick staying mostly below the zero line. This information can be very helpful for a short-term day trader who trades a market that also follows many of these same stocks, like the E-Mini S&P 500 Futures (ES), for example. While the index can theoretically rise or fall to over ±2,000 if all stocks on the NYSE are ticking up or down at the same time, it’s generally considered an extreme movement if the NYSE Tick is ±1,000. For this reason, the indicator has default reference lines at ±1,000 and halfway marks at ±500. In order to partially smooth out the movement and make movement trends more easily read, the indicator plots the values using Heikin Ashi candles instead of the standard bars or candlesticks. The price-line value displayed is an accurate live value, however, rather than the OHLC average value of a standard Heikin Ashi candle. Since the standard hours for the NYSE are Monday – Friday, 09:30 – 16:00 EST, the indicator only plots bars during this time.

Custom Time Frame (CTF)This indicator allows users to create their own arbitrary time frames for chart analysis. It features a moving average, providing an additional layer of analysis, and offers flexibility through various open settings.
In terms of user settings and usage, the indicator provides several options. Users can choose their interval style, opting for either tick-based or time-based intervals. This flexibility allows for a more granular approach to data analysis, catering to different trading strategies and preferences. The number of ticks or the amount of time for each candle can be adjusted, enabling traders to set the granularity of the data to their liking. Color settings are also customizable, with options for setting colors for bullish and bearish indicators, adding a visual dimension to the analysis.
The average line parameters are an important aspect of this indicator. Users can adjust the length, ripple, type, color, and line width of the average line. The ripple setting, in particular, impacts the smoothness of the filter. With type II setting, the smoothing is increased, making it suitable for traders who prefer a more smoothed out moving average. Conversely, the type I setting decreases the smoothing, which might be preferred by those who want a more responsive indicator.
The use of the Chebyshev filter is a significant feature of this indicator. This filter is chosen for its high-performance smoothing capabilities with minimal data requirements. This ensures that the moving average appears quickly and accurately, which is crucial in real-time chart analysis. An important point to note is that when the moving average is enabled, it decreases the maximum number of candles that can be displayed on the chart. However, this is offset by the enhanced analytical precision provided by the moving average.
In summary, this indicator is especially beneficial for traders without access to premium accounts. It offers the capability to create low or custom time frame charts. The flexibility in settings, coupled with the inclusion of a Chebyshev filter for the moving average, makes it a versatile and valuable tool for detailed market analysis. It caters to a wide range of trading styles and strategies, making it a useful addition to any trader's toolkit.

Tick Volume Direction IndicatorTick Volume Direction Indicator
This indicator captures:
• tick volume
• tick direction
The settings are as follows:
• volume or base currency value selection.
• label distance (away from the low of the candle).
• Tick volume - on/off switch for tick volume.
• label size.
• Up tick move color.
• tick move absorbed - when the tick doesn't change position.
• Down tick move.
On the first initial load, it will have the existing volume data as "?" as tradingview doesn't have a history of each tick.
Be aware, any settings change you make will refresh the tick data from start.
This indicator is one of the best real-time ways of seeing buying and selling pressure.
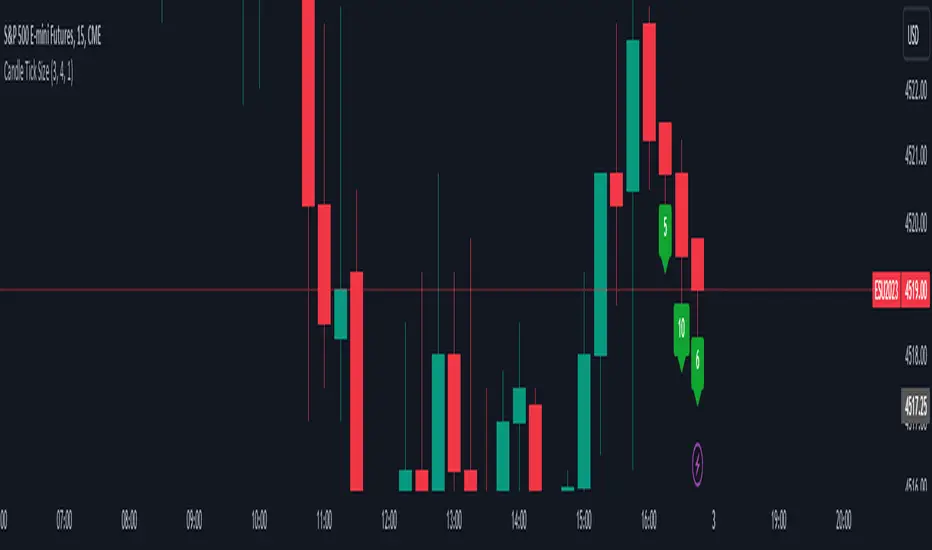
Candle Tick SizeHello everyone!
I dont think it exists, I couldnt find it any way I searched, maybe it is part of a bigger indicator. This is a really basic code, all it does, it shows the tick/pip size of the candles forming. You can adjust on how many candles should it show. Also because the code counts the point size of the candles from high to low, you can adjust that how many ticks are in one point, like for ES and NQ 4 ticks to a point, which is the basic setting. It helps me with entrys when I calculate the contract size so my risk/reward stays pretty much the same depending on the candle size for my entrys.
TICK Strength Background ShadeThis indicator shades the background of each candle based on the strength off the current TICK.US chart. User can define the strength levels, which are by default set to 1-299 (lightest), 300-599, and 600+ (darkest). Best used on lower timeframe charts to help identify whether or not to remain in a trend, or if a trend is possibly reversing when you start to see the opposite color begin to appear following a trend.

Cumulative TICK [Pt]Cumulative TICK Indicator, shown as the bottom indicator, is a robust tool designed to provide traders with insights into market trends using TICK data. This indicator visualizes the cumulative TICK trend in the form of colored columns on a separate chart below the main price chart.
Here's an overview of the key features of the Cumulative TICK Indicator:
1. Selectable TICK Source 🔄: The indicator allows users to choose from four different TICK data sources, namely USI:TICK , USI:TICKQ , USI:TICKI , and $USI:TICKA.
2. TICK Data Type Selection 🎚️: Users can select the type of TICK data to be used. The options include: Close, Open, hl2, ohlc4, hlc3.
3. Optional Simple Moving Average (SMA) 📊: The indicator offers an option to apply an SMA to the Cumulative TICK values, with a customizable length.
4. After-hour Background Color 🌙: The background color changes during after-hours to provide a clear distinction between regular and after-hour trading sessions.
🛠️ How it Works:
The Cumulative TICK Indicator uses TICK data accumulated during the regular market hours (9:30-16:00) as per the New York time zone. At the start of a new session or at the end of the regular session, this cumulative TICK value is reset.
The calculated Cumulative TICK is plotted in a column-style graph. If the SMA is applied, the SMA values are used for the column plots instead. The columns are colored green when the Cumulative TICK is positive and red when it is negative. The shades of green and red vary based on whether the Cumulative TICK is increasing or decreasing compared to the previous value.
This is a simple yet powerful tool to track market sentiment throughout the day using TICK data. Please note that this indicator is intended to be used as part of a comprehensive trading strategy. Always ensure you are managing risk appropriately and consulting various data sources to make informed trading decisions.
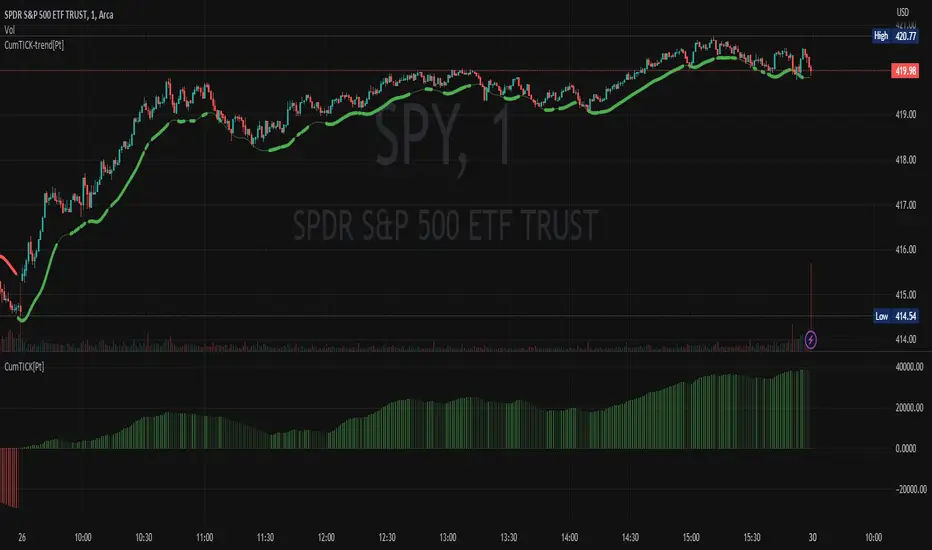
Cumulative TICK Trend[Pt]Cumulative TICK Trend indicator is a comprehensive trading tool that uses TICK data to define the market's cumulative trend. Trend is shown on ATR EMA bands, which is overlaid on the price chart. Cumulative TICK shown on the bottom pane is for reference only.
Main features of the Cumulative TICK Trend Indicator include:
Selectable TICK Source: You have the flexibility to choose your preferred TICK source from the following options, depending on the market you trade: USI:TICK, USI:TICKQ, USI:TICKI, and USI:TICKA.
TICK Data Type: Select the type of TICK data to use, options include: Close, Open, hl2, ohlc4, hlc3.
Simple Moving Average (SMA): You can choose to apply an SMA on the calculated Cumulative TICK values with a customizable length.
Average True Range (ATR) Bands: It provides the option to display ATR bands with adjustable settings. This includes the ATR period, EMA period, source for the ATR calculation, and the ATR multiplier for the upper band.
Trend Color Customization: You can customize the color of the bull and bear trends according to your preference.
Smooth Line Option: This setting allows you to smooth the ATR Bands with a customizable length.
How it Works:
This indicator accumulates TICK data during market hours (9:30-16:00) as per the New York time zone and resets at the start of a new session or the end of the regular session. This cumulative TICK value is then used to determine the trend.
The trend is defined as bullish if the SMA of cumulative TICK is equal to or greater than zero and bearish if it's less than zero. Additionally, this indicator plots the ATR bands, which can be used as volatility measures. The Upper ATR Band and Lower ATR Band can be made smoother using the SMA, according to the trader's preference.
The plot includes two parts for each trend: a stronger color (Red for bear, Green for bull) when the trend is ongoing, and a lighter color when the trend seems to be changing.
Remember, this tool is intended to be used as part of a comprehensive trading strategy. Always ensure you are managing risk appropriately and consulting various data sources to make informed trading decisions.

Volume Tick ExperimentThis ticks-based indicator provides real-time volume information for a trading asset. Volume is analyzed and updated continuously, not just at candle close. It is based on DGT's Bull vs Bear Power indicator but adds a gas signal that activates when buying or selling volume percentage reaches a predetermined threshold.
This indicator can also help traders determine the direction and aggressiveness of pushes in buying or selling volume. By monitoring the volume percentages and gas signals, traders can get an idea of whether the market is pushing in a particular direction and how strong the push is. This information can be helpful in making trading decisions and identifying potential entry or exit points.
The indicator uses open, high, low, and close prices of the asset to calculate volume information. It determines the average volume over a selected period and calculates volume for both buying and selling. This information is used to calculate the percentage of buying and selling volume. A gas signal is triggered when either the buying or selling percentage reaches a predetermined threshold.
Enjoy!

Tick Profile HeatmapThis is a market internal TICK heatmap with the intent of displaying areas of price associated to stronger reactions with NYSE TICK (by default).
This code is based off of a variation of a Volume Profile coded originally by colejustice who originally used code from LuxAlgo . The full-width volume bars that colejustice setup were replaced with full-width bars representative of TICK breaking +/- $500, the current cumulative value representing the "heat" is comprised of hlc3 by default but that can be changed. In a future update I may add additional logic here to capture highs and lows in the heatmap specifically, and perhaps additional colors.
As with other traditional profiling studies, this indicators purpose is to visualize correspondence to specific price levels, allowing rapid assessment where the most TICK activity is occurring, and where it hasn't been. This information may provide areas of support and resistance and regions where price may move quickly repeatedly.
All of the same input guidance that colejustice provided is the same for those pre-existing inputs:
Inputs are set up such that you can customize the lookback period, number of rows, and width of rows for most major timeframes individually. Timeframes between those available will use the next lower timeframe settings (e.g., 2m chart will use the 1m settings.)
Zero usage of volume is present in this indicator, only TICK data so please don't confuse it with volume studies.

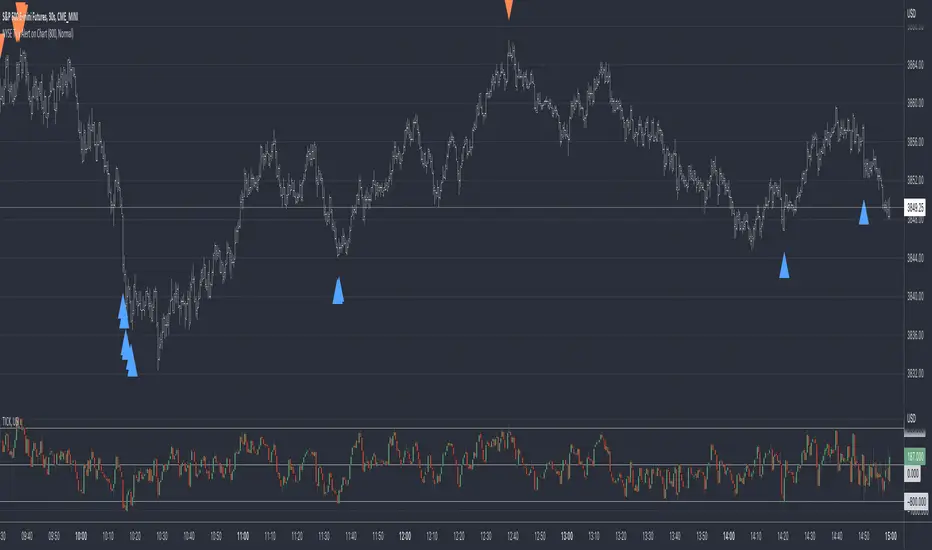
LNL Smart TICKLNL Smart TICK
This study is mostly beneficial for intraday traders. It is basically a user-friendly "colorful" representation of the $TICK chart with highlighted $TICK extremes. This indicator also includes: a simple trend gauge that can visualize the bias for the day, cumulative tick cloud which is showing the cumulative strength of either longs & shorts on the day.
$TICK Trend Gauge
Although it is just a exponential moving average. This average (default set on 20) works quite well as an overall gauge for the day. Whenever the gauge is green (above zero), any negative $TICK values below -500 can offer great pullback opportunities. Same applies for the red gauge. 20 EMA is below zero ? Great time to fade any +500 or +1000 tick readings. Obviously the gauge can be ajdusted to any number based on personal style.
$TICK Extremes (little triangles)
These little triangles are triggered anytime $TICK jumps above or below the pre-set values of +1000 or -1000. By just simply observing the $TICK triangles during the day can tell you how much volaility or pressure there is. Sometimes there will be 20 green triangles and only 2 red ones. That obviously mean there is a strong bearish pressure. But there will be days when you are not going to see any triangles at all which can mean there is either a low volatility or the price is stuck in the indecisive market.
Cumulative $TICK Cloud
Cumulative $TICK by itself is a great study for day traders. It is basically running "counting" $TICK that is adding the previous $TICK values from previous bars. Cumulative $TICK can create a direct picture of the current market sentiment. It is not just a simple green / red line but a cloud that can really show you the depth on the $TICK. Some days, the cloud will be quite wide which is a good sign for the strength to one side, but sometimes the cloud will be so narrow it will practically disappear. This would be telling you the exact opposite - not much conviction to any side. Of course the depth as well as the color of the cloud can change during the day.
$TICK & Cumulative $TICK Tables
By just looking at these tables. You can immidiately tell the state of the current $TICK. They both can be red or green. It all depends whether the values are positive or negative. The tables are just a little visual addition to the whole $TICK study.
Hope it helps.

Big 8 Intraday TICKAt the start of each trading day (0930 EST), this indicator calculates the intraday price difference between open and close for the eight largest market cap stocks (AAPL, AMZN, GOOGLE, META, MSFT, NFLX, NVDA, and TSLA), assigns a +/-1 for each, and then plots the cumulative change. An EMA has been added for smoothing purposes that is set to 5 but can be changed. Please note indicator is best used on lower timeframes (15 min or less) and has no applicability to time frames above 1 hour.
The thought behind this indicator is those eight major stocks drive a majority of intraday price change in indices like SPY and QQQ that are heavily weighted towards these stocks, therefore they should be a leading indicator in price change. You can often catch a move in SPY or QQQ one to two bars (on 1 min chart) ahead of the actual move because you see this indicator moving strong to one direction.
It's not perfect as there are divergences you will see when you compare historical charts, but oftentimes those divergences ultimately lead to significant price swings in the same direction as this indicator, so recommend being on watch to pull the trigger when you see those and price confirms.
You can use this indicator in a few ways:
1. Confirmation that your current trade is in the same direction as this indicator
2. Use the zero cross as a trigger for put or call entry
3. Focusing only on calls/longs if the value is above 0, or only puts/shorts if the value is below zero. Just be sure to keep an eye on reversals.
If you have recommendations on how to improve, let me know and I'll do my best to make changes.

TICK - Custom Tickers [Pt]Traditionally, the TICK index is a technical analysis indicator that shows the difference in the number of stocks that are trading on an uptick vs a downtick in a particular period of time. This indicator allows user to choose up to 40 tickers to calculate TICK.
By default, it uses the SPY Top 40 stocks, but can be changed to any tickers.
There are options to show:
- Top 7 , ie. can be used for just showing TICK for FAANGMT => $FB + $AMZN + $AAPL + $NFLX + $GOOG + $MSFT + $TSLA
- Top 10
- Top 20
- Top 30
- Top 40
Data can be displayed in candle bars, line, or both.
Enjoy~

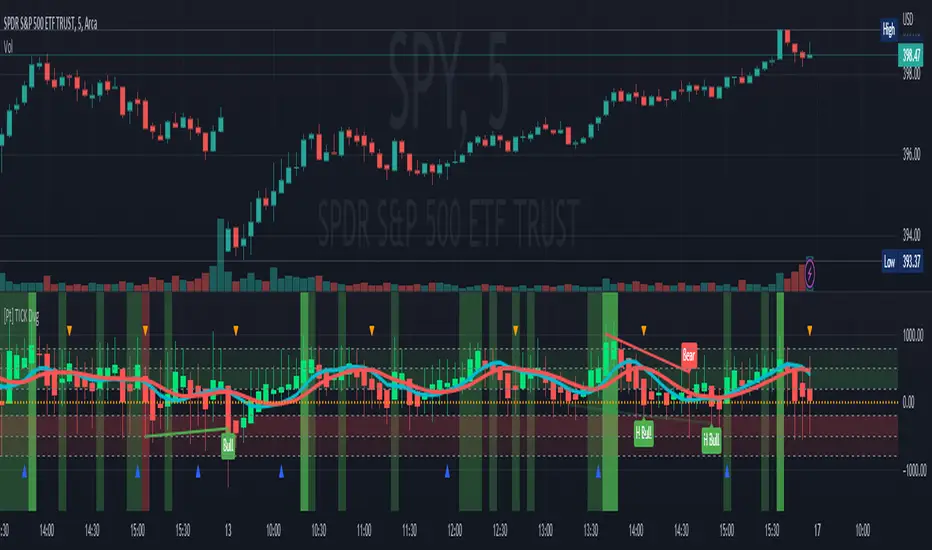
TICK Divergence + Heikin Ashi [Pt]This indicator identifies divergence between NYSE TICK and price, displays TICK in line, bar, or Heikin Ashi format, calculates various types of moving average lines and shows moving average crossovers.
What is TICK
NYSE TICK, also known as the TICK index, is a technical analysis indicator that shows the number of stocks on the New York Stock Exchange (NYSE) that are trading on an uptick or a downtick in a particular period of time. The TICK index is calculated by subtracting the number of stocks trading on a downtick from the number of stocks trading on an uptick. A reading of +1000 on the TICK index, for example, would indicate that there are 1000 more stocks trading on an uptick than on a downtick. The TICK index is often used as a measure of market sentiment, as it can provide insight into whether there is more buying or selling pressure in the market at a given time. A high TICK index reading may suggest that there is strong buying pressure, while a low TICK index reading may indicate that there is more selling pressure in the market.
The TICK index is usually very volatile, so this indicator is best suited for lower timeframes, such as 1 to 5 min charts.
Features
1) Shows bullish, bearish, hidden bullish and hidden bearish divergences
2) Three display modes for TICK data: Line, Bar, Heikin-Ashi
3) Plot various moving average lines and crossovers. Overall background
4) Configurable significant zones. Background colors will change based on closing TICK value.
Tick based chart [DotH]Version 1.0 - 2nd January 2023
Hi All,
This is my first published indicator, although I have written several hundreds for private use.
Description
Tick based chart
I got intrigued while reading about tick based charts on this page (please note this link/website owner is not affiliated with me) , so I decided to see if it would be possible to recreate this type of chart in TradingView, and here's the results.
This is an implementation for displaying a tick based chart in Trading View. There are benefits to using ticks based candles, as each candle represents the same number of "price moves" rather than an unknown number of moves.
Tick based charts are charts with candles that are rendered in the same way as traditional candles. However, instead of rendering a new candle at a specific time period,tick based candles are rendered after a set number of ticks have occured. For example, in a 50 tick chart, each candle that you see represents exactly 50 ticks, i.e. 50 price changes/moves. Having a view of what happens on the tick level, may help some traders evaluate what is happening within very large candles, or even detect a change in trend, volatility or some other metric which otherwise may not be visible using a standard chart.
Please note that this indicator DOES NOT match/synchronize timewise with the main chart in TradingView. You must view it independently. If you need to see what times are represented in the tick chart, you can look at the custom time labels and X-Axis grid lines in it to get an idea what parts of the tick based chart correspond to the main chart.
Limitations/known issues:
Currently the indicator has been restricted to 100 candles. This is for limiting the line and box usage to a max of 300 objects.
On timeframes above 1 minute, the seconds values will always be 0. In order to be able to see seconds values in the chart scale you need to be on a second level chart, which requires a premium TradingView subscription.
Changing the parameters in the settings will cause the chart to empty and start redrawing from its first candle again. This is because the tick chart is being drawn from realtime data, unlike the standard TradingView charts.
TODOs & Bugs:
Add some moving average indicators (SMA, EMA as a minimum)
Add a corresponding tick based volume chart
Create RSI, MACD, BB variations of this indicator
If you have any ideas/suggestions or bug reports, please feel free to let me know, however keep in mind that I do not have too much spare time to add things, so updates are going to be sporadic.
ABOUT CODE REUSE:
The code is free to use/change. However, if you plan to use this code to make a derivative indicator or strategy, it would be nice to know, so let me know if you feel like it!

[Pt] TICK + Heikin Ashi RSI IndicatorThis indicator combines NYSE TICK and RSI to aim to provide a view of NYSE market trend strength.
What is TICK
NYSE TICK, also known as the TICK index, is a technical analysis indicator that shows the number of stocks on the New York Stock Exchange (NYSE) that are trading on an uptick or a downtick in a particular period of time. The TICK index is calculated by subtracting the number of stocks trading on a downtick from the number of stocks trading on an uptick. A reading of +1000 on the TICK index, for example, would indicate that there are 1000 more stocks trading on an uptick than on a downtick. The TICK index is often used as a measure of market sentiment, as it can provide insight into whether there is more buying or selling pressure in the market at a given time. A high TICK index reading may suggest that there is strong buying pressure, while a low TICK index reading may indicate that there is more selling pressure in the market.
By default, I am using -800 and 800 for oversold and overbought levels. These are configurable. Also, this indicator includes TICK divergence signals.
The TICK index is usually very volatile, so this indicator is best suited for lower timeframes, such as 1 to 5 min charts.
Idea of TICK neutral zone
As part of this indicator I've identified what I consider as "neutral" range for the TICK. Based on my own personal experience, the market tends to be in consolidation or choppy in this range. By default, I've defined this range to be -200 to 200. This range is configurable.
Signals
In combination with RSI and Heikin Ashi RSI (HARSI), which help smooths out the RSI values and make it easier to identify trends and potential reversal points, this indicator aims to generate Bullish vs Bearish signals based on the following conditions:
- bullish / bearish HARSI candle
- Inside bar on HARSI candle
- TICK trend (above or below Neutral zone)
- RSI trend (above or below 0, but not overbought or oversold)
- RSI / HARSI convergence and divergence
When all bullish conditions are met, the signal turns bright green. Bright red when all bearish conditions are met. These generated signals aims to provide users easy to read visual cues to help with their trades.
A table is also provided in attempt to identify the trend in real time:
TICK trend:
- Bullish, Extended
- Bullish
- Neutral w/ Bullish bias
- Neutral w/ Bearish bias
- Bearish
- Bearish, Extended
RSI:
- Bullish
- Bearish
Note on scale
This indicator is based on the scale for TICK, hence the RSI and HARSI are scaled. By default, standard overbought RSI value of 70 = 800 on this scale, whereas oversold value of 30 = -800.
Credits:
Heikin Ashi RSI code was borrowed from @JayRogers - Heikin Ashi RSI Oscillator

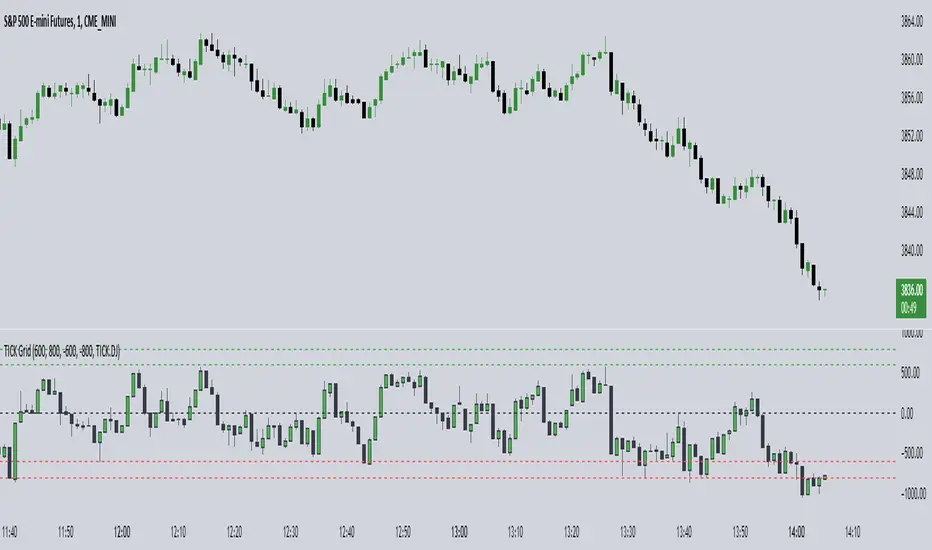
TICK Grid (TheMas7er)█ OVERVIEW
Shows the NYSE Tick Index, as it is used by TheMas7er .
This indicator has several customization options built-in that can be configured:
• Positive and negative threshold levels with show/hide option and color selection.
• Zero line with show/hide option and color selection.
• Bar colors are fully customizable.
• Symbol can be changed. Default is USI:TICK for the New York Stock Exchange.
Tick Indices are available in TradingView as a symbol - just like any other stock - which you can show on a chart.
This script adds a pane with your selected Tick Index, which can then be used as an indicator to make short-term trading decisions.
█ CONCEPTS
The Tick Index is a short-term barometer of internal market strength.
It shows the number of stocks trading on an uptick minus the number of stocks trading on a downtick, and is used by day traders to view the overall market sentiment at a given point in time.
It's categorized as a Breadth Indicator because it analyzes the "Breadth and Scope" of an entire Index.
Since the Tick Index measures the up/down ticks of a universe of stocks, any collection of stocks (market,index,...) could theoretically have it's own Tick Index.
Some of the major Tick Indices are:
• USI:TICK for the New York Stock Exchange
• USI:TICKQ for Nasdaq
• USI:TICKI for the Down Jones