LongSetups with Entry Signals and Trailing Stop(HA)High probable Long Setups for any time frame and asset.
75+ win rate
Trailing stop always used as exit point
To trade only with the trand - enable MAs in the Inputs tab
x - means Entry signal is active and waiting for long validation
B - on a closed bar is entry signal for long
C - on a developing bar is exit long signal
Green line - long validation line. must close above to go long
Pink line - trailing stop
On Long Entry alert - use Once Per Bar Close option.
On Long Exit alert (Trailing stop triggered) - use Once Per Bar option to trigger sooner and protect your capital.
Always do your own analysis and make trades on your own risk. Find a confluence point where everything aligns and make your own decision. Don't enter a trade because the indicator tells you so. You are free to make a copy of the script and change it to your own needs for your own personal use.
Trailingstop
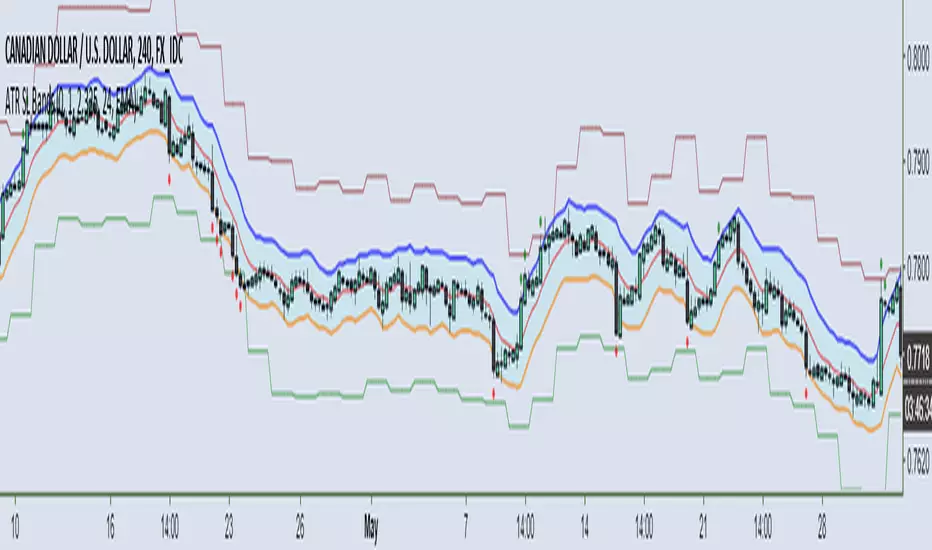
ATR Trailing Stop Bands [NeoButane]These ATR bands and trailing stops can be used as a way to manage risk, enter breakout trades, or as support/resistance.
Please see here for information about payment and access: medium.com
ATR Bands Features:
Shape plotted for closes out of bands
Custom resolution
Bands multiplier: useful for reducing size to increase signal
Band smoothing type: EMA, Hull MA, or no moving average smoothing
Calculated in geometric mean (log scaling) to resolve issues with flash dumps or pumps
Alerts for closing outside of bands
ATR Trailing Stop Features:
Based on daily resolution timeframe
Trailing stop multiplier: useful for curve-fitting to your instrument's normal trading range. Recommended multiplier between 1.5-3
Can be used as trading range (>3) or for breakout trading (<1.5)
Alerts for price touching stops
BitMex Trailing Stop StrategyThis script is designed for those who want to use BitMex's trailing stop. It's not meant to be used as entry exits, but rather to get an idea of how wide the trailing stop needs to be. I suggest you backtest with different values. The script can also be integrated into an existing strategy which does give entry/exits to act as its stop loss.

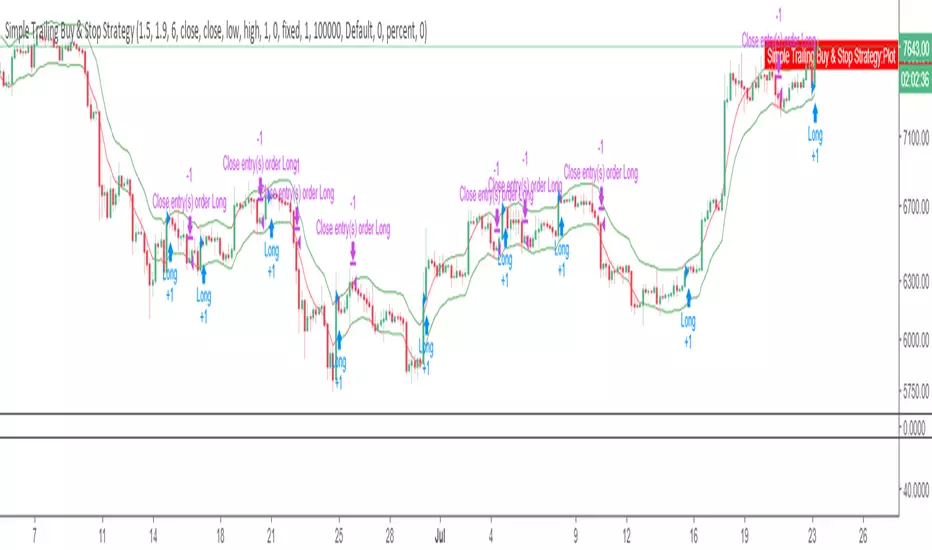
Simple Trailing Buy & Stop StrategyAllows you to backtest a simple percentage based trailing stop, with a trailing buy. Experiment with different percentages on different timeframes for different charts.
For BTCUSD, on daily 4.3% stop and 1.9% buy works well, while on 4hr a 1.5% stop and 1.9% buy works best.
Please comment with any other combos that work well for you on different markets or timeframes.
MG - Pivot trailing stopTrailing stop with alerts which automatically updates when a new pivot forms to maximize the ability to ride trends and get out in a timely fashion.
Contains long and short stop trigger alerts.

Achmed: Heikinashi Open/CloseHeikinashi strategy that looks for large % changes between the open and close of a bar or the previous open and current close.
This strategy is published for customer verification and acceptance. As such, only the customer shall be granted access.
Features
Heikinashi based strategy that is run on a normal candle chart. This ensures accurate backtest results.
Heikinashi chart is plotted on a subplot
Inputs for defining different entry conditions
Switches to turn different entry criteria on / off
Trailing stop which trails the Heikinashi prices.
Trailing stop plotting on the subplot

Renko/Linebreak Pyramiding StrategyPrivate strategy created for and in collaboration with TV user: kaiji_
This strategy employs either a Renko or Linebreak version of the current tickerid and places orders based on configurable criteria, optionally increasing winning positions as long as they remain profitable before closing on trailing stops.

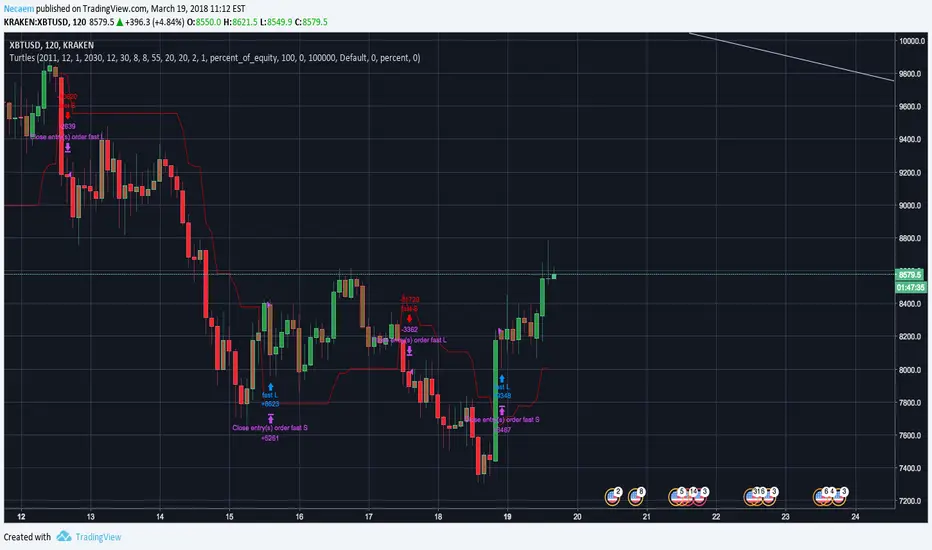
Turtles + TrailingStopThis script is a merge between the Trailing stop from HPotter and the Turtle system from tmr0 and timchep
nATR Reversal StrategyATR Reversal Strategy that has been extended to add an additional ATR based stoploss, trailing stop and take profit.
This script was developed as part of a professional development service. It is published for customer verification and acceptance.
For people interested in professional services, please visit the backtest-rookies (.com) website.
Features
nATR based Stop Loss added
nATR based Trailing stop added
nATR based Take profit added
Switches for each exit type to turn them on or off in the strategy
Plotting of all exit levels on the chart
Prevent reversing when using newly added exits.
Allow reversing when all exit switches are off and opposite long/short conditions are met.
XPloRR MA-Trailing-Stop StrategyXPloRR MA-Trailing-Stop Strategy
Long term MA-Trailing-Stop strategy with Adjustable Signal Strength to beat Buy&Hold strategy
None of the strategies that I tested can beat the long term Buy&Hold strategy. That's the reason why I wrote this strategy.
Purpose: beat Buy&Hold strategy with around 10 trades. 100% capitalize sold trade into new trade.
My buy strategy is triggered by the fast buy EMA (blue) crossing over the slow buy SMA curve (orange) and the fast buy EMA has a certain up strength.
My sell strategy is triggered by either one of these conditions:
the EMA(6) of the close value is crossing under the trailing stop value (green) or
the fast sell EMA (navy) is crossing under the slow sell SMA curve (red) and the fast sell EMA has a certain down strength.
The trailing stop value (green) is set to a multiple of the ATR(15) value.
ATR(15) is the SMA(15) value of the difference between the high and low values.
The scripts shows a lot of graphical information:
The close value is shown in light-green. When the close value is lower then the buy value, the close value is shown in light-red. This way it is possible to evaluate the virtual losses during the trade.
the trailing stop value is shown in dark-green. When the sell value is lower then the buy value, the last color of the trade will be red (best viewed when zoomed)(in the example, there are 2 trades that end in gain and 2 in loss (red line at end))
the EMA and SMA values for both buy and sell signals are shown as a line
the buy and sell(close) signals are labeled in blue
How to use this strategy?
Every stock has it's own "DNA", so first thing to do is tune the right parameters to get the best strategy values voor EMA , SMA, Strength for both buy and sell and the Trailing Stop (#ATR).
Look in the strategy tester overview to optimize the values Percent Profitable and Net Profit (using the strategy settings icon, you can increase/decrease the parameters)
Then keep using these parameters for future buy/sell signals only for that particular stock.
Do the same for other stocks.
Important : optimizing these parameters is no guarantee for future winning trades!
Here are the parameters:
Fast EMA Buy: buy trigger when Fast EMA Buy crosses over the Slow SMA Buy value (use values between 10-20)
Slow SMA Buy: buy trigger when Fast EMA Buy crosses over the Slow SMA Buy value (use values between 30-100)
Minimum Buy Strength: minimum upward trend value of the Fast SMA Buy value (directional coefficient)(use values between 0-120)
Fast EMA Sell: sell trigger when Fast EMA Sell crosses under the Slow SMA Sell value (use values between 10-20)
Slow SMA Sell: sell trigger when Fast EMA Sell crosses under the Slow SMA Sell value (use values between 30-100)
Minimum Sell Strength: minimum downward trend value of the Fast SMA Sell value (directional coefficient)(use values between 0-120)
Trailing Stop (#ATR): the trailing stop value as a multiple of the ATR(15) value (use values between 2-20)
Example parameters for different stocks (Start capital: 1000, Order=100% of equity, Period 1/1/2005 to now) compared to the Buy&Hold Strategy(=do nothing):
BEKB(Bekaert): EMA-Buy=12, SMA-Buy=44, Strength-Buy=65, EMA-Sell=12, SMA-Sell=55, Strength-Sell=120, Stop#ATR=20
NetProfit: 996%, #Trades: 6, %Profitable: 83%, Buy&HoldProfit: 78%
BAR(Barco): EMA-Buy=16, SMA-Buy=80, Strength-Buy=44, EMA-Sell=12, SMA-Sell=45, Strength-Sell=82, Stop#ATR=9
NetProfit: 385%, #Trades: 7, %Profitable: 71%, Buy&HoldProfit: 55%
AAPL(Apple): EMA-Buy=12, SMA-Buy=45, Strength-Buy=40, EMA-Sell=19, SMA-Sell=45, Strength-Sell=106, Stop#ATR=8
NetProfit: 6900%, #Trades: 7, %Profitable: 71%, Buy&HoldProfit: 2938%
TNET(Telenet): EMA-Buy=12, SMA-Buy=45, Strength-Buy=27, EMA-Sell=19, SMA-Sell=45, Strength-Sell=70, Stop#ATR=14
NetProfit: 129%, #Trade

XPloRR MA-Buy ATR-Trailing-Stop Long Term Strategy Beating B&HXPloRR MA-Buy ATR-MA-Trailing-Stop Strategy
Long term MA Trailing Stop strategy to beat Buy&Hold strategy
None of the strategies that I tested can beat the long term Buy&Hold strategy. That's the reason why I wrote this strategy.
Purpose: beat Buy&Hold strategy with around 10 trades. 100% capitalize sold trade into new trade.
My buy strategy is triggered by the EMA(blue) crossing over the SMA curve(orange).
My sell strategy is triggered by another EMA(lime) of the close value crossing the trailing stop(green) value.
The trailing stop value(green) is set to a multiple of the ATR(15) value.
ATR(15) is the SMA(15) value of the difference between high and low values.
Every stock has it's own "DNA", so first thing to do is find the right parameters to get the best strategy values voor EMA, SMA and Trailing Stop.
Then keep using these parameter for future buy/sell signals only for that particular stock.
Do the same for other stocks.
Here are the parameters:
Exponential MA: buy trigger when crossing over the SMA value (use values between 11-50)
Simple MA: buy trigger when EMA crosses over the SMA value (use values between 20 and 200)
Stop EMA: sell trigger when Stop EMA of close value crosses under the trailing stop value (use values between 8 and 16)
Trailing Stop #ATR: defines the trailing stop value as a multiple of the ATR(15) value
Example parameters for different stocks (Start capital: 1000, Order=100% of equity, Period 1/1/2005 to now):
BAR(Barco): EMA=11, SMA=82, StopEMA=12, Stop#ATR=9
Buy&HoldProfit: 45.82%, NetProfit: 294.7%, #Trades:8, %Profit:62.5%, ProfitFactor: 12.539
AAPL(Apple): EMA=12, SMA=45, StopEMA=12, Stop#ATR=6
Buy&HoldProfit: 2925.86%, NetProfit: 4035.92%, #Trades:10, %Profit:60%, ProfitFactor: 6.36
BEKB(Bekaert): EMA=12, SMA=42, StopEMA=12, Stop#ATR=7
Buy&HoldProfit: 81.11%, NetProfit: 521.37%, #Trades:10, %Profit:60%, ProfitFactor: 2.617
SOLB(Solvay): EMA=12, SMA=63, StopEMA=11, Stop#ATR=8
Buy&HoldProfit: 43.61%, NetProfit: 151.4%, #Trades:8, %Profit:75%, ProfitFactor: 3.794
PHIA(Philips): EMA=11, SMA=80, StopEMA=8, Stop#ATR=10
Buy&HoldProfit: 56.79%, NetProfit: 198.46%, #Trades:6, %Profit:83.33%, ProfitFactor: 23.07
I am very curious to see the parameters for your stocks and please make suggestions to improve this strategy.

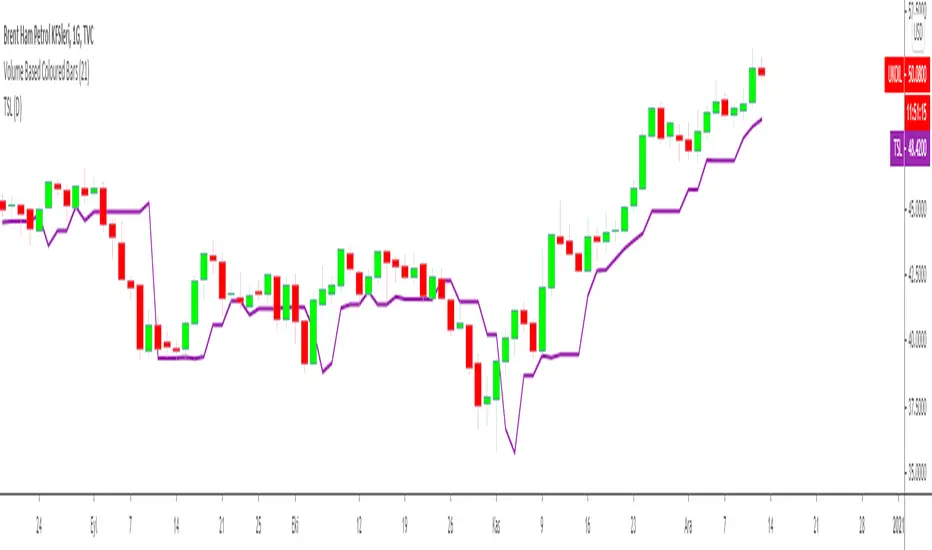
Trailing Stop Loss Indicator by KıvanÇ fr3762TRAILING STOP LOSS INDICATOR is a helpful tool for traders to help one of the greatest problems that they face: where to sell?
by using trailing stop loss you can easily decide and see possible downward movements and understand if you are in a safe zone.
Using Trailing Stop Loss is just simple:
Go short/ Sell when price crosses down the indicator,
Stay on long position if prices are above the indicator.
The indicator is calculated from previous Lows and doesn't the value won't change until prices makes higher lows.
TURKISH EXPLANATION:
İz Süren Stop Loss İndikatörü
Adım 1- bu günün düşük fiyatından geriye doğru, daha düşük fiyatlı bir günle karşılaşıncaya kadar yatay bir çizgi çizin
bu sizin birinci countback’ iniz olacak.
Adım 2- bu yeni düşük günün düşük fiyatından geriye doğru tekrar bir başka düşük güne gelene kadar yatay bir çizgi
çekin. Bu sizin ikinci countback’ iniz olacak.
Adım 3- bu ikinci düşük günün düşüğünden ileri bu günkü tarihe kadar yatay bir çizgi çekin bu sizin talimat
verdiğinizde stop-loss noktanız oluyor.
Kural 1- asla aşağıya doğru stop koymayın. Eğer yeni stop-loss noktanız öncekinden daha düşükse onu atıyorsunuz.
Bu kural asla bozulmamalı.
Kural 2- countback çizginiz üzerindeki aynı düşük fiyata denk gelen günleri yok sayın. İkinci contback çizginizi çekmek
için ilkinden daha düşük bir nokta bulmalısınız. Eğer aynı düşük fiyata sahip bir çubuğa denk gelirseniz daha düşüğünü
buluncaya kadar devam edin. Gerçekten hepsi bu kadar. Bu kuralları uygulayarak stop-loss noktamızı her yeni günün
datası eklendikçe uzatabiliriz.
drive.google.com
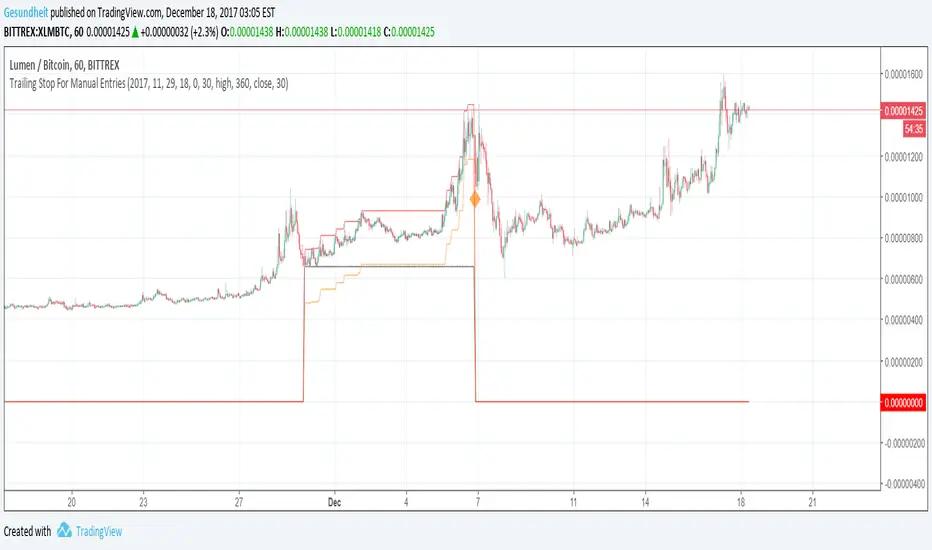
Customizable trailing Stop For Manual EntriesHere's how to create a trailing stop with a manual buy order, on an exchange that does not support native trailing stops. Code can easily be copy+pasted into your normal algos.
To set the entry price for your manual trade, specify the bar time when the trade was made. Note that the time you specify needs to correspond to an opening time on your chart--if it's a 3 hour chart, 6 pm or 9 pm will work, but 8 PM will not. It's not as bad as it sounds though, read on :)
Per usual I keep multiple options open.
Special features in this script:
Change time frame for trailing
Specify trailing parameter (high, close, hlc3, etc.)
Change time frame for stop loss trigger (use a shorter time frame for earlier exits!)
Specify trigger parameter (close, low, hlc3, etc.)
Remember that annoying issue where you might not be able to precisely specify entry price, because you want to use 3 hour closing prices for your trailing stop but you bought in at 7:41 pm? Add this indicator to a 1 minute chart and set your start time to 19:41, then set the trailing time frame to 3 hours!
Next stop is v2, where we take profits along the way before stop loss gets triggered.
GunbotXT TSSLSimulation of GunbotXT TSSL (trailing stop / stop limit) strategy useful for fine tuning settings and backtesting.
Once you have been granted access, you will receive notification in TradingView (Bell).
Then right click on Chart area -> click "Insert Indicator..." -> click "Invite-Only Scripts" -> click "GunbotXT TSSL" -> Add To Chart
At bottom -> click "Strategy Tester" -> click the "Gear" icon (Format) -> Input your desired settings to test.
Red = SellSTEP
Purple = SellGAIN
Red = SellSTOP
Blue/Yellow (changes) = FLowMA (lowest of 2 EMA's)
Blue = FastMA (off by default)
Yellow = SlowMA (off by default)
Orange = BuyPROTECT (BUY_LEVEL)
Green = BuySTOP
Green = BuySTEP
NOTICE: By requesting access to this script you acknowledge that you have read and understood that this is for research purposes only and I am not responsible for any financial losses you may incur by using this script!

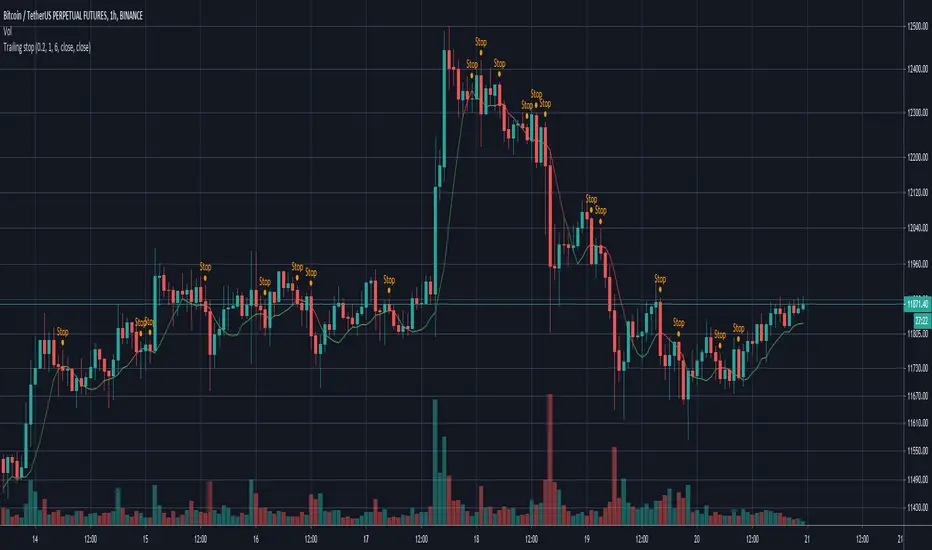
Simple Trailing stopSince my exchange doesn't support trailing stop I made a script for it.
It is fully configurable, which means you can set the bars for calculation, the offset and sources for trigger and calculation.
The original purpose for me was to send a command to my bot. If you like it please comment and check out my other scripts.
FriendlyTrend Signal//FriendlyTrend Signal//
Our Tradingview representation of our strategy. Trend-Following techniques combining analysis of buying and selling on fractals, entering low-risk positions at counter-trend points, and trailing-stop orders along moving averages.
//Strategy//
Red/Green circles indicate counter-trend entry positions. These are not lagging and form on the closing of the corresponding bar. Best opportunities for a credit, debit, or other defined-risk options spreads and closed if the trade goes against us directionally with the stop loss above the high or below the low of the previous bar on market close.
Lines represent fractal support and resistance. We execute a buy if the moving average cloud is green and the green line is broken and the price closes above. Reverse for selling.
Cloud represents long or short opportunities. If the top cloud and bottom cloud are intertwined we are sidelined & wait for a large move in one direction or the other. The middle moving average is our trailing stop & another counter-trend entry point if a major support level is broken at the moving average itself.
//Still refining the code into a Tradingview Strategy form. More to come...//

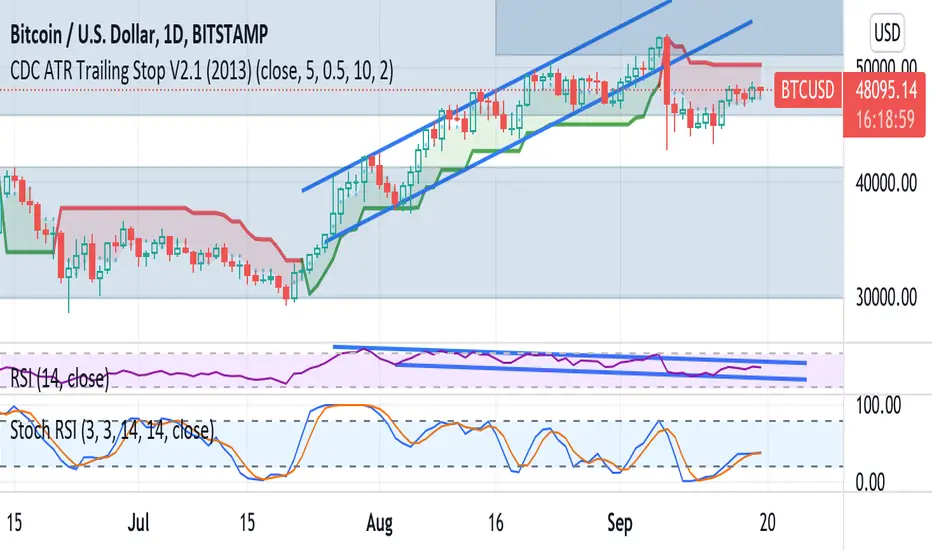
CDC ATR Trailing Stop V2.1 (2013)CDC ATR Trailing Stop V2.1
The indicator / system was developed a few years ago.
Contains two ATR trailing stop lines, fast and slow.
The slow ATR SL line is the same as the one in a normal ATR trailing stop loss indicator.
The fast one is created to generate buy/sell signals
To use the signals, activate them from the indicator's settings (gear icon next to the indicator's name on the chart) and enable buy / sell arrows.
The system works well in high volatility market.
I personally use this as the faster system in conhunction with my slower MA system to diversify portfolio performance.
Quintalytics TrailingStopQuintalytics TralingStop is a Stop Loss indicator based on trend, volatility, and range distance from the current market price.
Color GREEN indicates use in an UP TREND.
Color RED indicates use in a DOWN TREND.
Color YELLOW indicates that the market is flat/choppy and caution is advised.
You have the option of COLORING the BAR to match the TrailingStop color.
www.quintalytics.com

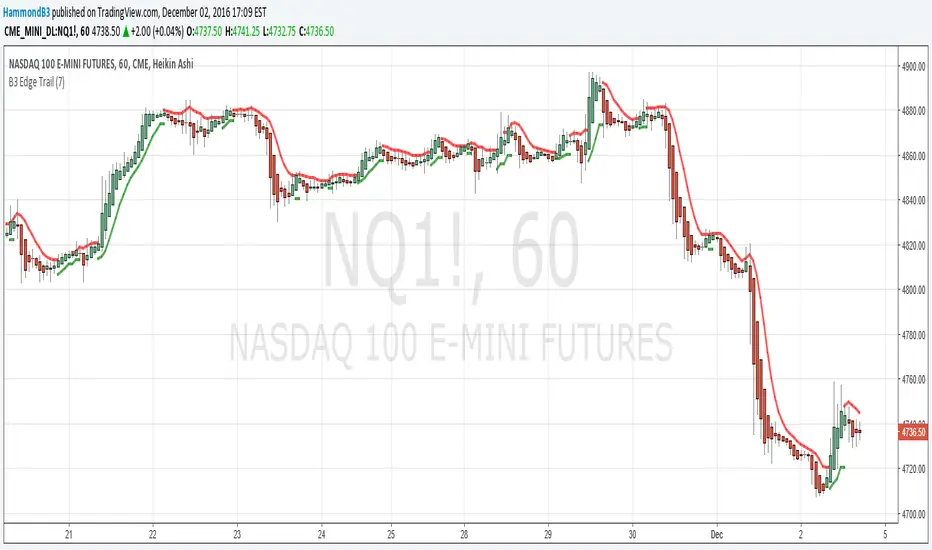
B3 Edge TrailB3 Edge Trail is similar to a SuperTrend or ATR stopline system. It is based on the average of the highs and lows, and when back-broken, the binary bias flips. Simple as pie to use, just set your input to whatever suits your chart. The more "bars back" length the less flipping, then if you lower that input number it will result in an increase in sensitivity.
Enjoy, and now that TradingView has made it easy to do, I will be offering access to the strategies I have made based on my indicators. These will be available on the web eventually.
B3 High-Low Trail-TraderSimilar to SuperTrend or the ATR trailing stop lines that are common-place in chart indicator circles, the B3 High-Low Trail-Trader works as a back-break line to flip binary long and short biasing. Here is the strategy set to 7 bars back. You can find this style of trading system in several books, and there are many ways to come to the trailing stop line, so I imagine the bars back length can be slid around to suit certain charts. This happens to be my favorite trailing line.

B3 Bar Cycle MTF (fix)Apologies, there was an error in printing for the thick gray boxes, happened when MTF was switched on. All better, and here is the details from before:
This is an interesting study that can be used as a tool for determining trend direction, and also could be a trailing stop setter. I use it as a gauge on MTF settings. If on, you can look at the bar cycle of the 1h while on the 15m giving you a lot of information in one tool. If a line is missing high or low, it is because it was broken, if both exist you are trading in range and cloud appears. If both sides break you get thick gray boxes above and below bar.
Get used to editing the inputs to suit your liking. Often 3-5 length and always looking at different resolutions to get a big picture story. You could put multiple instances of the study up to see them simultaneously. I based the idea off of Krausz's 3 day cycle which you can read about in his teachings. I tend to find it looking better using Heikin Ashi bar-style.

B3 Bar Cycle MTFThis is an interesting study that can be used as a tool for determining trend direction, and also could be a trailing stop setter. I use it as a gauge on MTF settings, in the pic MTF is turned off. If on, you can look at the bar cycle of the 1h while on the 15m giving you a lot of information in one tool. If a line is missing high or low, it is because it was broken, if both exist you are trading in range and cloud appears. If both sides break you get thick gray boxes above and below bar.
Get used to editing the inputs to suit your liking. Often 3-5 length and always looking at different resolutions to get a big picture story. You could put multiple instances of the study up to see them simultaneously. I based the idea off of Krausz's 3 day cycle which you can read about in his teachings. I tend to find it looking better using Heikin Ashi bar-style.
