Parabolic SAR Oscillator [LuxAlgo]This indicator is a detrended price series using the Parabolic Stop and Reverse (SAR) trailing stop, resulting in a bounded oscillator in the range (-100, 100). The SAR output is also normalized to obtain a noiseless oscillator which can complement the detrended price.
Settings
Start: Initial value of the convergence factor used when a new trend is detected by the SAR
Increment: Increment value of the convergence factor
Maximum: Maximum value of the convergence factor
Usage
The price is detrended by subtracting the closing price to the SAR, this result is then normalized.
An up-trending market is indicated once the normalized SAR reaches -100, while a value of 100 indicates a down-trending market. One can anticipate trends when the normalized SAR crosses above/under 0.
The converging nature of the SAR trailing stop allows for the trader to obtain a very apparent leading oscillator.
Trailingstop

Movable Stop + Trail + Alerthello everybody !
.....
this indicator helps you to get a better trading setting.
it's similar to the default draw tool from the trading view but the difference is you can add Trail stop and Alert .
.....
It also helps to free accounts to set more than 1 Alarm !!!
.....
Alert setting
just remember after you see set an alert if you change stop or entry, the alert will work with previous values/settings.
so you need to recreate an alert.
also don't change alert setting
.....
indicator setting
How is it works ?
...
settings
...
everything on :
you can see the information on the table
...
short sample :
everything on
...
simple short trade setting:
.....
my goal is to upgrade this indicator with your ideas.
not financial advice !
please , share your ideas with me to improve the indicator
I would like to see what you think about this indicator <3
also if you have any ideas to create an indicator or strategy you can make contact with me .
have a great day.

Rob Hoffman's 50/80/90/Price Trailing Stop LossA trailing stop loss method by Rob Hoffman.
Set your entry, TP, and SL.
Once price is 50% of its way to the TP, set your stop loss at the gray line.
Once price is 80% of its way to the TP, set your stop loss at the light gray line.
Once price is 90% of its way to the TP set your stop loss at the white line.

StopLossThat indicator helps us to determine the stop loss levels or prices in terms of atr levels. It includes 4 (four) options which are 1-Don't Risk, 2-Low Risk, 3-High Risk, 4-Risk Lover their exploding rates are 1-2.4% , 2-3.9% , 3-6.7% , 4-16.7% in sort. It helps us to produce new methods to decreace our risk/reward ratio. It is ATR Trailing StopLoss indicator. The indicator is awesome in terms of comfortable. Thanks and waiting for your feedbacks.

Pivot Based Trailing Maxima & Minima [LuxAlgo]This indicator returns trailing maximums/minimums and the resulting average, each resetting on the occurrence of a pivot point high/low, thus allowing to highlight past and current support and resistance levels.
Note that the user has the option to make the indicator subject to backpainting or not. Backpainting would offset the indicator output to the past and as such would be less suited for real-time applications.
🔶 USAGE
🔹 Non Backpainting
The indicator can highlight points of support and resistance given by the trailing maximum/minimum average.
An uptrend is indicated when the trailing maximum is making a new higher high, while a downtrend is indicated when the trailing minimum makes a new lower low.
🔹 Backpainting
When backpainting is enabled the historical trailing maximum/minimum and their resulting average are offset to the past. However, we extend these to the most recent bar, allowing for real-time applications of the indicator.
Users can easily analyze past trends and determine their type by observing the trailing maximum/minimum behavior. For example, trailing maximums/minimums not making new higher high/lower low would indicate a ranging market.
The frequency of new higher high/lower low can also help determine how bullish/bearish a trend was.
🔶 SETTINGS
Length: Determines the pivot high/low lookback, with higher values allowing to detect longer-term tops and bottoms.
Backpaint: Determine if the indicator is subject to backpainting. Enabling this setting would offset the returned results in the past.

Trend Step - TrailingTrend Step - Trailing Stop is a moving average-based trailing stop that moves in pre-defined steps. In this way, the user can set the number of pips/points they want the trailing to move in relation to the movements in the average. You can also see it as trend steps. Every step represents the trend movement.
Usage
Use it as a trailing stop or as a trend direction tool.
Disclaimer: No financial advice, only for educational/entertainment purposes.
Trailing Stop AlertsThis script is designed as an ATR-based trailing stop tool to assist in managing open positions.
Once you're involved in a profitable trade, if you add this script to your chart you'll be prompted to select a bar to begin trailing from.
You can then adjust the candle lookback distance for swing high/lows (7 by default), the ATR multiplier (1.0 by default), and the direction to trail (Long/Short).
You can also adjust the ATR period in the settings menu if you want to (14 period by default).
Once the script is added to your chart, it will begin drawing your trailing stop and you can then set up alerts.
Alert Options:
Any alert() function call : Will trigger an alert for both conditions (trailing stop updated, trailing stop hit)
Alert Conditions : Trailing Stop Update will trigger whenever the stop is updated, Trailing Stop Hit will trigger whenever the stop is hit.
Note: the alerts will only fire once per bar close and the trailing stop will not update on realtime bars.

ST_trailingThe trailing indicator. If ohlc4 becomes "Percent activate trail" above the entry price set by the value and entry date, then the trailing function is activated, which is considered as the maximum ohlc4 for the time in the position minus "Percent activate trail" multiplied by "koeff trail"

ATR Trailing Stop v5 One of my favorite stops is the ATR Trailing Stop-loss. With the implementation of PineScript v5, a code update was needed in order to use this stop/exit-strategy with newer strategy scripts. A timeframe selector that was not featured on earlier versions is also included. This new version can be plugged into PineScript v5 strategies, and also has a simpler/cleaner code that makes the code logic easier to follow than prior versions.
For those that are unfamiliar with the ATR Trailing Stop exit strategy; it is a trailing stop that takes into account the volatility of the underlying asset by trailing the price series using a multiple of the Average True Range (ATR). In practice I’ve found that this exit can be more effective than traditional trailing stops, depending on the volatility of the asset you are trading. More detailed information can be found at www.stockopedia.com
How do I use it? Add it to your chart as an indicator to visualize where the ATR stop would be with your settings. Or, copy and add it to your v5 strategy with the addition of a ta.crossunder(close, ATRTrailingStop) or ta.crossover(close, ATRTrailingStop) function. Special thanks and credit to HPotter who coded an earlier version of this in pine!

SuperTrend+ CleanedSimilar to SuperTrend+ which allows for confirmation bars.
Differences:
Limited to SMA calculation of average true range.
Can filter outlier volatility.
Can apply a standard deviation to the ATR value.

Trailing StopMost of the trailing stops on TradingView are made of using the lowest lows and the highest highs. Not many are based around what I called the volatile trailing stop.
This is where the trailing stop will move around according to a set percentage difference from the previous closing value. This allows you to say "If the current bar moves x percent, then stop". The script I've made here is a simple version of that with a few options for smoothing and setting the percent change.
Disclaimer: This is not financial advice, please do your own research before making any decisions.

Bjorgum AutoTrailOne Time Trade Risk Management
Incorporating the new interactive feature, this script is meant as a one time trailing stop for the active trader to manage positional risk of an ongoing trade. As a crypto trader or Fx trader, many may find themselves in a position late into the evening, or perhaps daily life is calling while a trade progresses in their favor. Adding a trailing stop to a position thats trending can help to keep you in the trade and lock in gains if things turn around when you are unable to react.
To use the trail, the user would add the script to the chart. Once added, a set of crosshairs will appear allowing the user to choose a point to begin. Often choosing to start a trail from a swing high/ low can be an ideal option. This tends to provide some protection for a stop by placing it under support for a long trade or above resistance for a short trade.
Price based trail
The trail will automatically plot and the offset is a factor of the distance from price action selected by the crosshairs. If placed above price action the script will plot a short trail, if placed below it will trail for a long position.
Additionally, there are several other trail types other than price based. There is also percent based, which offsets the trail as a percent from close. A hard stop is placed at the cross hair value, then once the distance is exceeded by the percentage specified, the trail begins.
There are 2 more volatility based trails. There is a PSAR trail which can provide quicker and tighter stops that accelerate with the trend locking in gains faster, and an ATR trail that keeps a distance from price action as a function of volatility. Volatility levels can be adjusted from the menu.
Volatility based trail (ATR)
Volatility based trail (PSAR)
Lastly, within the code for more the more technical savvy, is some starting setups for string alerts to be sent to exchanges via 3rd party or custom API applications. Some string manipulation is required for specific providers to meet their requirements, but there is some building block alerts that will take the ticker symbol, recognize the asset your trading (Fx, Crypto, etc) and take input quantity or exchange names from the settings via inputs.
Complex strings can be built to perform almost any trade related task when to comes to alerts via web hook. A little setup this way with some technology to back your system can mean a semi-automated half man, half machine setup that actually manages your trail stop while you cannot. For those that don’t go this far, there is some basic alert functionality that well trigger when a trail is hit so you can react and make a decision.
Please note that for now, interactive mode is engaged only when the script is added to the chart. Additional stops, or for adjustments to be made it is best to add a new version. Also as real trades could be at play managing an actual position, alerts are designed to go off only once to ensure no duplicate orders are sent meaning alerts are not reoccurring. Once an alert is triggered, a new trail is to be set up.
A modified version of the TradingView built in SAR equation was used in this script. To provide the value of the SAR on the stop candle, it was necessary to alter the equation to extract this value as the regular SAR “flips” at this point. Thank you to TradingView for supplying access to the built in formula so that this SAR could behave the same as the built-in function outside of these alterations
Example of SAR value maintained in trigger candle
Cheers and happy trading.

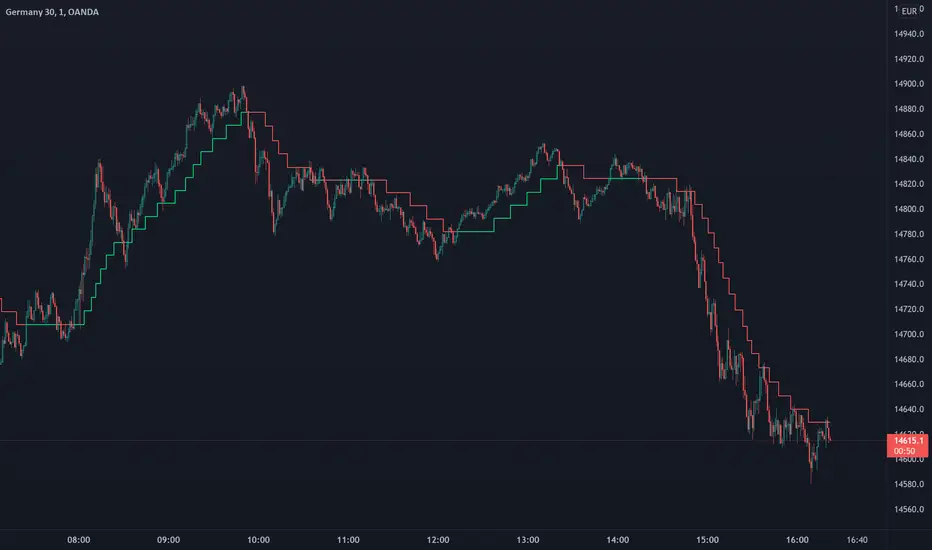
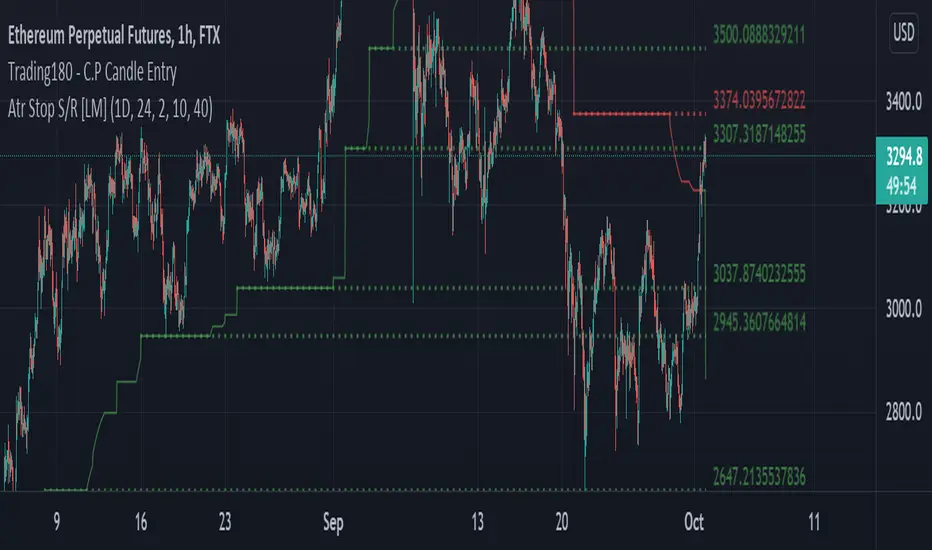
ATR Trailing Stops S/R [LM]Hello Traders,
I would like to introduce you ATR Trailing Stops S/R . The idea is to look for important levels that are identified by trailing stop line, where it usualy spents a lot of time without any move usualy turns out to be good level for bounces.
Script for atr trailing line is originaly taken from: script made by @dgmoon
It has various setting
Timeframe and atr settings
Show lines
Extend lines
Line count - how many lines will be rendered
Candle count - how many candles has to trailing line spend at the same level
Colors - controls color of plot and lines
I hope you will enjoy it, as I enjoyed to write it.
Lukas
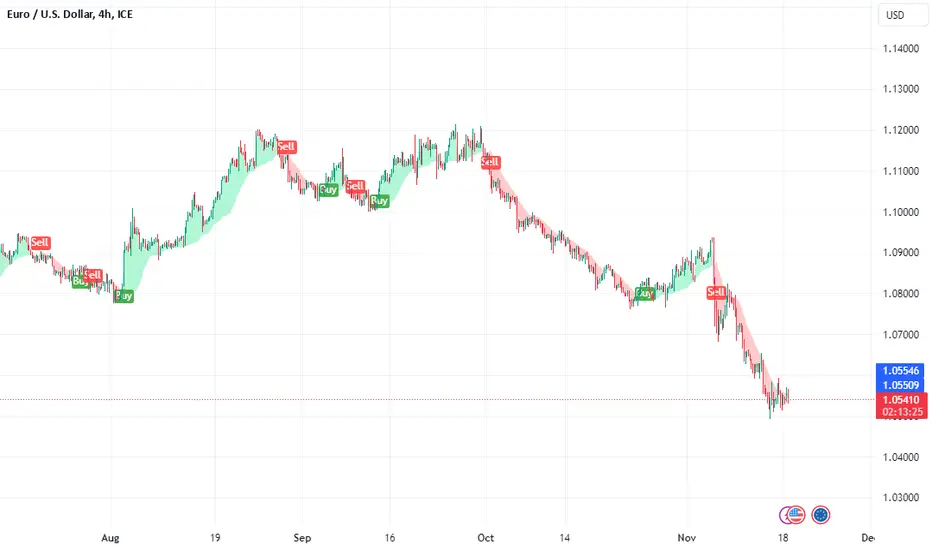
IZCI [xaurr]Yet another trailing stop loss script, using optional percentage or atr values to follow the last price.
Green area: bullish , long
Red area: bearish, short
IZCI means trailing in Turkish.
If you find it usefull, please like it.
Good Luck :)
Gann HiLo Activator [CC]The HiLo Activator was created by W.D. Gann and I was surprised to not see more of his technical indicators on here. I will start adding more of his indicators on here if I get more interest. This is the original version of the indicator that performs like a trailing stop that also works well as a trend line. Buy when the line turns green and sell when it turns red.
Let me know if there are any other indicators you want me to publish!

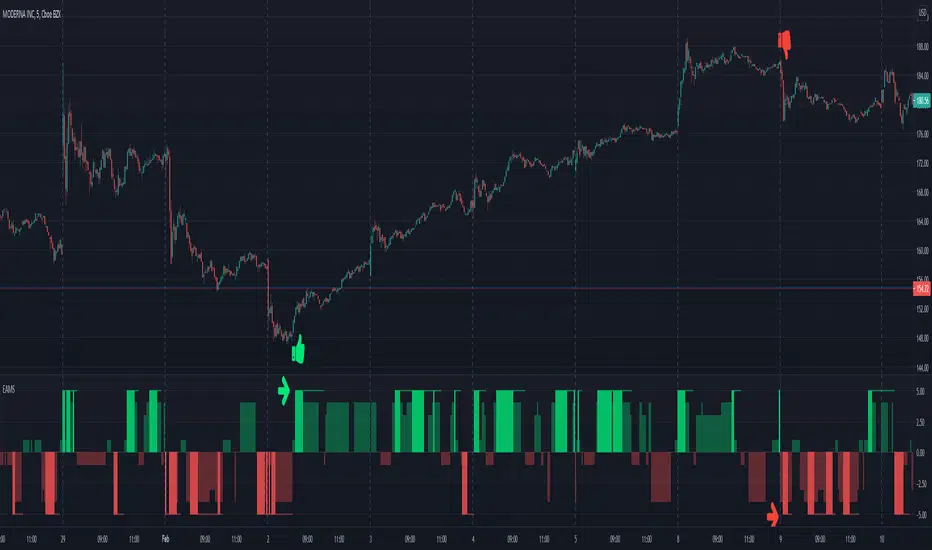
Electrified Aggressive Momentum SignalWhat this can be used for:
If you've already decided you want to trade a symbol, this can identify points of momentum alignment.
If a strong move has recently happened and you're looking for a change in momentum.
How it works:
This is a weighted combination of a Stochastic RSI and two modified SuperTrend (ATR Trailing Stop) indicators:
The Stochastic RSI signal is based upon aligned momentum and is negated at the overbought and oversold points.
The SuperTrend formula uses high and low values for calculation and both fast and slow can be adjusted for sensitivity.
Philosophy:
Signals have to be useful to humans. If a signal occurs to late, you've missed it. The intent of this indicator is to assist in timing a trade at very short time-frames. It assumes your conviction about a trade already exists, but you are trying to get an optimal entry.
Opposing momentum (weak signal) within an uptrend can be a sign that you should wait before entering. The frequency of a signal can indicate the strength of the trend. As the frequency of the aligned signal value decreases so does the reward vs risk.
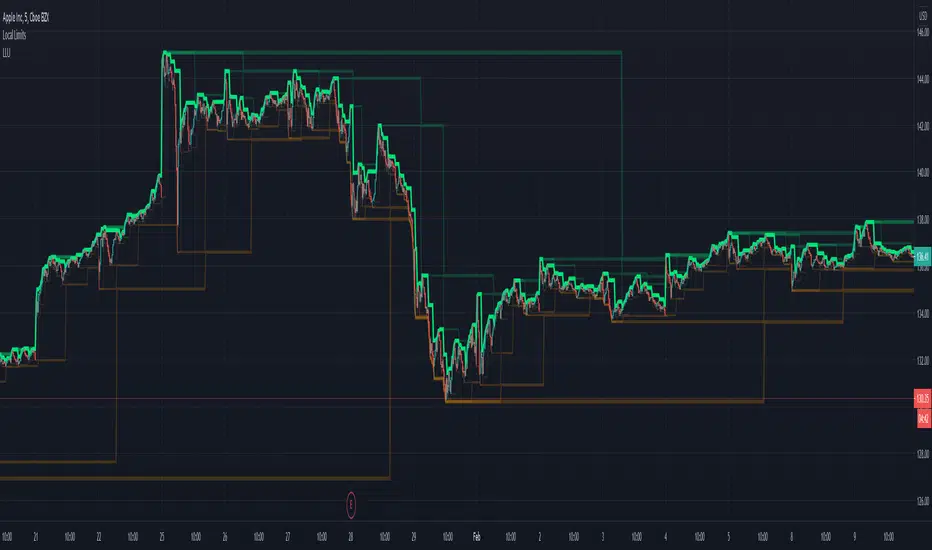
Local Limit UpperDisplays recent higher and lower highs.
In it's simplicity is a lot more powerful than might appear at first glance.
Does not rely on volatility calculation.
Can be linked together to create an objective view of recent resistance levels.
Makes current trends more visible.
Excellent as a trailing stop (short) algorithm.
Can be used with its sibling: Local Limit Lower
Local Limit LowerDisplays recent higher and lower lows.
In it's simplicity is a lot more powerful than might appear at first glance.
Does not rely on volatility calculation.
Can be linked together to create an objective view of recent support levels.
Makes current trends more visible.
Excellent as a trailing stop algorithm.
Can be used with its sibling: Local Limit Upper

Nick Rypock Trailing Reverse (NRTR)This indicator was invented in 2001 by Konstantin Kopyrkin. The name "Nick Rypock" is derived from his surname reading in the opposite direction:
Kopyrkin -> Kopyr Kin -> Kin Kopyr -> Nik Rypok
The idea of the indicator is similar to the Chandelier Exit, but doesn't involve ATR component and uses a percentage instead.
A dynamic price channel is used to calculate the NRTR. The calculations involve only those prices that are included in the current trend and exclude the extremes related to the previous trend. The indicator is always at the same distance (in percent) from the extremes reached by prices (below the maximum peak for the current uptrend, above the minimum bottom for the current downtrend).

G-ATR Box V.1Hello this is my new adapt indicator "G-ATR Box V.1"
It's just nearly normal ATR but I create in box color. My problem when I use ATR trailing stop my screen is not clean and when I use finonacci or trend line is hard to see.
How to use
Blue = Pre-buy : Waiting for another buy signal
Green = Buy : Holding the stock
Yellow = Weak uptrend : Waiting for Sell signal
Red = Sell
In this screen I compare G-ATR Box(above) with G-MACD color(below)
When the stock strong uptend all of G-ATR and G-MACD is very work and When weak uptrend G-ATR is action frist but beware Bear trap too
goodluck
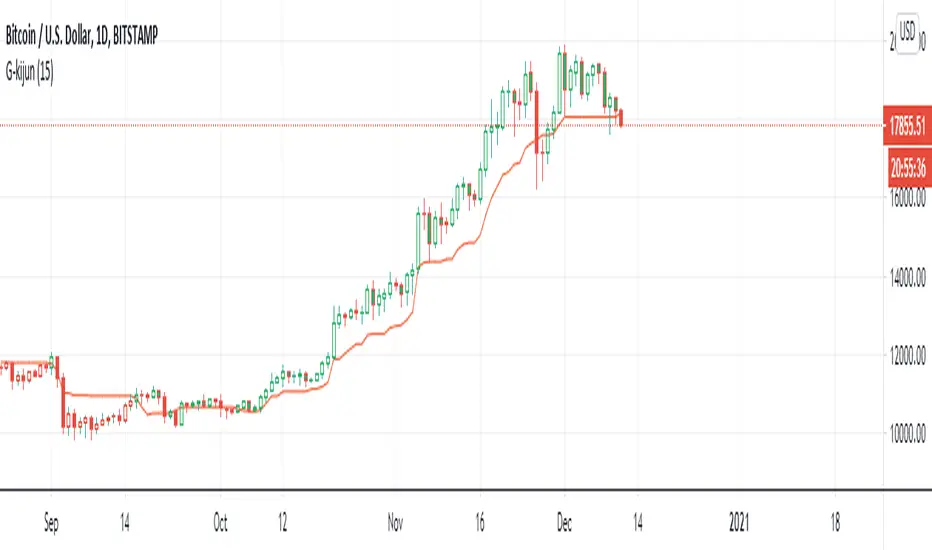
G-Kijun trailing stopThis indicator is the part of ichimoku kyo hyo.
I luv kijun-sen very much
kijun-sen is develop form (Highest - Lowest)/2
It's mean 50% of fibonacci
and I create color Green for price over the kijun-sen when the price cross down the kijun-sen it'sll be Red
SMA + Trend Strength + Trailing Stop LossThe 'SMA + Trend Strength + Trailing Stop Loss' indicator was designed for swing trading long positions over the course of days/weeks. The benefit of the indicator is to identify areas where the market of a given asset is showing signs of a strong uptrend, divergences, and fear. A 13-bar simple moving average is color coded to four colors based on 5 given conditions at a time, which are represented as a trend meter on the bottom right of the screen. A trailing stop loss indicator is included to secure your profits or limit your loss in case the market reverses on you unexpected. Please use this indicator responsibly with proper risk management, and never rely on the indicator by itself for buy and sell signals.
When the simple moving average color is green, it means that at least 4 of 5 conditions are confirming a move upwards, this is when you can take an entry into a trade based on your entry strategy. As the trend continues, the color will eventually change to yellow signaling a divergence. This is when you can use your exit strategy to find a good point to sell. It is wise not to take new positions when the color is trending yellow.
If the color changes from yellow to orange, that is a warning sign that the trend is about to change or has begun to change. Prices may have already fallen. However, sometimes the color will change from yellow back to green signaling a continuation of the trend. You can either keep holding or take a new position in this instance.
When the color is red, this signals fear in the market, you should stay out of the market at first. However, as the market consolidates and the color starts changing back to orange, this is an opportunity to take a long position at a reasonably low price.
Simple Moving Average (13-Bar) Color Explanation:
The colors change based on 5 market conditions represented in the trend meter.
Green: Strong Uptrend
Yellow: Divergence Present
Orange: Warning
Red: Fear
Trend Meter Explanation:
The trend meter draws 5 arrows indicating bullish or bearish presence.
LL = Lower Lows - Detects when the market is trending with lower lows.
HH = Higher Highs - Detects when the market is trending with higher highs.
MA = SMA Direction - A formula is used to determine the direction of the SMA.
DI = Directional Index - Identifies when upwards momentum is trending.
RSI = Relative Strength Index - Identifies when the RSI is in an uptrend state.
Note: For advanced users, this indicator has a hidden DMI(4, 4, 4) and RSI(14) indicator used to determine the last two conditions. The Directional Index is based on a DI Plus momentum moving average to determine a momentum trend and the RSI trending over 50 will constitute an uptrend signal as below 50 it will point down.
Trailing stop loss:
The trailing stop loss is determined based on the lowest price of the last 8 bars.
A gray step-line is drawn at the suggested stop activation price.
A red step-line is drawn at the suggested stop limit price.
When the price breaches the trailing stop, a red X will appear below the bar.
You can turn each of these features on or off based on your preference. Happy trading!

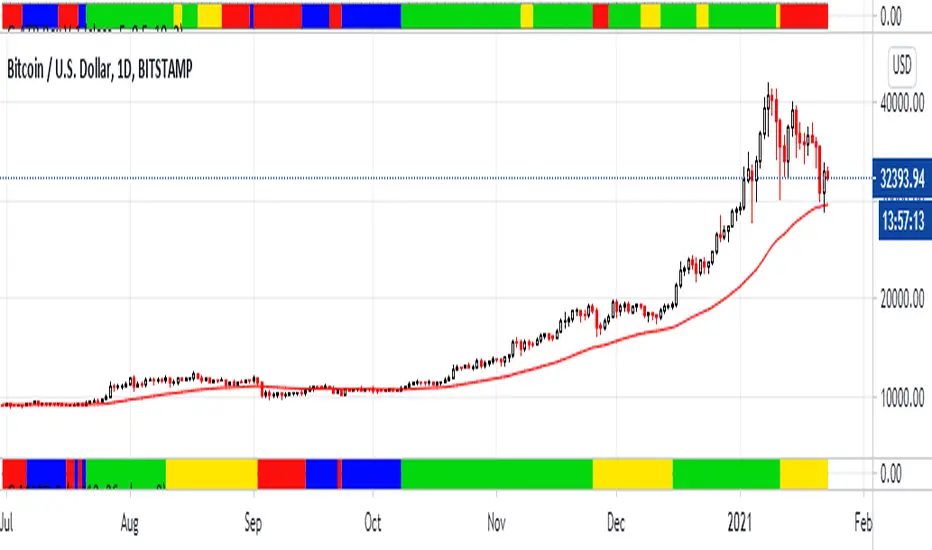
Percent Drop from Highest HighBuy and hold investors may decide to use trailing stops to protect profits and capital from market crashes, especially during bull markets.
The purpose of this indicator is to hep investors to identify a location to place them. The indicator plots the highest high from 'x' bars ago. It then plots a trailing stop loss 'y' percent below that line.
The indicator enables its users to input different 'x' and 'y' values to observe what they think works best for them in different markets.
Users might choose to pair the indicator with trend confirming indicators, such as moving average cross overs, to determine that the market is trending and not ranging.
There is no magic in this indicator, only maths. Like every indicator, it has no ability to predict anything. Just because the market is doing one thing now, it might do something different later. The past does not equal the present nor the future. Make your own decisions and be responsible for them.
All the best to you and your family.
