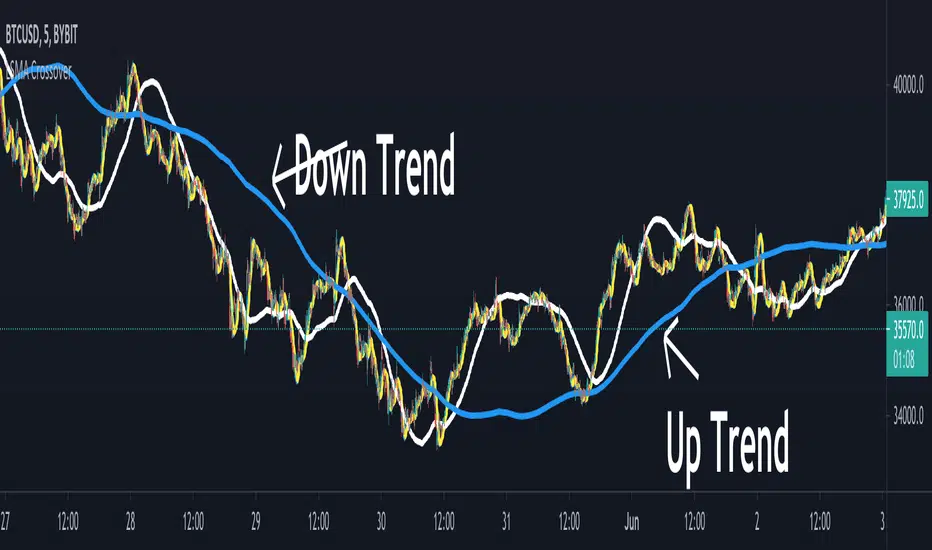
The oscillator version of the well known On Balance Volume Indicator (OBV). General Usage Plain old OBV can be used to confirm trends, as well as spot possible trading signals due to divergences. A benefit of the oscillator version is that it can produce LONG or SHORT signals on zero line cross. Moving Averages 4 different Moving Averages are available: ...
Hey guys, I recently used the "ADX and DI" indicator in a variety of my own scripts. Because I keep on developing version 4 scripts and the "ADX and DI" indicator is developed in one of the previous PineScript versions, I had to update the old script every time I wanted to use it. I decided to publish the updated version and also changed a few things: - ADX...
Hello Traders! You know, I can sill remember the first time I started tinkering with Pinescript. As I had no prior programming experience, I learned by experimenting with other open-source scripts on TradingViews Marketplace. Tearing apart and combining interesting scripts to see what the output would be. @ChrisMoody was a huge source of inspiration for learning,...
English In general, Bollinger Bands are used as an indicator to visualize the "reversion to the mean". However, in this model, by using smaller variable values (default: 10 time intervals instead of 20, 1 standard deviation instead of 2), they are used as an trend following indicator. Two consecutive closes above the upper band form a buy signal (symbol 'B' above...
This is a LAGGING indicator which can provide a good indication of trend. It require a certain (configurable) number of candles to have closed before it can determine whether a pivot has formed. It provides a 20 period SMA for the timeframe of your choice which is color coded to show the trend according to confirmed pivots. Anticipated usage: Long / Short...
A wave trend script based on LazyBears script but with added signals and a histogram...
I was playing around with the TSI-MACD and surprisingly it works quite well as a mirror. There are 2 ways this can be used 1. Enter long when Blue line crosses up the Red 2. Exit long when Green line crosses the blue or 1. Enter long when Blue line crosses up the Red 2. Exit long when Blue line crosses back down below the Red
This Volume Effectiveness indicator is designed to allow users to try and identify how effective volume is on each candle, and smoothing those values over time to try to find trends. Volume Effectiveness is the % change in price for each single unit of volume on the associated candle. The value can be positive or negative, but there is an option to just monitor...
Use as a supplementary Indicator to confirm your entries, but it is as good on it's own. When you first apply the indicator to your chart make sure you shrink it down It looks a lot better that way The indicator consists of 3 different Trend Meters and a Trend Bar which are used to confirm trend As a bonus Possible Momentum Setup entries based on Stochastics...
A centerline/non-chart indicator version of Everget's Supertrend script for use in NNFX-style indicator setups, with the emphasis on this indicator NOT adding visual clutter to the main charting area with a baseline indicator already present. This is literally the EXACT same script as Everget's Supertrend, but not drawn on the chart and with the fill/stop and...
This RSI indicator is one of my favorite indicators. This powerful indicator is implemented by Phi-Deltalytics. I modified the drawing so that it is easier (at least for me) to see the signals and trends (it would not matter if you're doing algorithmic trading). Trends and signals. For detailed instructions and tutorial see Phi-Deltalytics page
The trend is your friend. MA's are a simple and an easy way to find the trend on anytime frame. A lot of people use the 200 MA to define trend but I've always preferred EMA's. This is a 150 ema and 250 ema cloud. Ema's can act as support and resistance. Instead S/R being a single line on the chart S/R is seen more as an area on support and therefore a cloud...
MT4 iTrends ported over. Adapted Bulls/Bears Power from HPotter indicator. I can't confirm if that represents the iBullsPower/iBearsPower function from MT4. Do try and provide your feedback !
The indicator is based on the RSI and the Absolute Strength Histogram (more specifically the modification by Jie). It is meant to be used to filter out periods of consolidation, and determine if the bulls or bears are in control when there is enough action to possibly start a trend. The RSI is not used to find overbought or oversold conditions, but to find...
Introducing A New Calculation For Efficient Bands Calculation ! Here it is ! The Recursive Bands Indicator, an indicator specially created to be extremely efficient, i think you already know that calculation time is extra important in algorithmic trading, and this is the principal motivation for the creation of the proposed indicator. Originally described in my...
The SSL indicator with colour change. Tool for spotting trends and finding good entry points. I recommend using it for higher timeframes, from 4h to 1D. Play with the settings, you can change the moving avarage type, its length, if you prefer having the default bar colours in your chart, disable the colouring function in the script. Good luck crypto traders! CryptoJJ
WMX Keltner Channels Keltner Channels enhanced version
The "Range Force Impulse" indicator combines 4 useful indicators into one, freeing up chart real-estate and giving the trader insight into trend health, bull/bear commitment, range and volatility all at a glance. The indicator consists of the following: Direction - True Range and Average True Range columns shown above and below 0 depending on direction of...