SVAMA - A Non Parametric Adaptive Moving Average Based On VolumeIntroduction
Technical indicators often have parameters settings that the user must enter, those are inconvenient when the user must design a strategy because such settings must be optimized, it must also been noted that the optimal settings at time t could change at time t+n , this is why non parametric indicators are more efficient. Today i propose a moving average adapting to the market volume without using parameters affecting the smoothing.
The Indicator
The volume is rescaled in a range of (1,0) by using max or min normalization. Exponential averaging is used to provide the moving average.
When using max normalization the moving average react faster when the volume is closer to its all time high, when using min normalization the moving average react faster when the volume is closer to its all time low. You can select the method (max or min) from the "Method" parameter.
Volume tend to be higher and more periodic with higher time-frames, this is why lower time-frames might return smoother results when using the Max method. It is recommended to use the Max method when we want a faster moving average while the Min method is more suited to get a slower moving average.
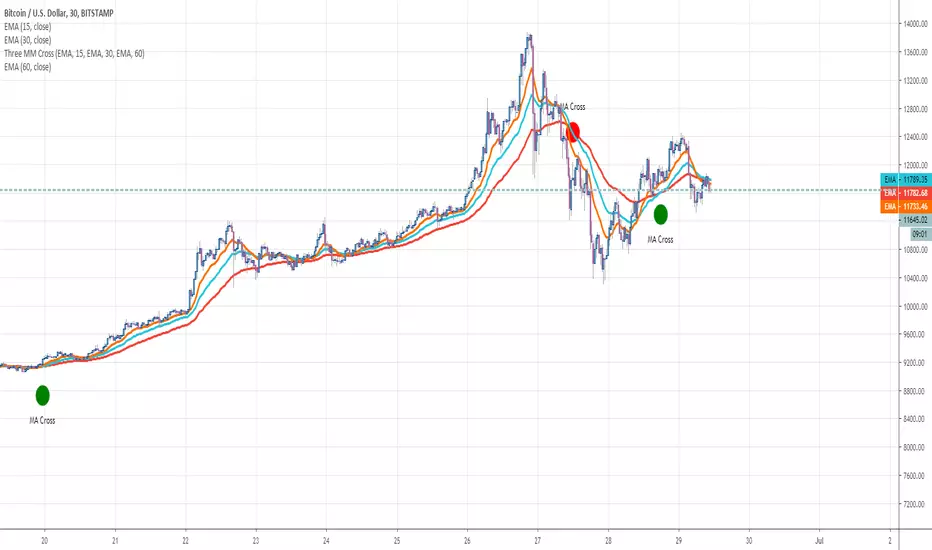
Both methods can provide an interesting MA-Cross system when used on higher time frames.
Conclusion
There should be more non parametric indicators, this would allow for faster and easier optimization processes when creating a strategy, in theory any indicator using a moving average or highest/lowest could be made non parametric by using a running mean or running max/min but the indicator might loose important information.
This is one of my main focus right now since such indicators could also allow for improvements when used with artificial intelligence. I hope you find an use to it, don't hesitate to send me your suggestions.
Thanks for reading !
Penunjuk Pine Script®