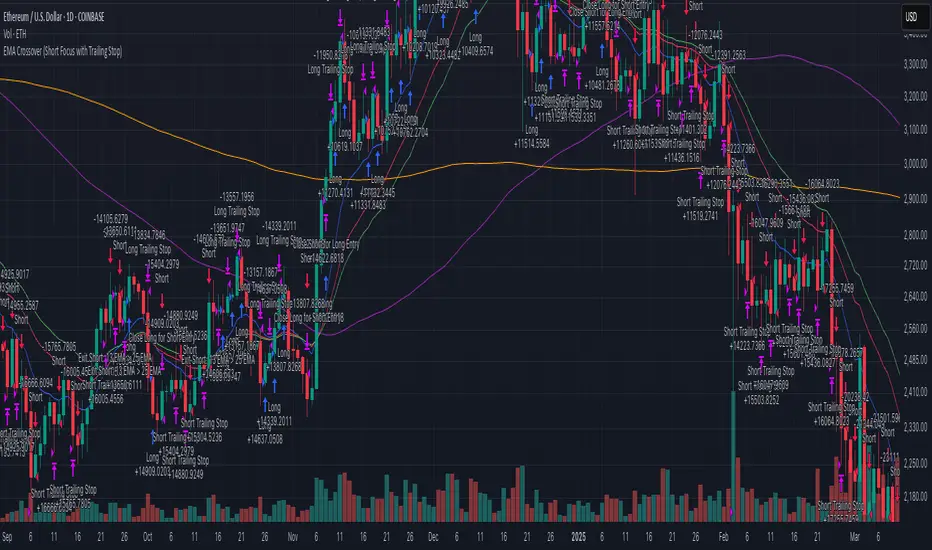
Strategy Myth-Busting #10 - InsideBar+EMA - [MYN]This is part of a new series we are calling "Strategy Myth-Busting" where we take open public manual trading strategies and automate them. The goal is to not only validate the authenticity of the claims but to provide an automated version for traders who wish to trade autonomously.
Our 10th one we are automating is the " 75% Win Rate High Profit Inside Bar Trading Strategy - What If You ... " strategy from " Trade Pro " who claims to have backtested this manually and achieved 11,063% profit with a 75% winrate over 100 trades. I was unable to emulate these results consistently accommodating for slippage and commission but even so, the results look promising. I was only able to achieve this win-rate with some multiple take profit staggering. Even so the markdown is above where I would normally consider comfortable (>20%).
If you know of or have a strategy you want to see myth-busted or just have an idea for one, please feel free to message me.
This strategy uses a combination of 2 open-source public indicators:
Inside Bar Ind/Alert by CMA
EMA (built-in)
Trading Rules
4 hour candles
Stop Loss at EMA Line with TP Target 1.5x the risk
Long Entry when these conditions are true
inside bar and bullish
Bar close's above 50 ema
Price action rises above high of inside bar .
Short Entry when these conditions are true
inside bar and bearish
Bar close below 50 ema
Price action falls below low of inside bar
Analisis Trend
[XRP][1h] Chanu Delta inspired — Breakeven StrategyHello, this is my first TV contribution. I usually don't publish anything but the script is a quick review of an other contributor (Chanu Delta V3 script )
I reverse engineered this indicator today as I wanted to test it on other contracts. The original version (which aims to be traded on BTC) has been ported to XRP (as btc and xrp prices are narrowly correlated) then modified with a couple of what I believe are improvements:
- No backtest bias even with `security` function.
- Extra backtest bias validation, always trading on next bar as Crossover/under bias is confirmed
- Backtest with 2 ajustable TP, ajustable equity and breakeven option
- The current version is not design to use pyramiding as it would require extra logic to monitor the lifecycle of the position in the context of a study.
- Commented alerts examples with variables available in script scope so you can use them in alerts (just replace strategy with indicator and remove backtest related code block).
- Trade filling assumption set to 10, fees to 0.02 as the are default bybit maker fees and I advice to enter with trailing orders using a max of 2 ticks as offset to lower fees rather than a market order!
- Backtest and Alerts happen on barclose.
- No repaint guaranteed.
There are a thousand ways to improve it (adx/bb based dynamic TP/SL, order lifecycle, pyramiding...) but it seems to be a cool starting point.
Don't forget to have fun!
Ichimoku Breakout Kumo SWING TRADER (By Insert Cheese)A simple strategy for long spot or long futures (swing traders) based on a basic method of Ichimoku Kinko Hyo strategies.
The strategy is simple:
- Buy when the price breaks the cloud
- Close the trade when the price closes again inside the cloud.
The parameters that work best on this strategy are 10,30,60,30 and 1 for Senkou-Span A
but you can try classic Ichimoku parameters (9,26,52,26,26) or whatever you want like (7,22,44,22,22), (10,30,60,30,30) and others.
-1D chart
I have removed everything from the interface except the cloud to make it visually more aesthetic :D (but if you want to see all the ichimoku indicator you can put in again into the chart)
I have also added several functions for you to do your own backtesting:
- Date range
- TP AND SL method
- Includes long or short trades
The strategy starts with 500 $ and use 100% for trade to make the power of the compounding :P
Remember that this is for only educational porpouse and you must to do your own research and backtested on your usually market..
I hope you like it enjoy and support this indicator :)
Donate (BEP20) 0xC118f1ffB3ac40875C13B3823C182eA2Af344c6d
LarryWillians - Simple StrategyA simple and classic strategy on market, created by LarryWillians using a EMA9.
The brute model use a Cross from closing price on EMA9. But occurs many false entries.
In other to correct this kind of thing, I add a SMA21 to confirm the trend and decrease numbers of false trades.
The strategy waits to break the last High (for buy) a position.
As a strategy requires a Risk Mannager, I created a simple way to trailing this, as well a Take Proft and Stop Loss in %.
Is not the best strategy but, is one of the most famous on financial markets. I did my adaptive version as simples as it is :)
Strategy Myth-Busting #8 - TrendSurfers+TrendOsc - [MYN]This is part of a new series we are calling "Strategy Myth-Busting" where we take open public manual trading strategies and automate them. The goal is to not only validate the authenticity of the claims but to provide an automated version for traders who wish to trade autonomously.
Our 8th one is an automated version of the " 653% Gain Magical 1 Minute Scalping Strategy Tested 100 Times | Become Consistently Huge Profit " strategy from " Fxaccurate US " who claims to have achieved 653% profit scalping GOLD on the 5 minute timeframe. As you can see from the backtest results below, I was unable to substantiate anything close to that that claim on any timeframe or symbol. Myth 10000% busted.
If you know of or have a strategy you want to see myth-busted or just have an idea for one, please feel free to message me.
This strategy uses a combination of 2 open-source public indicators:
Trend Surfers - Premium Breakout + Alerts by TrendSurfersSignals
Mawreez' Trend Oscillator Indicator by Mawreez
Trading Rules:
1 min - 15 min candles
Stop loss middle between high and low Risk 1:2
Long Condition
Trend Surfers Trailing stop line goes below (Crosses) lowest low
Bullish Candle (red)
Mawreeze Trend Oscilator Indicator is green
Short Condition
Trend Surfers Trailing stop line goes above (Crosses) highest high
Bearish Candle (red)
Mawreeze Trend Oscilator Indicator is red
Volatility Stop with Vwap StrategyFirst the credits goes to @TradingView for their release of the volatility stop mtf indicator.
I have took it, and inside I have added a weekly vwap for a better trend direction and at the same time I have added a dynamic risk managment which is calculated from the distance between the volatility line to the close of the candle.
The rules for entry are simple:
For long:We enter when our close of the candle is above the volatility stop line and at the same time the close of the candle is above weekly vwap
For short we enter when our close of the candle is below the volatility stop line and at the same time the close of the candle is below weekly vwap.
We exit when we either have a reverse signal than the one we enterred, or based on the TP/SL which is calculated with the distance from vwap to the close of the candle.
If you have any questions please let me know !
Supertrend - Long & Short -Sachin Ughadethis indicator for super trend strategy with buy and sell signals
Balance of Power Heikin Ashi Investing Strategy Balance of Power Heikin Ashi Investing Strategy
This is a swing strategy designed for investment help.
Its made around the Balace of Power indicator, but has been adapted on using the Monthly Heikin Ashi candle from the SPY asset in order to be used with correlation for US Stock/ETF/Index Markets.
The BOP acts as an oscilallator showing the power of a bull trend when its positive and a bearish trend when its in negative. At the same time we can spot reversals, based on the percentiles ( 99/1)
The rules for entry :
For long : The 99 percentile is ascending, and we are either in a positive value (>0), or we crossed the bottom place ( -0.35)
For short : the 99 and 1 percentile are descending, and we are either in a negative value(<0), or we crossed down the top place ( 0.6)
If you have any questions please let me know !
Coral Trend Pullback Strategy (TradeIQ)Description:
Strategy is taken from the TradeIQ YouTube video called "I Finally Found 80% Win Rate Trading Strategy For Crypto".
Check out the full video for further details/clarification on strategy entry/exit conditions.
The default settings are exactly as TradeIQ described in his video.
However I found some better results by some tweaking settings, increasing R:R ratio and by turning off confirmation indicators.
This would suggest that perhaps the current confirmation indicators are not the best options. I'm happy to try add some other optional confirmation indicators if they look to be more effective.
Recommended timeframe: 1H
Strategy incorporates the following features:
Risk management:
Configurable X% loss per stop loss
Configurable R:R ratio
Trade entry:
Based on strategy conditions below
Trade exit:
Based on strategy conditions below
Backtesting:
Configurable backtesting range by date
Trade drawings:
Each entry condition indicator can be turned on and off
TP/SL boxes drawn for all trades. Can be turned on and off
Trade exit information labels. Can be turned on and off
NOTE: Trade drawings will only be applicable when using overlay strategies
Alerting:
Alerts on LONG and SHORT trade entries
Debugging:
Includes section with useful debugging techniques
Strategy conditions
Trade entry:
LONG
C1: Coral Trend is bullish
C2: At least 1 candle where low is above Coral Trend since last cross above Coral Trend
C3: Pullback happens and price closes below Coral Trend
C4: Coral Trend colour remains bullish for duration of pullback
C5: After valid pullback, price then closes above Coral Trend
C6: Optional confirmation indicators (choose either C6.1 or C6.2 or NONE):
C6.1: ADX and DI (Single indicator)
C6.1.1: Green line is above red line
C6.1.2: Blue line > 20
C6.1.3: Blue trending up over last 1 candle
C6.2: Absolute Strengeh Histogram + HawkEye Volume Indicator (Two indicators combined)
C6.2.1: Absolute Strengeh Histogram colour is blue
C6.2.2: HawkEye Volume Indicator colour is green
SHORT
C1: Coral Trend is bearish
C2: At least 1 candle where high is below Coral Trend since last cross below Coral Trend
C3: Pullback happens and price closes above Coral Trend
C4: Coral Trend colour remains bearish for duration of pullback
C5: After valid pullback, price then closes below Coral Trend
C6: Optional confirmation indicators (choose either C6.1 or C6.2 or NONE):
C6.1: ADX and DI (Single indicator)
C6.1.1: Red line is above green line
C6.1.2: Blue line > 20
C6.1.3: Blue trending up over last 1 candle
C6.2: Absolute Strengeh Histogram + HawkEye Volume Indicator (Two indicators combined)
C6.2.1: Absolute Strengeh Histogram colour is red
C6.2.2: HawkEye Volume Indicator colour is red
NOTE: All the optional confirmation indicators cannot be overlayed with Coral Trend so feel free to add each separately to the chart for visual purposes
Trade exit:
Stop Loss: Calculated by recent swing low over previous X candles (configurable with "Local High/Low Lookback")
Take Profit: Calculated from R:R multiplier * Stop Loss size
Credits
Strategy origin: TradeIQ's YouTube video called "I Finally Found 80% Win Rate Trading Strategy For Crypto"
It combines the following indicators for trade entry conditions:
Coral Trend Indicator by @LazyBear (Main indicator)
Absolute Strength Histogram | jh by @jiehonglim (Optional confirmation indicator)
Indicator: HawkEye Volume Indicator by @LazyBear (Optional confirmation indicator)
ADX and DI by @BeikabuOyaji (Optional confirmation indicator)
SUPPORT RESISTANCE STRATEGY [5MIN TF]A SUPPORT RESISTANCE BREAKOUT STRATEGY for 5 minute Time-Frame , that has the time condition for Indian Markets
The Timing can be changed to fit other markets, scroll down to "TIME CONDITION" to know more.
The commission is also included in the strategy .
The basic idea is when ,
1) Price crosses above Resistance Level ,indicated by Red Line, is a Long condition.
2) Price crosses below Support Level ,indicated by Green Line , is a Short condition.
3) Candle high crosses above ema1, is a part of the Long condition .
4) Candle low crosses below ema1, is a part of the Short condition .
5) Volume Threshold is an added confirmation for long/short positions.
6) Maximum Risk per trade for the intraday trade can be changed .
7) Default qty size is set to 50 contracts , which can be changed under settings → properties → order size.
8) ATR is used for trailing after entry, as mentioned in the inputs below.
// ═════════════════════════//
// ————————> INPUTS <————————— //
// ═════════════════════════//
→ L_Bars ———————————> Length of Resistance / Support Levels.
→ R_Bars ———————————> Length of Resistance / Support Levels.
→ Volume Break ———————> Volume Breakout from range to confirm Long/Short position.
→ Price Cross Ema —————> Added condition as explained above (3) and (4).
→ ATR LONG —————————> ATR stoploss trail for Long positions.
→ ATR SHORT ————————> ATR stoploss trail for Short positions.
→ RISK ————————————> Maximum Risk per trade intraday.
The strategy was back-tested on TCS ,the input values and the results are mentioned under "BACKTEST RESULTS" below.
// ═════════════════════════ //
// ————————> PROPERTIES<——————— //
// ═════════════════════════ //
Default_qty_size ————> 50 contracts , which can be changed under
Settings
↓
Properties
↓
Order size
// ═══════════════════════════════//
// ————————> TIME CONDITION <————————— //
// ═══════════════════════════════//
The time can be changed in the script , Add it → click on ' { } ' → Pine editor→ making it a copy [right top corner} → Edit the line 27.
The Indian Markets open at 9:15am and closes at 3:30pm.
The 'time_cond' specifies the time at which Entries should happen .
"Close All" function closes all the trades at 3pm , at the open of the next candle.
To change the time to close all trades , Go to Pine Editor → Edit the line 92 .
All open trades get closed at 3pm , because some brokers don't allow you to place fresh intraday orders after 3pm .
// ═══════════════════════════════════════════════ //
// ————————> BACKTEST RESULTS ( 100 CLOSED TRADES )<————————— //
// ═══════════════════════════════════════════════ //
INPUTS can be changed for better Back-Test results.
The strategy applied to NSE:TCS ( 5 min Time-Frame and contract size 50) gives us 60% profitability , as shown below
It was tested for a period a 6 months with a Profit Factor of 1.8 ,net Profit of 30,000 Rs profit .
Sharpe Ratio : 0.49
Sortino Ratio : 1.4
The graph has a Linear Curve with Consistent Profits.
The INPUTS are as follows,
1) L_Bars —————————> 4
2) R_Bars —————————> 4
3) Volume Break ————> 5
4) Price Cross Ema ——> 100
5) ATR LONG ——————> 2.4
6) ATR SHORT —————> 2.6
7) RISK —————————> 2000
8) Default qty size ——> 50
NSE:TCS
Save it to favorites.
Apply it to your charts Now !!
Thank You ☺ NSE:TCS
Stock Gaps SPY Correlation StrategyThis is daytrade stock strategy, designed to take the best out of the daily gaps that are forming between the close of previous day and opening of present day.
At the same time its logic has been adapted for SPY chart, in order to use correlation with the other stocks/assets/ etf which are linked with SP500 movement.
Lastly it has been added 2 new confirmation logics, based on the USI: advance/decline chart and percentage above vwap among all US stocks.
The rules for entry are simple :
We are at the opening daily candle, we have a long/short gap based on where the opening is happening and at the same time we are checking to see that the current different between the current difference between low and previous high (or viceversa) is higher than an established parameter(minimal deviation )
For exit, we exit based on time/clock parameter, in this case by default I selected 1h and half before close of the US session.
For testing purposes I have used 10% of the available capital, with a 0.0035$ comission per each share bought ( IBKR comissions)
If there are any questions, please let me know either here or in private !
Pro Trading Art Open Range Breakout StrategyThis strategy is based on Selected Candle High Low Breakout with buffer point.
You can select specific candle from input tab by giving time of that candle.
Default Settings:
Start Hour : Hour of starting candle means from this input you can specify opening candle. Default is 9.
Start Minute: Minute of starting candle. Default is 15. Means Default opening candle is 9:15
Stop Hour : Means After this time no new trade will execute.
End Hour & End Minute & Close All Trade : Means when you specify End Hour and Minute and Close all trade is true then strategy will close all trade on specified time.
Buffer : With the help of this option you can add some point in High and low of Opening Candle
Trade Mode : You can specify Target and Stop Loss in point or Percent
Stop Loss Point or Percent : This will work according to Trade Mode
Target Point Or Percent : This will work according to Trade Mode
Accumulation Stage Identifier and Strategy around for TradingIn the psychology of trading at any market condition, there are four stage usually occurs on any tickers.
Stage 1 -> Neglect phase or consolidation phase
It occurs when the company does not produce the expected result and waiting for next result.
It can extend for days, weeks, months and years. Never give entry at this stage though that blue-chip told to be cheaper in price.
Stage 2 -> Accumulation
It occurs when the company's earning and sales consistently grows.
It can extend for days, weeks, months but should not expect the continues increase in price, as there will be potential pull-back which can be considered as opportunity to accumulate.
If the company fundamental is good, just give some space at the time of pullback.
Most of the time, the pullback volume will be low to compare to volume at the time of increase.
Usually, the stock that is going through accumulation stage will definitely trade above 200SMA and short term MA will be greater than long term moving average.
Continues the highest high and highest low along with volume.
Stage 3 -> Distribution
It occurs when the company's earning and sales stagnated due to certain reason.
It can extend for days, weeks while the price and volume highly volatile.
High volume while the price low
Typically, the stock that is going through distribution stage will certainly trade below 200SMA and short term MA will be lesser than long term moving average.
Continues the lowest high and lowest low along with volume.
Stage 4 -> Capitalization
Price reaches the 52W low while volume spikes on big down.
In each stage, the price & volume are perfect indicator to highlight the situation and the trader with proper discipline and patients can certainly reap the fruitful outcome of accumulation stage.
Based on this explanation, here is the strategy that is created with 50,90 & 200 Simple moving average and price volume trends (PVT) indicator applied on MACD to signal whenever the PVT convergence and divergence.
Note:
As the indicator designed to signal on the ticker that trade above 200 moving average, it is good to use this strategy on companies that are fundamental strong.
Whenever, there is pull back happens, the strategy might signal for exit, however, here comes the traders patient based on the conviction on the particular chosen stocks.
White being patient is good, disciplinary in following the strategy also important. Hence, consider the action when the stock goes opposite direction from your expectation.
Hope this strategy would help you find the profit.
Happy investing.
EMA + Bullish Engulfing Candle Pattern StrategyHello Guys! Nice to meet you all!
This is my first open source script!
### Long Condition
1. Bullish Engulfing Candle
2. No doge Candle
3. Present volume should be bigger than the previous volume (20%)
4. Trend filter (with 2 EMAs)
### Close Condition
1. When trend Changes
2. When Bearish Engulfing Candle appears
###
No stop loss and take profit.
Heiken Ashi & Super TrendThis is one of my open source 1h strategies
It works on Binance: BTCUSDTPERP charts
This strategy involves two indicators
1. Heiken Ashi - a typical technical indicator to help highlight and clarify the current trend. This somehow allows the chart to ignore unnecessary fluctuations and make the trend more visible.
2.Super Trend - - One of the most common ATR-based indicators, the SuperTrend indicator is useful to help you catch big trends.
Buy entry conditions are as follows.
1. The Super Trend indicator running on the Heiken Ashi chart gives a buy signal.
2. Buy at the current market price and take profit at 1% of the normal k-line at this time.
Take profit
TP - 1%
Stop Loss
None
PowerX by jwitt98This strategy attempts to replicate the PowerX strategy as described in the book by by Markus Heitkoetter
Three indicators are used:
RSI (7) - An RSI above 50 indicates and uptrend. An RSI below 50 indicates a downtrend.
Slow Stochastics (14, 3, 3) - A %K above 50 indicates an uptrend. A %K below 50 indicates a downtrend.
MACD (12, 26, 9) - A MACD above the signal line indicates an uptrend. A MACD below the signal line indicates a downtrend
In addition, multiples of ADR (7) is used for setting the stops and profit targets
Setup:
When all 3 indicators are indicating an uptrend, the OHLC bar is green.
When all 3 indicators are indicating a downtrend, the OHLC bar is red.
When one or more indicators are conflicting, the OHLC bar is black
The basic rules are:
When the OHLC bar is green and the preceding bar is black or Red, enter a long stop-limit order .01 above the high of the first green bar
When the OHLC bar is red and the preceding bar is black or green, enter a short stop-limit order .01 below the low of the first red bar
If a red or black bar is encountered while in a long trade, or a green or black bar for a short trade, exit the trade at the close of that bar with a market order.
Stop losses are set by default at a multiple of 1.5 times the ADR.
Profit targets are set by default at a multiple of 3 times the ADR.
Options:
You can adjust the start and end dates for the trading range
You can configure this strategy for long only, short only, or both long and short.
You can adjust the multiples used to set the stop losses and profit targets.
There is an option to use a money management system very similar to the one described in the PowerX book. Some assumptions had to be made for cases where the equity is underwater as those cases are not clearly defined in the book. There is an option to override this behavior and keep the risk at or above the set point (2% by default), rather than further reduce the risk when equity is underwater. Position sizing is limited when using money management so as not to exceed the current strategy equity. The starting risk can be adjusted from the default of 2%.
Final notes: If you find any errors, have any questions, or have suggestions for improvements, please leave your message in the comments.
Happy trading!
AlphaTrend Strategy with Trailing SL %this is a modified version of AlphaTrend Strategy with added trailing Stop Loss
this is my first script that I have added to tradingview community
the trailing SL makes it very effective to lower the losses and can improve the overall return
Strategy Myth-Busting #3 - BB_BUY+SuperTrend - [MYN]This is part of a new series we are calling "Strategy Myth-Busting" where we take open public manual trading strategies and automate them. The goal is to not only validate the authenticity of the claims but to provide an automated version for traders who wish to trade autonomously.
Our third one we are automating is one of the strategies from "The Best 3 Buy And Sell Indicators on Tradingview + Confirmation Indicators ( The Golden Ones ))" from "Online Trading Signals (Scalping Channel)". No formal backtesting was done by them so wanted to validate their claims.
If you know of or have a strategy you want to see myth-busted or just have an idea for one, please feel free to message me.
This strategy uses a combination of 2 open-source public indicators:
BB_Buy and Sell by guikroth (default settings)
SuperTrend from TradingView's Technicals (default settings)
Trading Rules
15 min candles
Long
Long condition when BB_BUY indicates buy signal and SuperTrend is green
Short
Short condition when BB_BUY indicates Sell signal and SuperTrend is red
V Bottom & V Top Pattern [Misu]█ This indicator shows V bottom & V top patterns as well as potential V bottom & V top.
These V bottom & V top are chart powerful reversal patterns.
They appear in all markets and time-frames, but due to the nature of the aggressive moves that take place when a market reverses direction, it can be difficult to identify this pattern in real-time.
To address this problem, I added potential V pattern as well as the confirmed one.
█ Usages:
You can use V top & V bottoms for reversal zones.
You can use it for scalping strategies, as a main buy & sell signal.
Potential V patterns can be used to anticipate the market, in addition to volatility or momentum indicators, for example.
█ How it works?
This indicator uses pivot points to determine potential V patterns and confirm them.
Paramaters are available to filter breakouts of varying strengths.
Patterns also have a "max number bars" to be validated.
█ Why a Strategy type indicator?
Due to the many different parameters, this indicator is a strategy type.
This way you can overview the best settings depending on your pair & timeframe.
Parameters are available to filter.
█ Parameters:
Deviation: Parameter used to calculate parameters.
Depth: Parameter used to calculate parameters.
Confirmation Type: Type of signal used to confirme the pattern.
> Mid Pivot: pattern will confirm on mid pivot breakout.
> Opposit Pivot: pattern will confirm on opposit pivot breakout.
> No confirmation: no confirmation.
Lenght Avg Body: Lenght used to calculate the average body size.
First Breakout Factor: This factor multiplied by the "body avg" filters out the non-significant breakout of potential V pattern.
Confirmation Breakout Factor: This factor multiplied by the "body avg" filters out the non-significant breakout for the confirmation.
Max Bars Confirmation: The maximum number of bars needed to validate the pattern.
Bitfinex Shorts StratOverview
This strat applies the data from BITFINEX:USDSHORTS to the RSI indicator in order to provide SHORT/LONG entries as the number of contracts goes up and down. Although Bitfinex has lost relevance over the years its generally considered an exchange dominated by smart money rather than retail. I'd like to see if any insights can be gained by following their trading behaviour.
How to use
Select the underlying security you wish to trade and load the indicator. Select the appropriate short security by searching in the Bitfinex Short Symbol. RSI settings apply to short symbol not the actual asset. Strategy shorts the underlying asset when shorts rise and longs when they drop. The shorts symbol will follow the value of the loaded chart. Works best on 4 hour chart.
Why use shorts only rather than both long/shorts?
Bitfinex longs seem to be on a long-term uptrend accounting for 25x the number of shorts. Might be enormous confidence on part of the whales, but more likely reflects selling spot and buying perp. Given the size disparity and price action I don't think longs info is adding much.
Problems with script:
a) We don't really know the intentions of short players (e.g. speculation or hedging spot)
b) The script uses a decline in shorts as a long signal
c) RSI is a blunt tool there are probably better options for calculating high/lows in shorts
d) Shorts are accumulated both at highs and also when BTC price is already heavily trending down. This suggests some are speculative (at the highs) or protective/hedging during a decline
Takeaways:
Based on this strat Bitfinex whales are more wrong than right.
Results don't carry across well into altcoins using the accompanying short symbol. However, what is interesting is that applying the BITFINEX:BTCUSDSHORTS to altcoin charts does work pretty well.
Strat needs some refinement to control for entries under different circumstances.
Probably not a great idea to use this as a strategy in isolation, but highlights how Bitfinex whale behaviour is a good gauge to follow.
Monthly Returns of a Strategy in a ChartIt's a simple example of how you can present your strategy's monthly performance in a chart.
You maybe know that there is no support of these kind of charts in TradingView so this chart is actually a table object under the hood.
Table visual appearance is customizable, you can change:
Location
Bar Width / High
Colors
Thanks to @MUQWISHI for hard work, for helping me coding it.
It's not about the strategy itself but the way you display returns on your chart. So pls don't critique my choice of the strategy and its performance 🙂
Disclaimer
Please remember that past performance may not be indicative of future results.
Due to various factors, including changing market conditions, the strategy may no longer perform as well as in historical backtesting.
This post and the script don’t provide any financial advice.
Oscillating SSL Channel Strategy - 3m & 5m Time FramesThis script is pretty self-explanatory. I will suggest trying some different exits to get that win rate above 20% (I'd start with Take Profit and Stop Loss percentages).
Enjoy!
Trend Identifier StrategyTrend Identifier Strategy for 1D BTC.USD
The indicator smoothens a closely following moving average into a polynomial like plot and assumes 4 staged cycles based on the first and the second derivatives. This is an optimized strategy for long term buying and selling with a Sortino Ratio above 3. It is designed to be a more profitable alternative to HODLing. It can be combined with 'Accumulation/Distribution Bands & Signals' and 'Exponential Top and Bottom Finder'.