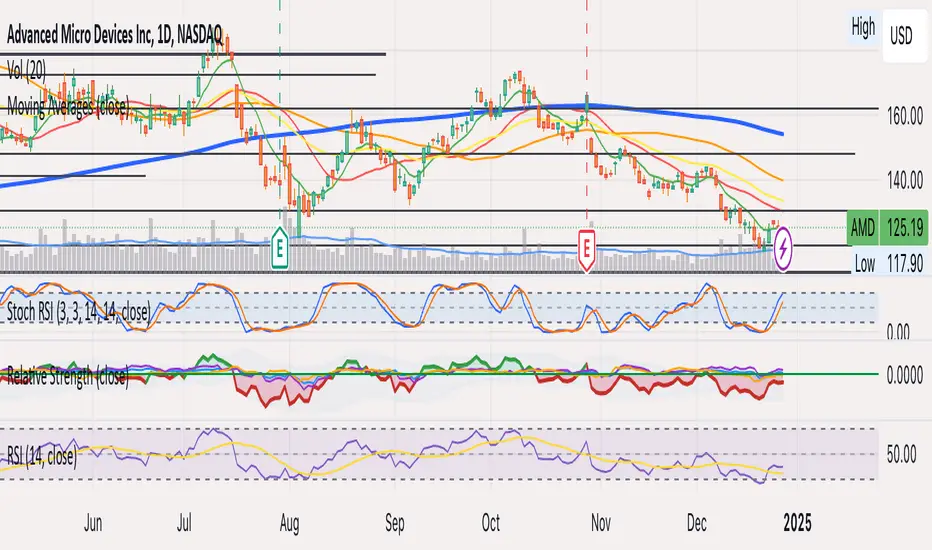
Steven Primo's bollinger bands strategyHi, this strategy is taken from a video made by Steven Primo. You can look it up on YouTube if you want to know about it.
It is a mean-reversion strategy based on the Bollinger Bands, in which we wait for 5 consecutive closes above the upper band, and for a short-term top. Once it happens, we place an entry order on this top, with a stop at the nearest bottom before the movement started, and use the difference from the stop and entry point to determine the target. For shorting, it's the same process, but for the downside. From my testing, only long orders were profitable, but you can configure whichever you want.
It works well for directional markets with a low level of noise, as you can see with the BTCUSD chart. One of its caveats is the short number of occurrences, and the long stop loss and target. You can enable a trailing stop, but from my testings, it just made the results worse.
I made some modifications, like removing the MA requirement, since the entry point was above it almost all the time, and I forced the BB to use a log version of the prices, so that discrepancies are eliminated. You'll also notice that you can't select an extension that is lower than 100, and that is intentional, since you're not supposed to enter a trade in which you can lose more than what you can earn.
I chose not to implement any kind of risk management, but I might do that in the future. You can leave your suggestions in the comments.
Analisis Trend
PB Trend ScalperA moving average strategy using a long period RMA and a short period EMA. It has a trailing stop loss based on the previous higher high or lower low. It also has a no trade band surrounding the RMA whose thickness can be changed.
Check out the settings to see what elements values can be changed.
The strategy is set to use the whole balance on each trade currently.
Leverage can be adjusted as well as take profit target as %.
The default values are set up for the 1 hour on BTCUSD.
These can be tweaked to suit any timeframe or market.
Nabz-BBMACD-2022-V1.1I have tried to make script which triggers indicators on combination of different feedback including Bollinger bands and MACD. Also used some of my logic by trial and error, It gave 744%+ profit on back-testing on coin RUNE/USDT from Jan 2021. It is my first script, I am happy to help the community. Please share your feedback.
Oversold RSI with tight SL Strategy (by Coinrule)This is one of the best strategies that can be used to get familiar with technical indicators and start to include them in your trading bot rules.
ENTRY
1. This trading system uses the RSI ( Relative Strength Index ) to anticipate good points to enter positions. RSI is a technical indicator frequently used in trading. It works by measuring the speed and change of price movements to determine whether a coin is oversold (indicating a good entry point) or overbought (indicating a point of exit/entry for a short position). The RSI oscillates between 0 and 100 and is traditionally considered overbought when over 70 and oversold when below 30.
2. To pick the right moment to buy, the strategy enters a trade when the RSI falls below 30 indicating the coin is oversold and primed for a trend reversal.
EXIT
The strategy then exits the position when the price appreciates 7% from the point of entry. The position also maintains a tight stop-loss and closes the position if the price depreciates 1% from the entry price. The idea behind this is to cut your losing trades fast and let your winners ride.
The best time frame for this strategy based on our backtesting data is the daily. Shorter time frames can also work well on certain coins, however in our experience, the daily works best. Feel free to experiment with this script and test it on a variety of your coins! With our backtesting data a trading fee of 0.1% is taken into account. The fee is aligned to the base fee applied on Binance, which is the largest cryptocurrency exchange by volume. In the example shown, this strategy made a handsome net profit of 39.31% on Chainlink with 61.54% of trades being profitable.
Three EMAs Trend-following Strategy (by Coinrule)Trend-following strategies are great because they give you the peace of mind that you're trading in line with the market.
However, by definition, you're always following. That means you're always a bit later than your want to be. The main challenges such strategies face are:
Confirming that there is a trend
Following the trend, hopefully, early enough to catch the majority of the move
Hopping off the trade when it seems to have run its course
This EMA Trend-following strategy attempts to address such challenges while allowing for a dynamic stop loss.
ENTRY
The trading system requires three crossovers on the same candle to confirm that a new trend is beginning:
Price crossing over EMA 7
Price crossing over EMA 14
Price crossing over EMA 21
The first benefit of using all three crossovers is to reduce false signals. The second benefit is that you know that a strong trend is likely to develop relatively soon, with the help of the fast setup of the three EMAs.
EXIT
The strategy comes with a fixed take profit and a volatility stop, which acts as a trailing stop to adapt to the trend's strength. That helps you get out of the way as soon as market conditions change. Depending on your long-term confidence in the asset, you can edit the fixed take profit to be more conservative or aggressive.
The position is closed when:
The price increases by 4%
The price crosses below the volatility stop.
The best time frame for this strategy based on our backtest is the 4-hr. Shorter timeframes can also work well, although they exhibit larger volatility in their returns. In general, this approach suits medium timeframes. A trading fee of 0.1% is taken into account. The fee is aligned to the base fee applied on Binance, which is the largest cryptocurrency exchange.
Solution Zigma - Fibonacci Impulse'Solution Zigma' is strategy for any securities because this strategy use EMA of Fibonacci Level and Plot Like candle easy for analysis trend impulse. This strategy used DMI(ADX) for filter sideway but not greatest indicator, Please use this strategy with Risk Management.
Swing Stock designed for Monthly/Yearly Trading This is a strategy tester designed around the most important data from FRED - Federal Reserve Economic Data
As input data, we have:
// Personal Consumption Expenditures
// Real Retail and Food Services Sales
// Leading Index for the United States
// All Employees: Total Nonfarm Payrolls
// Real Gross Domestic Product
// Gross Domestic Product
I adapted the long and short entry based on the GDP data, since they are most accurate in prediction compared to the rest.
However, feel free to test with other as well if you want.
For this test I compared previous GDP values, if they were higher than previous that represent a long signals, if they were smaller that represents a reversal=short signal.
From the tests performed we can see that GDP is highly accurate and overall as long as there is patience, profits are going to be make, sometimes even beat the index itself.
If you have any questions, let me know !
BTC WaveTrend R:R=1:1.5In this strategy, I used Wavetrend indicator (Lazy Bear).
It is very simple and easy to understanding: Long when Wavetrend1 crossover Wavetrend2 and they are less than a limit value (not buy when price overbought). Stoploss at lowest 3 bar previous. R:R = 1:1,5.
About other shortterm strategies for crypto market, you can view my published strategies.
Scalping The Bull - Two EMA StrategyName: Scalping The Bull - Two EMA "Gianno-Nano" Strategy from the Meeting
Category: Trend Follower
Operating mode: Spot or Future, only long or swing trading
Trades duration: Multiday
Timeframe: 4H
Suggested usage: Mid-term trading, when the market is in trend and it is showing high volatility.
Entry: When fast EMA crosses over slow EMA.
Exit: When fast EMA crosses under slow EMA then Exit Long or Entry Short (for reversal strategy).
Usage:
⁃ It can be useful to use alerts or web-hooks to automate this strategy.
⁃ This is a raw system that can be improved in different ways (e.g. Stop-loss, take-profit, position sizing) or studying more the behaviour of the coin.
Configuration:
- N/A
Backtesting
⁃ Exchange: BINANCE
⁃ Pair: NEOUSDT
⁃ Timeframe: 4H
⁃ Fee 0.075%
⁃ Slippage 0
- Start : 2017-12-03
How you or we can improve? Source code is open so share your ideas!
Fukuiz Octa-EMA + Ichimoku (Strategy)This strategy is based EMA of 8 different period and Ichimoku Cloud which works better in 1hr 4hr and daily time frame.
#A brief introduction to Ichimoku #
The Ichimoku Cloud is a collection of technical indicators that show support and resistance levels, as well as momentum and trend direction. It does this by taking multiple averages and plotting them on a chart. It also uses these figures to compute a “cloud” that attempts to forecast where the price may find support or resistance in the future.
#A brief introduction to EMA#
An exponential moving average ( EMA ) is a type of moving average (MA) that places a greater weight and significance on the most recent data points. The exponential moving average is also referred to as the exponentially weighted moving average . An exponentially weighted moving average reacts more significantly to recent price changes than a simple moving average ( SMA ), which applies an equal weight to all observations in the period.
#How to use#
The strategy will give entry points itself, you can monitor and take profit manually(recommended), or you can use the exit setup.
EMA (Color) = Bullish trend
EMA (Gray) = Bearish trend
#Condition#
Buy = All Ema (color) above the cloud.
SELL= All Ema turn to gray color.
stoch supertrd atr 200maThis strategy combines Supertrend, 200 EMA, Stochastic, and an ATR stop loss indicator. For buy conditions, the Stochastic has to be below the 20 level, price has to be above the 200 Ema and the Supertrend has to be green. For sell conditions, it has to be the opposite. the Stochastic has to be above the 80 level, price has to be below the 200 Ema and the Supertrend has to be red.
Weekly Returns with BenchmarkSome time ago I published Monthly returns table. Now It's time for weekly one.
To get it work you need a pretty big screen, but I hope it will be useful for some of you.
Features of this table includes:
Display weekly returns of your strategy, benchmark, and alpha over this benchmark.
Select benchmark to be another instrument
Select the date from which you want to compute monthly returns
Show/hide benchmark and alpha
Choose colors for gradient for gain/loss values
Use it with any type of strategy
Use it with replay
Thanks to @MUQWISHI to help me coding it.
It's not about the strategy itself but the way you display returns on your chart. So pls don't critique my choice of the strategy and its performance 🙂
Disclaimer
Please remember that past performance may not be indicative of future results.
Due to various factors, including changing market conditions, the strategy may no longer perform as well as in historical backtesting.
This post and the script don’t provide any financial advice.
CCI + EMA with RSI Cross StrategyThis strategy uses the CCI + 2 RSIs + 2 EMAs to generate trade signals. Trades are only taken during the normal trading session and all open trades are closed 15 min before the close of the current session. A trailing stop loss is used and is customizable.
Not trading advice, use at your own risk.
Triple Supertrend with EMA and ADX strategyPublishing a strategy that includes adx and ema filter as well
Entry: all three Supertrend turns positive. If a filter of ADX and EMA is applied, also check if ADX is above the selected level and close is above EMA
Exit: when the first supertrend turns negative
opposite for short entries
A FIlter is given to take or avoid re-enter on the same side. For example, After a long exit, if the entry condition is satisfied again for long before the short single is triggered it takes re-entry if selected.
Pivot Moving Average steteggythis Pivot Moving Average steteggy works best on a chart --->>Above 100$ crypto
Sniper is very profitable in terms of% good trades
It will perform very well on 1-5X Leverage (Solid leverage, not variable depending on the volume )
TP: 0.9 %
SL : 5.5 %
MA cross strategyI created an sma (10/30) strategy.
The script is under construction and can be changed, since i'm looking for a more profitable strategy.
If you have ideas to make it more profitable, please comment.
It is possible to change everything to your own needs.
Small short for CryptoThis is the third modification of VuMAnChu cipher B indicator designed only for short sales.
The trigger signal is called sommi bearish diamond (according to my due diligence it has the best performance)
You can either fix a stop loss value or close position after crossing sma line.
Take profit also can be tuned.
Keep in mind that short positions are very risky, so deposit your money to the market only after your research. I guess this indicator has potential for repainting, so track backtests/forward tests carefully. The script is for entertainment purposes only.
Good luck and have fun!
Follow The Ranging HullThis is a scalping strategy, trying to make quick points based on momentum and trend trading.
Entry Points are when either the range filter or the the following line changes colour. And the Hull is in that same direction.
--The Strategy Only enters on range filter entry point for now.
This Strategy has been tested on the NASDAQ 1 min, And works best with low timeframes.
Set the IsStrategy on the settings to true, to activate the strategy.
Make sure the Dates are correct .
Credits:
Hull Suite by InSilico www.tradingview.com
Range Filter Buy and Sell 5 min www.tradingview.com
Follow Line Indicator by Dreadblitz www.tradingview.com
Combo 2/20 EMA & Average True Range Reversed This is combo strategies for get a cumulative signal.
First strategy
This indicator plots 2/20 exponential moving average. For the Mov
Avg X 2/20 Indicator, the EMA bar will be painted when the Alert criteria is met.
Second strategy
Average True Range Trailing Stops Strategy, by Sylvain Vervoort
The related article is copyrighted material from Stocks & Commodities Jun 2009
Please, use it only for learning or paper trading. Do not for real trading.
WARNING:
- For purpose educate only
- This script to change bars colors.
SAR + 3SMMA with SL & TPThis script is a combination of SAR strategy and 3 Smoothed Moving Averages.
Strategy:
Takes SAR longs when all 3 SMMAs are rising. Take SAR short when all 3 SMMAs are falling.
Supports StopLoss and TakeProfit.
If you have found a profitable setup for it, please share in the comments or private chat.
TICK strategy for SPY optionsImportant notes:
1. This strategy is designed for same day SPY option scalping. All profit shown in back testing report is based on Profit/Loss (P/L) estimates from trading options with approximately 6 months of data. By default, it is set to 10 option contracts. By default the initial capital is set to $5000. Pyramiding is set to 3.
2. This strategy works better with non-extended market data.
3. This strategy is mainly developed for SPY trading on 5 min chart, it probably will not be very profitable with other tickers or time frame without tweaking all the parameters first.
4. This strategy will work with QQQ as well, but please adjust the profit multiplier to match the P/L of QQQ options.
How it works:
When trading the indices, many rely on the TICK for market directions. This strategy is a trend following strategy that uses a combination of conditions using the following indicators:
- TICK
- RSI
- VIX volatility index
- EMA
For entries, the conditions are:
1. TICK moving average crossover with a delayed signal line
2. Bullish or bearish RSI signal, RSI > 50 for bullish, < 50 for bearish
3. VIX must be above a certain threshold to take advantage of high market volatility
4. Price must be on top of EMA line for long, and below for short
For exits, there are 3 scenarios:
1. Stop loss set by a percentage of the daily ATR value
2. Trend changes on the TICK and the RSI
3. Bearish or bullish divergence on price with TICK
This strategy automatically signal to close all trades at 3:50 pm EST at the end of the day.
Extras:
- There is an option to show P/L for reinvesting profits
Enjoy~!!! Let's all make $$$
RSI, EMA, SMA Trendtrading - Oil Daytrading 1HThe Unitrend trading System produces trading recommendations on a pure Trend basis.
It is a Score based system.
--- How to use the System --
Simply adjust your capital you want to risk per trade and your TP Factor.
The TP Factor is the multiple of your risked Capital, also known as Risk/Reward ratio.
Furthermore you can toggle between a always Buy mode, to see if the System is better then market.
Compounding mode helps you to get a better understanding of your maximum drawdown with a total equity based approach.
--- How are Signals produced? ---
A score of 2 or 3 is a BUY signal.
You can count the score by looking at the lines above 1, or by reading the color.
Green is 3, yellow 2, orange 1 and red is 0.
The score is calculated by 3 conditions.
Each applying condition yields one point for the score.
The score resets each bar.
The rules are:
RSI > 45: Well known indicator, usually looks for reversal points but seems to produce above average results when above 45.
EMA(RSI) > SMA(RSI): My approach to momentum detection for the RSI movement, I consider a faster growing RSI as a good thing.
EMA(close) > SMA(close): My approach to trend detection for the market movement. Common Wisdom would be a fast SMA > slow SMA which I found to be too slow for the modern market.
Villa Dinamic Pivot Supertrend StrategyThis strategy works better on AUD/USD in the 15 min timeframe. It uses the Pivot Supertrend to enter trades based on different filters such as:
- Simple EMA filter: that the 3 EMAs should be in order
- DEMA angle: you can choose the DEMA Angle threshold and the look back to check the angle to just trade trades with DEMA at a certain angle
- Simple DEMA filter: just check if close is above or below DEMA
- Take Every Supertrend Signal: this means to take every normal supertrend signal to not just wait for a pivot supertrend signal to enter a trade (specially on long pivot supertrend periods)
- Stop Loss at Supertrend: this means that the stop loss will be at the Normal Supertrend, if false the stop loss will be placed at the ATR level selected.
- 2 Steps Take Profit: this means if you want to close a percentage of position as soon as the normal supertrend crosses the entry price, you can select the % on the "2 Steps TP qty" input
- Stop Loss ATR Multiplier: if Stop Loss at Supertrend is off this will be the stoploss based on the atr
- Take Profit ATR Multiplier: if Stop Loss at Supertrend is off this will be the takeprofit based on the atr (you have to keep in mind that the ratio between this two will make the Risk to reward ratio of the take profit when the Stop Loss at Supertrend)
- Testing: to avoid overfitting, you can select date ranges for backtesting and forwardtesting and select which testing you wanna do