SynchroTrend Oscillator (STO) [PhenLabs]📊 SynchroTrend Oscillator
Version: PineScript™ v5
📌 Description
The SynchroTrend Oscillator (STO) is a multi-timeframe synchronization tool that combines trend information from three distinct timeframes into a single, easy-to-interpret oscillator ranging from -100 to +100.
This indicator solves the common problem of having to analyze multiple timeframe charts separately by consolidating trend direction and strength across different time horizons. The STO helps traders identify when markets are truly synchronized across timeframes, potentially indicating stronger trend conditions and higher probability trading opportunities.
Using either Moving Average crossovers or RSI analysis as the trend definition metric, the STO provides a comprehensive view of market structure that adapts to various trading strategies and market conditions.
🚀 Points of Innovation
Triple-timeframe synchronization in a single view eliminates chart switching
Dual trend detection methods (MA vs Price or RSI) for flexibility across different markets
Dynamic color intensity that automatically increases with signal strength
Scaled oscillator format (-100 to +100) for intuitive trend strength interpretation
Customizable signal thresholds to match your risk tolerance and trading style
Visual alerts when markets reach full synchronization states
🔧 Core Components
Trend Scoring System: Calculates a binary score (+1, -1, or 0) for each timeframe based on selected metrics, providing clear trend direction
Multi-Timeframe Synchronization: Combines and scales trend scores from all three timeframes into a single oscillator
Dynamic Visualization: Adjusts color transparency based on signal strength, creating an intuitive visual guide
Threshold System: Provides customizable levels for identifying potentially significant trading opportunities
🔥 Key Features
Triple Timeframe Analysis: Synchronizes three user-defined timeframes (default: 60min, 15min, 5min) into one view
Dual Trend Detection Methods: Choose between Moving Average vs Price or RSI-based trend determination
Adjustable Signal Smoothing: Apply EMA, SMA, or no smoothing to the oscillator output for your preferred signal responsiveness
Dynamic Color Intensity: Colors become more vibrant as signal strength increases, helping identify strongest setups
Customizable Thresholds: Set your own buy/sell threshold levels to match your trading strategy
Comprehensive Alerts: Six different alert conditions for crossing thresholds, zero line, and full synchronization states
🎨 Visualization
Oscillator Line: The main line showing the synchronized trend value from -100 to +100
Dynamic Fill: Area between oscillator and zero line changes transparency based on signal strength
Threshold Lines: Optional dotted lines indicating buy/sell thresholds for visual reference
Color Coding: Green for bullish synchronization, red for bearish synchronization
📖 Usage Guidelines
Timeframe Settings
Timeframe 1: Default: 60 (1 hour) - Primary higher timeframe for trend definition
Timeframe 2: Default: 15 (15 minutes) - Intermediate timeframe for trend definition
Timeframe 3: Default: 5 (5 minutes) - Lower timeframe for trend definition
Trend Calculation Settings
Trend Definition Metric: Default: “MA vs Price” - Method used to determine trend on each timeframe
MA Type: Default: EMA - Moving Average type when using MA vs Price method
MA Length: Default: 21 - Moving Average period when using MA vs Price method
RSI Length: Default: 14 - RSI period when using RSI method
RSI Source: Default: close - Price data source for RSI calculation
Oscillator Settings
Smoothing Type: Default: SMA - Applies smoothing to the final oscillator
Smoothing Length: Default: 5 - Period for the smoothing function
Visual & Threshold Settings
Up/Down Colors: Customize colors for bullish and bearish signals
Transparency Range: Control how transparency changes with signal strength
Line Width: Adjust oscillator line thickness
Buy/Sell Thresholds: Set levels for potential entry/exit signals
✅ Best Use Cases
Trend confirmation across multiple timeframes
Finding high-probability entry points when all timeframes align
Early detection of potential trend reversals
Filtering trade signals from other indicators
Market structure analysis
Identifying potential divergences between timeframes
⚠️ Limitations
Like all indicators, can produce false signals during choppy or ranging markets
Works best in trending market conditions
Should not be used in isolation for trading decisions
Past performance is not indicative of future results
May require different settings for different markets or instruments
💡 What Makes This Unique
Combines three timeframes in a single visualization without requiring multiple chart windows
Dynamic transparency feature that automatically emphasizes stronger signals
Flexible trend definition methods suitable for different market conditions
Visual system that makes multi-timeframe analysis intuitive and accessible
🔬 How It Works
1. Trend Evaluation:
For each timeframe, the indicator calculates a trend score (+1, -1, or 0) using either:
MA vs Price: Comparing close price to a moving average
RSI: Determining if RSI is above or below 50
2. Score Aggregation:
The three trend scores are combined and then scaled to a range of -100 to +100
A value of +100 indicates all timeframes show bullish conditions
A value of -100 indicates all timeframes show bearish conditions
Values in between indicate varying degrees of alignment
3. Signal Processing:
The raw oscillator value can be smoothed using EMA, SMA, or left unsmoothed
The final value determines line color, fill color, and transparency settings
Threshold levels are applied to identify potential trading opportunities
💡 Note:
The SynchroTrend Oscillator is most effective when used as part of a comprehensive trading strategy that includes proper risk management techniques. For best results, consider using the oscillator in conjunction with support/resistance levels, price action analysis, and other complementary indicators that align with your trading style.
Trendcontinuation

Moving Average Pullback Signals [UAlgo]The "Moving Average Pullback Signals " indicator is designed to identify potential trend continuation or reversal points based on moving average (MA) pullback patterns. This tool combines multiple types of moving averages, customized trend validation parameters, and candlestick wick patterns to provide reliable buy and sell signals. By leveraging several advanced MA methods (such as TEMA, DEMA, ZLSMA, and McGinley-D), this script can adapt to different market conditions, providing traders with flexibility and more precise trend-based entries and exits. The addition of a gradient color-coded moving average line and wick validation logic enables traders to visualize market sentiment and trend strength dynamically.
🔶 Key Features
Multiple Moving Average (MA) Calculation Methods: This indicator offers various MA calculation types, including SMA, EMA, DEMA, TEMA, ZLSMA, and McGinley-D, allowing traders to select the MA that best fits their strategy.
Trend Validation and Pattern Recognition: The indicator includes a customizable trend validation length, ensuring that the trend is consistent before buy/sell signals are generated. The "Trend Pattern Mode" setting provides flexibility between "No Trend in Progress," "Trend Continuation," and "Both," tailoring signals to the trader’s preferred style.
Wick Validation Logic: To enhance the accuracy of entries, this indicator identifies specific wick patterns for bullish or bearish pullbacks, which signal potential trend continuation or reversal. Wick length and validation factor are adjustable to suit various market conditions and timeframes.
Gradient Color-coded MA Line: This feature provides a quick visual cue for trend strength, with color changes reflecting relative highs and lows of the MA, enhancing market sentiment interpretation.
Alerts for Buy and Sell Signals: Alerts are triggered when either a bullish or bearish pullback is detected, allowing traders to receive instant notifications without continuously monitoring the chart.
Visual Labels for Reversal Points: The indicator plots labels ("R") at potential reversal points, with color-coded labels for bullish (green) and bearish (red) pullbacks, highlighting pullback opportunities that align with the trend or reversal potential.
🔶 Disclaimer
Use with Caution: This indicator is provided for educational and informational purposes only and should not be considered as financial advice. Users should exercise caution and perform their own analysis before making trading decisions based on the indicator's signals.
Not Financial Advice: The information provided by this indicator does not constitute financial advice, and the creator (UAlgo) shall not be held responsible for any trading losses incurred as a result of using this indicator.
Backtesting Recommended: Traders are encouraged to backtest the indicator thoroughly on historical data before using it in live trading to assess its performance and suitability for their trading strategies.
Risk Management: Trading involves inherent risks, and users should implement proper risk management strategies, including but not limited to stop-loss orders and position sizing, to mitigate potential losses.
No Guarantees: The accuracy and reliability of the indicator's signals cannot be guaranteed, as they are based on historical price data and past performance may not be indicative of future results.

Internal/External Market Structure [UAlgo]The "Internal/External Market Structure " indicator is a tool designed to identify and visualize internal and external market structure based on swing highs and lows. It helps traders understand short-term (internal) and long-term (external) price behavior.
🔶 What are ChoCH and BoS?
Change of Character (ChoCH)
Change of character refers to the reversal of market trend either from bullish to bearish or bearish to bullish. ChoCH is also a break of market structure but in opposite direction.
If market is in bullish trend but it breaks it previous (higher) low and makes a lower low, it will be termed a “bearish change of character” as price changed its trend from bullish to bearish.
Like wise if price is in bearish trend and it breaks its previous (lower) high making a higher high it will be marked as “bullish change of character” as price changed its trend from bearish to bullish.
Break of Structure (BoS)
When price breaks its structure in direction of previous trend its called break of structure (BoS). So its a trend continuation pattern.
As you know in bullish trend price makes higher highs. Each time when price break a previous high and marks a new high its known as bullish break of structure.
But in bearish trend price makes lower lows so every time when price breaks previous low and makes a new low it is called as bearish break of structure.
🔶 Key Features
Internal Swing Length: Allowing for fine-tuning of sensitivity to smaller, more frequent market movements.
External Swing Length: Focusing on capturing broader market trends.
The indicator differentiates between internal and external market structures, using different styles and colors to represent each. Internal structures are shown with solid lines, while external structures use dashed lines, providing clear visual cues.
Internal Market Structure:
The internal market structure focuses on shorter-term swings and is useful for identifying minor trend changes and short-term price movements. Breaks of internal swing highs or lows can indicate potential changes in the market's direction or momentum. The labels "CHoCH" and "BoS" help distinguish between changes in character and break of structure events, respectively.
External Market Structure:
The external market structure captures larger, more significant market moves. It is particularly useful for identifying major trend changes and key support and resistance levels. The dashed lines and corresponding labels "CHoCH+" and "BoS+" indicate more substantial shifts in market sentiment.
For BoS (Break of Structure):
For ChoCH (Change of Character):
🔶 Disclaimer
Use with Caution: This indicator is provided for educational and informational purposes only and should not be considered as financial advice. Users should exercise caution and perform their own analysis before making trading decisions based on the indicator's signals.
Not Financial Advice: The information provided by this indicator does not constitute financial advice, and the creator (UAlgo) shall not be held responsible for any trading losses incurred as a result of using this indicator.
Backtesting Recommended: Traders are encouraged to backtest the indicator thoroughly on historical data before using it in live trading to assess its performance and suitability for their trading strategies.
Risk Management: Trading involves inherent risks, and users should implement proper risk management strategies, including but not limited to stop-loss orders and position sizing, to mitigate potential losses.
No Guarantees: The accuracy and reliability of the indicator's signals cannot be guaranteed, as they are based on historical price data and past performance may not be indicative of future results.

Multiple Divergences [UAlgo]🔶 Description:
"Multiple Divergences " is providing insights into potential divergences across multiple indicators. Divergence, a concept in technical analysis, occurs when the price of an asset diverges from the direction of an accompanying indicator, suggesting a possible reversal or continuation in the price trend.
🔶 Key Features:
Customizable Divergence Settings: Users can adjust parameters such as the minimum number of divergences required to display labels, pivot lookback periods, and plot options for various types of divergences (regular or hidden) and bullish/bearish labels.
Multiple Technical Indicators: The script supports a wide range of popular indicators, including MACD, RSI, Stochastic, CCI, Momentum, OBV, DMI Oscillator, VWmacd, Chaikin Money Flow, Money Flow Index, and Awesome Oscillator. You can choose any of the above-mentioned technical indicators for which you want to capture divergences.
🔶 Purpose of Using Multiple Technical Indicators
In the complex and volatile world of trading, relying on a single indicator can provide an incomplete or misleading picture of market conditions. Different technical indicators analyze various aspects of price movement, volume, and momentum, offering unique insights that can complement each other. By utilizing multiple indicators, traders can cross-verify signals, reduce false positives, and increase the reliability of their trading decisions.
Identifying divergences across multiple indicators further enhances this reliability, as a divergence spotted in several indicators simultaneously is a stronger signal than one found in isolation. This comprehensive approach helps traders to anticipate potential market turning points with greater confidence and precision.
By integrating multiple technical indicators and meticulously tracking their divergences, this script aims traders with a robust tool for navigating the complexities of financial markets.
🔶 How to Obtain Divergences
Regular Bullish Divergence:
This occurs when the price makes a new lower low compared to a previous pivot low, indicating a downward trend. Simultaneously, the selected oscillator makes a higher low compared to its previous pivot low, indicating a potential upward momentum. This divergence suggests that, despite the falling price, the underlying momentum is strengthening, potentially signaling a reversal to an upward trend.
Regular Bearish Divergence:
This happens when the price makes a new higher high compared to a previous pivot high, indicating an upward trend. Concurrently, the selected oscillator makes a lower high compared to its previous pivot high, indicating weakening momentum. This divergence suggests that, despite the rising price, the underlying momentum is weakening, potentially signaling a reversal to a downward trend.
Example for Regular Bullish and Regular Bearish Divergences (Minimum Divergenes Count to Display = 3, All Selected):
Hidden Bullish Divergence:
Hidden bullish divergence is observed when the price makes a higher low compared to a previous pivot low, indicating an upward trend. At the same time, the oscillator makes a lower low compared to its previous pivot low, indicating a potential strengthening momentum. This condition suggests that the underlying strength of the upward trend is intact, despite the oscillator indicating otherwise.
Hidden Bearish Divergence:
This occurs when the price makes a lower high compared to a previous pivot high, indicating a downward trend. Simultaneously, the oscillator makes a higher high compared to its previous pivot high, indicating a potential weakening momentum. This divergence suggests that the underlying weakness of the downward trend is intact, despite the oscillator indicating otherwise.
Divergence Labeling: The script dynamically generates labels on the chart to visually highlight detected divergences based on user-defined criteria. (E.g. "5 Regular Bullish Divs." , "1 Hidden Bearish Div")
🔶 Disclaimer:
Use with Caution: This indicator is provided for educational and informational purposes only and should not be considered as financial advice. Users should exercise caution and perform their own analysis before making trading decisions based on the indicator's signals.
Not Financial Advice: The information provided by this indicator does not constitute financial advice, and the creator (UAlgo) shall not be held responsible for any trading losses incurred as a result of using this indicator.
Backtesting Recommended: Traders are encouraged to backtest the indicator thoroughly on historical data before using it in live trading to assess its performance and suitability for their trading strategies.
Risk Management: Trading involves inherent risks, and users should implement proper risk management strategies, including but not limited to stop-loss orders and position sizing, to mitigate potential losses.
No Guarantees: The accuracy and reliability of the indicator's signals cannot be guaranteed, as they are based on historical price data and past performance may not be indicative of future results.

IsAlgo - Reverse Candle Strategy► Overview:
The Reverse Candle Strategy leverages a customizable moving average to identify the start of a trend. It utilizes the highest and lowest prices to define the trend and its corrections, executing trades based on custom candlestick patterns to capitalize on the main trend's continuation.
► Description:
The Reverse Candle Strategy is designed to effectively identify and trade market trends by combining moving averages and custom candlestick patterns. The core of the strategy is a single, customizable moving average, which helps determine the trend direction. When the market price crosses above the moving average, this signifies the beginning of an uptrend. The strategy then tracks the highest price reached during the uptrend and waits for a correction. A specific custom candlestick pattern signals the end of the correction, at which point the strategy executes a long trade.
In the case of a downtrend, the market price crossing below the moving average marks the trend’s start. The strategy monitors the lowest price during the downtrend and awaits a correction. The end of this correction is identified by another custom candlestick pattern, prompting the strategy to execute a short trade. This combination of a moving average with precise candlestick patterns ensures that trades are made at optimal moments, improving the likelihood of successful trades.
The integration of the moving average and candlestick patterns is critical. The moving average smooths out price data to highlight the trend direction, while the custom candlestick patterns provide specific entry signals after a correction, ensuring the trend’s resumption is genuine. This synergy enhances the strategy’s ability to filter out false signals and improve trade accuracy.
↑ Long Entry Example:
When the price is moving above the moving average and the highest price has been detected, the strategy will wait for the entry candle to execute the long trade.
↓ Short Entry Example:
When the price is moving below the moving average and the lowest price has been detected, the strategy will wait for the entry candle to execute the short trade.
✕ Exit Conditions:
To manage risk effectively, the strategy provides multiple stop-loss options. Traders can set stop-loss levels using fixed pips, ATR-based calculations, or the higher/lower price of past candles. Additionally, trades can be closed if a candle moves against the trade direction. Up to three take-profit levels can be set using fixed pips, ATR, or risk-to-reward ratios, allowing traders to secure profits at different stages. The trailing stop feature adjusts the stop loss as the trade moves into profit, locking in gains while allowing for continued potential upside. Furthermore, a break-even feature moves the stop loss to the entry price once a certain profit level is reached, protecting against losses. Trades can also be closed when the price crosses the moving average.
► Features & Settings:
⚙︎ Moving Average: Users can choose between various types of moving averages (e.g., SMA, EMA) to confirm the trend direction.
⚙︎ Trend & Corrections: Set minimum and maximum pips for trends and corrections, with an option to define correction percentages relative to the trend.
⚙︎ Entry Candle: Define the entry candle by specifying the minimum and maximum size of the candle's body and the ratio of the body to the entire candle size, ensuring significant breakouts trigger trades.
⚙︎ Trading Session: This feature allows users to define specific trading hours during which the strategy should operate, ensuring trades are executed only during preferred market periods.
⚙︎ Trading Days: Users can specify which days the strategy should be active, offering the flexibility to avoid trading on specific days of the week.
⚙︎ Backtesting: Enables a backtesting period during which the strategy can be tested over a selected start and end date. This feature can be deactivated if not needed.
⚙︎ Trades: Configure trade direction (long, short, or both), position sizing (fixed or percentage-based), maximum number of open trades, and daily trade limits.
⚙︎ Trades Exit: Various exit methods, such as setting profit or loss limits, trade duration, or closing trades on moving average crossings.
⚙︎ Stop Loss: Various stop-loss methods are available, including a fixed number of pips, ATR-based, or using the highest or lowest price points within a specified number of previous candles. Additionally, trades can be closed after a specific number of candles move in the opposite direction of the trade.
⚙︎ Break Even: This feature adjusts the stop loss to a break-even point once certain conditions are met, such as reaching predefined profit levels, to protect gains.
⚙︎ Trailing Stop: The trailing stop feature adjusts the stop loss as the trade moves into profit, securing gains while potentially capturing further upside.
⚙︎ Take Profit: up to three take-profit levels using fixed pips, ATR, or risk-to-reward ratios based on the stop loss. Alternatively, specify a set number of candles moving in the trade direction.
⚙︎ Alerts: The strategy includes a comprehensive alert system that informs the user of all significant actions, such as trade openings and closings. It supports placeholders for dynamic values like take-profit levels and stop-loss prices.
⚙︎ Dashboard: Visual display providing detailed information about ongoing and past trades on the chart, helping users monitor performance and make informed decisions.
► Backtesting Details:
Timeframe: 30-minute NAS100 chart
Initial Balance: $10,000
Order Size: 5 Units
Commission: $0.5 per contract
Slippage: 5 ticks
Stop Loss: MA Crossing or by break even

U-Oscillator Pro [UAlgo]The U-Oscillator Pro is a comprehensive technical analysis tool designed to assist traders in making informed decisions in financial markets. This indicator integrates various features including oscillator, bands, trend clouds divergences, and confluence signals to provide a comprehensive view of market dynamics.
🔶 Oscillator :
U-Oscillator uses an amalgamation of price, momentum, and volatility elements to provide a comprehensive market view. It provides a common output about the market and is easy to use.
Oscillator Features :
Customizable Oscillator Length : This parameter sets the length of the oscillator.
Use Machine Learning On Oscillator Calculation : By evaluating the output of the oscillator, this data set calculates a weighted average of the data set by taking each point with a certain weight and using these weights. This is often used in situations where some data points are more important or need to have more impact than others. A weight for each point that the oscillator calculates may represent the importance or impact of that point. By including all these calculations in the oscillator, it provides a result.
Reversal Signals : Determines whether to display reversal signals on the chart. When set to true, it enables the plotting of reversal signals based on certain conditions for both long (buy) and short (sell) signals. These signals can be interpreted as "potential" turning points of the market. Signals are represented by small shapes on the chart, with green indicating short (sell) signals and red indicating long (buy) signals.
🔶 Extreme Bands:
These regions can be described as the possible reversal regions of the price and obtained by deviations of oscillator values.
Extreme Bands Features:
Band Length : Determines the length of the bands.
Show Extreme Bands : Option to display the extreme bands.
Show Middle Line : Option to show the middle line.
Transparency Mode : Adjust the transparency level of the bands.
It would not be wrong to consider it as potential overbought and oversold regions.
Example:
🔶 Divergences :
The divergence calculation in this script identifies potential reversals by analyzing pivot points in the oscillator. Here's how it works:
Divergence Features :
Pivot Length: The user specifies the length of the divergence calculation (pivotLength), which determines the number of bars to consider for pivot analysis.
Pivot Identification: The script searches for pivot highs and lows within the specified length. These pivots indicate potential turning points in the oscillator.
Divergence Conditions: Different conditions are evaluated based on the identified pivots to determine the presence of bullish or bearish divergences:
Regular Bullish Divergence: Occurs when the oscillator makes a lower low while the price makes a higher low.
Hidden Bullish Divergence: Occurs when the oscillator makes a higher low while the price makes a lower low.
Regular Bearish Divergence: Occurs when the oscillator makes a higher high while the price makes a lower high.
Hidden Bearish Divergence: Occurs when the oscillator makes a lower high while the price makes a higher high.
Visualization: Detected divergences are plotted on the chart using shapes and lines, indicating potential reversal points. Users can choose which types of divergences to display using input options.
🔶 Trend Cloud :
This section can provide information about the long-term direction of the price and the current status of the trend. The increase in the visibility of the cloud can provide information about the strength of the trend.
Trend Cloud Features :
Show Trend Cloud: This setting allows you to choose whether the trend cloud is displayed on the chart or not.
Fast Trend Cloud Mode: This feature can be used to provide information about the cloud's shorter-term trend and its strength.
Classic Mode of Trend Cloud :
Fast Mode of Trend Cloud :
🔶 Confluence :
This section of the script aims to identify potential reversal confluences based on the deviation between the price and a combination of oscillator values. The confluence signals are categorized into light and heavy, representing different levels of potential reversal strength.
Confluence Features :
Show Light/Heavy Reversal Confluences: This setting allows users to control the visibility of the confluence signals on the chart.
Confluence Term: Users can select the term for calculating the confluence, which in turn affects the sensitivity of the confluence signals. The available options are Short, Medium, and Long.
Confluence Signal Conditions:
Light Bearish Reversal Confluence: This type of confluence occurs when there is a moderate deviation between the price and the oscillator values, indicating a potential shift towards a bearish reversal in the market sentiment.
Heavy Bearish Reversal Confluence: In contrast, a heavy bearish reversal confluence signifies a significant deviation between the price and the oscillator values, suggesting a strong indication of a bearish reversal in the market sentiment.
Light Bullish Reversal Confluence: Similar to light bearish reversal confluence, light bullish reversal confluence occurs with a moderate deviation between the price andthe oscillator values, indicating a potential shift towards a bullish reversal in the market sentiment.
Heavy Bullish Reversal Confluence: On the other hand, heavy bullish reversal confluence indicates a substantial deviation between the price andthe oscillator values, suggesting a strong indication of a bullish reversal in the market sentiment.
Plotting Confluence Signals: Shapes (triangles) are plotted on the chart to indicate the presence of confluence signals. Red triangles denote bearish signals, while green triangles denote bullish signals.
This confluence analysis provides traders with additional insights into potential reversal points or helping them make more informed trading decisions.
Example For Confluence :
🔶 Disclaimer:
Use with Caution: This indicator is provided for educational and informational purposes only and should not be considered as financial advice. Users should exercise caution and perform their own analysis before making trading decisions based on the indicator's signals.
Not Financial Advice: The information provided by this indicator does not constitute financial advice, and the creator (UAlgo) shall not be held responsible for any trading losses incurred as a result of using this indicator.
Backtesting Recommended: Traders are encouraged to backtest the indicator thoroughly on historical data before using it in live trading to assess its performance and suitability for their trading strategies.
Risk Management: Trading involves inherent risks, and users should implement proper risk management strategies, including but not limited to stop-loss orders and position sizing, to mitigate potential losses.
No Guarantees: The accuracy and reliability of the indicator's signals cannot be guaranteed, as they are based on historical price data and past performance may not be indicative of future results.

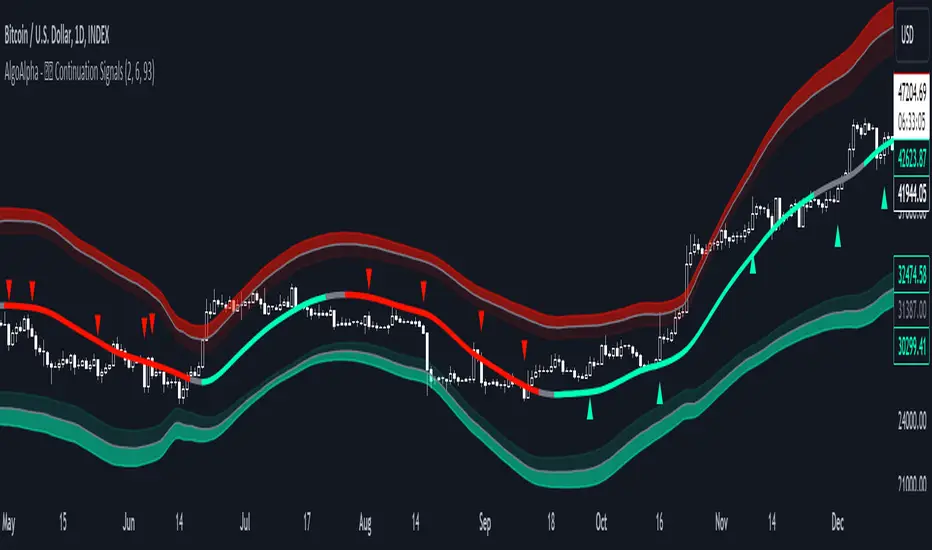
Trend Continuation Signals [AlgoAlpha]Introducing the Trend Continuation Signals by AlgoAlpha 🌟🚀
Elevate your trading game with this multipurpose indicator, designed to pinpoint trend continuation opportunities as well as highlight volatility and oversold/overbought conditions. Whether you're a trading novice or a seasoned market veteran, this tool offers intuitive visual cues to boost your decision-making and enhance your market analysis. Let's explore the key features, how to use it effectively, and delve into the operational mechanics that make this tool a game-changer in your trading arsenal:
Key Features:
🔥 Advanced Trend Detection : Leverages the Hull Moving Average (HMA) for superior trend tracking as compared to other MAs, offering unique insights into market momentum.
🌈 Volatility Bands : Implements adjustable bands around the trend line, which evolve with market conditions to highlight potential trading opportunities.
⚡ Trend Continuation Signals : Identifies bullish and bearish continuation signals, equipping you with actionable signals to exploit the prevailing market trend.
🎨 Intuitive Color Coding : Employs a vibrant color scheme to distinguish between uptrends, downtrends, and neutral phases, facilitating easy interpretation of the indicator's insights.
🛠 How to Use "Trend Continuation Signals ":
🔍 Setting Up : Incorporate the indicator onto your chart and customize the indicator to suite your preferences.
👀 Reading the Signals : Pay attention to the color-coded trend lines and volatility bands. Green indicates an uptrend, red signifies a downtrend, and gray denotes a neutral market condition.
📈 Identifying Entry Points : Look for bullish (▲) and bearish (▼) continuation icons below or above the price bars as signals for potential entry points for long or short positions, respectively.
🔄 Confirmation : Validate your trades with further analysis or other indicators. The Trend Continuation Signals are most effective when complemented by other technical analysis tools or fundamental insights.
📉 Risk Management : Implement stop-loss orders in line with your risk appetite and adjust them based on the volatility bands provided by the indicator to safeguard your investments.
How It Operates:
The essence of the indicator is captured through the hull moving averages for both the primary and secondary lines, set at periods of 93 and 50, respectively, to reflect market trends and pullbacks that trigger the continuation signals every time price recovers from a detected pullback.
Volatility is quantified through the standard deviation of the midline, magnified by a factor, establishing the upper and lower trend band boundaries.
Further volatility bands are plotted around the main volatility band, providing a granular view of market volatility and potential breakout or breakdown zones.
Market trend direction is determined by comparing the HMA line's current position to its previous value, enhanced by the secondary line to identify continuation patterns.
Embrace the power of the Trend Continuation Signals to enhance your trading strategy! It is important to note that all indicators are best used in confluence with other forms of analysis, happy trading! 📊💥
Predictive Trend and Structure (Expo)█ Overview
The Predictive Trend and Structure indicator is designed for traders seeking to identify future trend directions and interruptions in trend continuation. This indicator is unique because it employs standard deviation to predict upcoming trend directions and potential trend continuation levels. This enables traders to stay ahead of the market.
█ How It Works
This indicator primarily functions based on the calculated standard deviation of the trend over a specified period. It evaluates the trend direction by comparing the current trend value to its previous one and scales the standard deviation, allowing for adjustments in sensitivity to price fluctuations.
█ How to Use
Trend
You can easily identify when a future trend begins by observing where the trend level is displayed. If the price breaks above and remains above the trend, it indicates a bullish trend. Conversely, if the price breaks below and stays below, it signifies a bearish trend.
Support and Resistance
With the Predictive Structure enabled, the indicator aids in identifying potential support and resistance levels.
Trend Continuation Break
Trend continuation breaks occur when prices breaks support or resistance, indicating the existing trend may persist. The indicator plots these levels in advance, allowing traders to quickly identify where trend continuation might occur.
█ Settings
Period for Std Dev: Determines the number of periods used for the standard deviation calculation, impacting the indicator's sensitivity to price changes.
Standard Deviation Scaler: Scales the computed standard deviation, affecting the deviations needed to confirm trends and the indicator's focus on significant trend changes.
Predictive Structure: Enables or disables the prediction of market structures like potential levels of structure breaks/trend continuation breaks.
-----------------
Disclaimer
The information contained in my Scripts/Indicators/Ideas/Algos/Systems does not constitute financial advice or a solicitation to buy or sell any securities of any type. I will not accept liability for any loss or damage, including without limitation any loss of profit, which may arise directly or indirectly from the use of or reliance on such information.
All investments involve risk, and the past performance of a security, industry, sector, market, financial product, trading strategy, backtest, or individual's trading does not guarantee future results or returns. Investors are fully responsible for any investment decisions they make. Such decisions should be based solely on an evaluation of their financial circumstances, investment objectives, risk tolerance, and liquidity needs.
My Scripts/Indicators/Ideas/Algos/Systems are only for educational purposes!

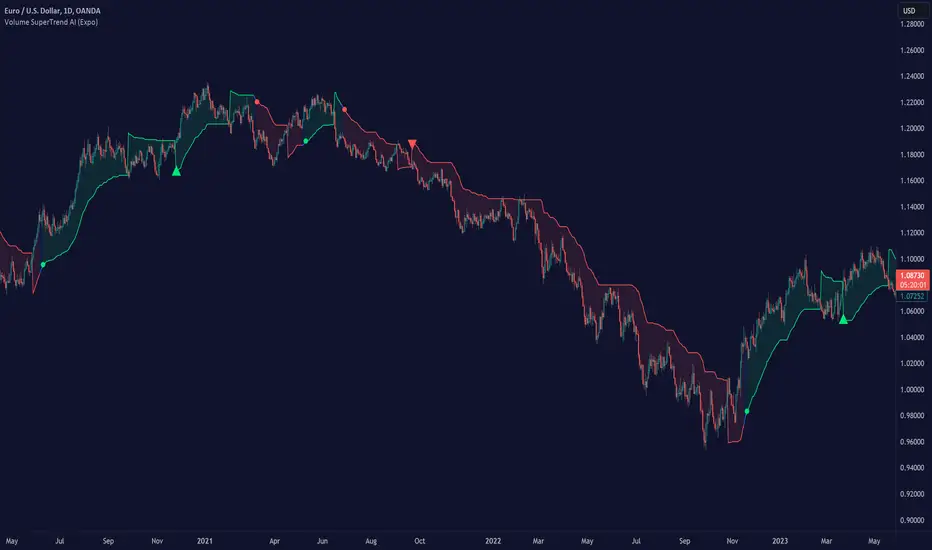
Volume SuperTrend AI (Expo)█ Overview
The Volume SuperTrend AI is an advanced technical indicator used to predict trends in price movements by utilizing a combination of traditional SuperTrend calculation and AI techniques, particularly the k-nearest neighbors (KNN) algorithm.
The Volume SuperTrend AI is designed to provide traders with insights into potential market trends, using both volume-weighted moving averages (VWMA) and the k-nearest neighbors (KNN) algorithm. By combining these approaches, the indicator aims to offer more precise predictions of price trends, offering bullish and bearish signals.
█ How It Works
Volume Analysis: By utilizing volume-weighted moving averages (VWMA), the Volume SuperTrend AI emphasizes the importance of trading volume in the trend direction, allowing it to respond more accurately to market dynamics.
Artificial Intelligence Integration - k-Nearest Neighbors (k-NN) Algorithm: The k-NN algorithm is employed to intelligently examine historical data points, measuring distances between current parameters and previous data. The nearest neighbors are utilized to create predictive modeling, thus adapting to intricate market patterns.
█ How to use
Trend Identification
The Volume SuperTrend AI indicator considers not only price movement but also trading volume, introducing an extra dimension to trend analysis. By integrating volume data, the indicator offers a more nuanced and robust understanding of market trends. When trends are supported by high trading volumes, they tend to be more stable and reliable. In practice, a green line displayed beneath the price typically suggests an upward trend, reflecting a bullish market sentiment. Conversely, a red line positioned above the price signals a downward trend, indicative of bearish conditions.
Trend Continuation signals
The AI algorithm is the fundamental component in the coloring of the Volume SuperTrend. This integration serves as a means of predicting the trend while preserving the inherent characteristics of the SuperTrend. By maintaining these essential features, the AI-enhanced Volume SuperTrend allows traders to more accurately identify and capitalize on trend continuation signals.
TrailingStop
The Volume SuperTrend AI indicator serves as a dynamic trailing stop loss, adjusting with both price movement and trading volume. This approach protects profits while allowing the trade room to grow, taking into account volume for a more nuanced response to market changes.
█ Settings
AI Settings:
Neighbors (k):
This setting controls the number of nearest neighbors to consider in the k-Nearest Neighbors (k-NN) algorithm. By adjusting this parameter, you can directly influence the sensitivity of the model to local fluctuations in the data. A lower value of k may lead to predictions that closely follow short-term trends but may be prone to noise. A higher value of k can provide more stable predictions, considering the broader context of market trends, but might lag in responsiveness.
Data (n):
This setting refers to the number of data points to consider in the model. It allows the user to define the size of the dataset that will be analyzed. A larger value of n may provide more comprehensive insights by considering a wider historical context but can increase computational complexity. A smaller value of n focuses on more recent data, possibly providing quicker insights but might overlook longer-term trends.
AI Trend Settings:
Price Trend & Prediction Trend:
These settings allow you to adjust the lengths of the weighted moving averages that are used to calculate both the price trend and the prediction trend. Shorter lengths make the trends more responsive to recent price changes, capturing quick market movements. Longer lengths smooth out the trends, filtering out noise, and highlighting more persistent market directions.
AI Trend Signals:
This toggle option enables or disables the trend signals generated by the AI. Activating this function may assist traders in identifying key trend shifts and opportunities for entry or exit. Disabling it may be preferred when focusing on other aspects of the analysis.
Super Trend Settings:
Length:
This setting determines the length of the SuperTrend, affecting how it reacts to price changes. A shorter length will produce a more sensitive SuperTrend, reacting quickly to price fluctuations. A longer length will create a smoother SuperTrend, reducing false alarms but potentially lagging behind real market changes.
Factor:
This parameter is the multiplier for the Average True Range (ATR) in SuperTrend calculation. By adjusting the factor, you can control the distance of the SuperTrend from the price. A higher factor makes the SuperTrend further from the price, giving more room for price movement but possibly missing shorter-term signals. A lower factor brings the SuperTrend closer to the price, making it more reactive but possibly more prone to false signals.
Moving Average Source:
This setting lets you choose the type of moving average used for the SuperTrend calculation, such as Simple Moving Average (SMA), Exponential Moving Average (EMA), etc.
Different types of moving averages provide various characteristics to the SuperTrend, enabling customization to align with individual trading strategies and market conditions.
-----------------
Disclaimer
The information contained in my Scripts/Indicators/Ideas/Algos/Systems does not constitute financial advice or a solicitation to buy or sell any securities of any type. I will not accept liability for any loss or damage, including without limitation any loss of profit, which may arise directly or indirectly from the use of or reliance on such information.
All investments involve risk, and the past performance of a security, industry, sector, market, financial product, trading strategy, backtest, or individual's trading does not guarantee future results or returns. Investors are fully responsible for any investment decisions they make. Such decisions should be based solely on an evaluation of their financial circumstances, investment objectives, risk tolerance, and liquidity needs.
My Scripts/Indicators/Ideas/Algos/Systems are only for educational purposes!
Anit Momentum IndicatorAnit Momentum Indicator: A Powerful Trend Continuation Tool for Long-Only Strategies
The "Anit Momentum Indicator" (AMI) is a powerful technical analysis tool designed to assist traders in identifying potential trend continuation opportunities in the financial markets. Unlike traditional trend reversal indicators, AMI is specifically crafted for long-only strategies, making it an ideal tool for traders seeking to capture sustained uptrends.
Concepts and Functionality:
1. Momentum Calculation:
The Anit Momentum Indicator begins by calculating the momentum of the closing price over a specified period. Momentum represents the rate of price change, offering clues about the strength and direction of price movements during the chosen duration.
2. RSI for Trend Continuation:
The script then applies the RSI to the previously computed momentum values. The RSI is a well-known oscillator used to measure the speed and magnitude of price changes. By utilizing the RSI on momentum data, the Anit Momentum Indicator gains a distinct advantage in gauging the strength of price momentum, leading to more accurate trend evaluations.
3. Rescaling for Better Visualization:
To enhance visual clarity and maintain consistent representation, the RSI on Momentum is rescaled to range from 0 to 100. This normalization ensures that the indicator's values remain within a fixed range, making it easier for traders to identify crucial overbought and oversold regions.
How to Use the Indicator:
Long-Only Strategy:
The AMI is most effective in long-only strategies. Traders can deploy the indicator to identify promising opportunities to go long on a stock or asset. A long position is established when the AMI crosses above 50, signaling a robust upward momentum.
Trend Continuation Confirmation:
The AMI's ability to capture trend continuation opportunities allows traders to stay invested in an uptrend for an extended period. As long as the AMI remains above 50, the uptrend is considered intact, and traders may continue to hold the position.
Higher Timeframe Advantage:
The AMI's effectiveness is further enhanced on higher timeframes. Longer timeframes provide a more reliable and sustained view of the underlying trend, giving traders greater confidence in their long-only strategies.
Conclusion:
The Anit Momentum Indicator is a valuable tool for traders pursuing trend continuation strategies, specifically long-only approaches. By leveraging the concept of momentum and RSI, the AMI helps traders identify and participate in sustained uptrends. With its focus on trend continuation rather than reversals, the AMI can be a key component in building successful long-only trading strategies, especially on higher timeframes. Traders can use this indicator to stay invested in robust uptrends, maximizing their profit potential while minimizing exposure to counter-trend moves by staying long till AMI value is greater than 50,it is better to stay away or exit from the asst class when AMI value is less than 50.

DCA-Integrated Trend Continuation StrategyIntroducing the DCA-Integrated Trend Continuation Strategy 💼💰
The DCA-Integrated Trend Continuation Strategy represents a robust trading methodology that harnesses the potential of trend continuation opportunities while seamlessly incorporating the principles of Dollar Cost Averaging (DCA) as a risk management and backup mechanism. This strategy harmoniously blends these two concepts to potentially amplify profitability and optimize risk control across diverse market conditions.
This strategy is well-suited for both trending and ranging markets. During trending markets, it aims to capture and ride the momentum of the trend while optimizing entry points. In ranging markets or pullbacks, the DCA feature comes into play, allowing users to accumulate more assets at potentially lower prices and potentially increase profits when the market resumes its upward trend. This cohesive approach not only enhances the overall effectiveness of the strategy but also fosters a more resilient and adaptable trading approach in ever-changing market dynamics.
💎 How it Works:
▶️ The strategy incorporates a customizable entry signal based on candlestick patterns, enabling the identification of potential trend continuation opportunities. By focusing on consecutive bullish candles, it detects the presence of bullish momentum, indicating an optimal time to enter a long position.
To refine the precision of the signals, traders can set a specific percentage threshold for the closing price of the candle, ensuring it is above a certain percentage of its body. This condition verifies strong bullish momentum and confirms significant upward movement within the candle, thereby increasing the reliability of the signal.
In addition, the strategy offers further confirmation by examining the relationship between the closing price of the signal candle and its previous candles. If the closing price of the signal candle is higher than its preceding candles, it provides an additional layer of assurance before entering a position. This approach is particularly effective in detecting sharp movements and capturing significant price shifts, as it focuses on identifying instances where the closing price shows clear strength and outperforms the previous candle's price action. By prioritizing such occurrences, the strategy aims to capture robust trends and capitalize on notable market movements.
▶️ During market downturns, the strategy incorporates intelligent management of price drops, offering flexibility through fixed or customizable price drop percentages. This unique feature allows for additional entries at specified drop percentages, enabling traders to accumulate positions at more favorable prices.
By strategically adjusting the custom price drop percentages, you can optimize your entry points to potentially maximize profitability. Utilizing lower percentages for initial entries takes advantage of price fluctuations, potentially yielding higher returns. On the other hand, employing higher percentages for final entries adopts a more cautious approach during significant market downturns, emphasizing enhanced risk management. This adaptive approach ensures that the strategy effectively navigates challenging market conditions while seeking to optimize overall performance.
▶️ To enhance performance and mitigate risks, the strategy integrates average purchase price management. This feature dynamically adjusts the average buy price percentage decrease after each price drop, expediting the achievement of the target point even in challenging market conditions. By reducing recovery times and ensuring investment safety, this strategy optimizes outcomes for traders.
▶️ Risk management is at the core of this strategy, prioritizing the protection of capital. It incorporates an account balance validation mechanism that conducts automatic checks prior to each entry, ensuring alignment with available funds. This essential feature provides real-time insights into the affordability of price drops and the number of entries, enabling traders to make informed decisions and maintain optimal risk control.
▶️ Furthermore, the strategy offers take profit options, allowing traders to secure gains by setting fixed percentage profits from the average buy price or using a trailing target. Stop loss protection is also available, enabling traders to set a fixed percentage from the average purchase price to limit potential losses and preserve capital.
▶️ This strategy is fully compatible with third-party trading bots, allowing for easy connectivity to popular trading platforms. By leveraging the TradingView webhook functionality, you can effortlessly link the strategy to your preferred bot and receive accurate signals for position entry and exit. The strategy provides all the necessary alert message fields, ensuring a smooth and user-friendly trading experience. With this integration, you can automate the execution of trades, saving time and effort while enjoying the benefits of this powerful strategy.
🚀 How to Use:
To effectively utilize the DCA-Integrated Trend Continuation Strategy, follow these steps:
1. Choose your preferred DCA Mode - whether by quantity or by value - to determine how you want to size your positions.
2. Customize the entry conditions of the strategy to align with your trading preferences. Specify the number of consecutive bullish candles, set a desired percentage threshold for the close of the signal candle relative to its body, and determine the number of previous candles to compare with.
3. Adjust the pyramiding parameter to suit your risk tolerance and desired returns. Whether you prefer a more conservative approach with fewer pyramids or a more aggressive stance with multiple pyramids, this strategy offers flexibility.
4. Personalize the price drop percentages based on your risk appetite and trading strategy. Choose between fixed or custom percentages to optimize your entries in different market scenarios.
5. Configure the average purchase price management settings to control the percentage decrease in the average buy price after each price drop, ensuring it aligns with your risk tolerance and strategy.
6. Utilize the account balance validation feature to ensure the strategy's actions align with your available funds, enhancing risk management and preventing overexposure.
7. Set take profit options to secure your gains and implement stop loss protection to limit potential losses, providing an additional layer of risk management.
8. Use the date and time filtering feature to define the duration during which the strategy operates, allowing for specific backtesting periods or integration with a trading bot.
9. For automated trading, take advantage of the compatibility with third-party trading bots to seamlessly integrate the strategy with popular trading platforms.
By following these steps, traders can harness the power of the DCA-Integrated Trend Continuation Strategy to potentially maximize profitability and optimize their trading outcomes in both trending and ranging markets.
⚙️ User Settings:
To ensure the backtest result is representative of real-world trading conditions, particularly in the highly volatile Crypto market, the default strategy parameters have been carefully selected to produce realistic results with a conservative approach. However, you have the flexibility to customize these settings based on your risk tolerance and strategy preferences, whether you're focusing on short-term or long-term trading, allowing you to potentially achieve higher profits. The backtesting was conducted using the BTCUSDT pair in 15-minute timeframe on the Binance exchange. Users can configure the following options:
General Settings:
- Initial Capital (Default: $10,000)
- Currency (Default: USDT)
- Commission (Default: 0.1%)
- Slippage (Default: 5 ticks)
Order Size Management:
- DCA Mode (Default: Quantity)
- Order Size in Quantity (Default: 0.01)
- Order Size in Value (Default: $300)
Strategy's Entry Conditions:
- Number of Consecutive Bullish Candles (Default: 3)
- Close Over Candle Body % (Default: 50% - Disabled)
- Close Over Previous Candles Lookback (Default: 14 - Disabled)
- Pyramiding Number (Default: 30)
Price Drop Management:
- Enable Price Drop Calculations (Default: Enabled)
- Enable Current Balance Check (Default: Enabled)
- Price Drop Percentage Type (Default: Custom)
- Average Price Move Down Percentage % (Default: 50%)
- Fixed Price Drop Percentage % (Default: 0.5%)
- Custom Price Drop Percentage % (Defaults: 0.5, 0.5, 0.5, 1, 3, 5, 5, 10, 10, 10)
TP/SL:
- Take Profit % (Default: 3%)
- Stop Loss % (Default: 100%)
- Enable Trailing Target (Default: Enabled)
- Trailing Offset % (Default: 0.1%)
Backtest Table (Default: Enabled)
Date & Time:
- Date Range Filtering (Default: Disabled)
- Start Time
- End Time
Alert Message:
- Alert Message for Enter Long
- Alert Message for Exit Long
By providing these customizable settings, the strategy allows you to tailor it to your specific needs, enhancing the adaptability and effectiveness of your trading approach.
🔐 Source Code Protection:
The source code of the DCA-Integrated Trend Continuation Strategy is designed to be robust, reliable, and highly efficient. Its original and innovative implementation merits protecting the source code and limiting access, ensuring the exclusivity of this strategy. By safeguarding the code, the integrity and uniqueness of the strategy are preserved, giving users a competitive edge in their trading activities.

Trend Analysis Ultimate (Zeiierman)█ Overview
Trend Analysis Ultimate (Zeiierman) highlights meaningful pullbacks within active market trends and visualizes them through green and red columns, retracement triangles, and an optional trend-colored background. It is designed to make the distinction between continuation and transition phases clear at a glance while automatically managing dynamic trailing stops, early and partial profit-taking levels, and alert conditions for entries, take-profits, and full exits.
The system adapts to changing market structure in real time, allowing traders to monitor momentum shifts, retracement strength, and phase transitions with precision. By combining structural mapping with adaptive sensitivity controls, it provides a complete framework for identifying where a trend is likely to continue, pause, or reverse.
⚪ Why This One Is Unique
Unlike traditional trend tools that simply color bars or measure moving averages, Trend Analysis Ultimate integrates retracement mapping with trend phase detection. Its framework merges contextual structure analysis (higher highs/lows or lower highs/lows) with dynamic sensitivity controls, identifying both the rhythm and the stress points within a trend.
Through a unified signal logic and adaptive retracement engine, traders can distinguish between normal pullbacks within a trend and retracements that precede reversal — all visualized with intuitive, color-coded accuracy.
█ Main features
⚪ Retracements
A retracement is a temporary move against the prevailing trend. It often signals a pause, potential continuation opportunity, or the early stages of a reversal. In this indicator, green/red retracement columns mark significant pullbacks that frequently precede new local highs/lows, continuation legs, or the end of a trend.
Key concept: Retracements appear at both continuation points and turning points. The trader’s edge is in recognizing whether the pullback is a reset of strength or the first warning that the current trend is losing control.
Bullish Retracement
Bearish Retracement
⚪ Retracements Signals
The Retracement Signals feature highlights the precise moments when a temporary counter-move within a dominant trend shows signs of exhaustion and potential continuation. It converts early momentum shifts into clear bullish or bearish setup signals.
Bullish Retracement Signal
Bearish Retracement Signal
⚪ Trend
The Trend Feature visually defines the current market regime — bullish, bearish, or neutral — by dynamically coloring bars, the indicator background, and the Confirmed Trend Columns in the lower panel. Together, these elements reflect the underlying directional bias detected by the trend engine, providing immediate context for all retracement, continuation, and entry signals.
Green bars, background, and confirmed columns → Active Bullish Trend Phase
Red bars, background, and confirmed columns → Active Bearish Trend Phase
Light or neutral bars → Transition Phase, signaling potential trend change or reduced directional strength.
█ How to Use
⚪ Major Retracements / Pullbacks
Major Bullish Retracements
Step 1: Ask Key Context Questions
When green retracement columns appear in the indicator window, ask yourself:
Are we in a bullish trend? Look for higher highs (HH) and higher lows (HL). Confirm that trendlines are pointing upward.
Is this forming a higher low? Green columns often print during pullbacks, just before price forms a higher low and the uptrend continues.
Is this a healthy correction? If price respects previous structure or the rising trendline, and the green bars begin shrinking, it indicates renewed strength and that the pullback may be ending.
Step 2: Apply Practically
If the answers above are Yes, the retracement likely represents a continuation opportunity.
Confirm an uptrend (HH/HL structure, rising trendlines).
Treat green columns as a pullback zone within that trend.
Watch for confirmation such as:
Rejection candles near support
Break of a short-term downtrend line
Volume confirming renewed buying pressure
Enter once price resumes upward movement, not during the retracement itself.
Major Bearish Retracements
Step 1: Ask Key Context Questions
When red retracement columns appear in the indicator window, ask yourself:
Are we in a bearish trend? Check if lower highs (LH) and lower lows (LL) are forming, and confirm that trendlines are pointing downward.
Is this forming a lower high? Red columns often appear during pullbacks, just before price forms a lower high and the downtrend resumes.
Is this a healthy correction? If price respects prior resistance or a falling trendline, and the red bars begin shrinking, it signals renewed weakness and that the pullback may be ending.
Step 2: Apply Practically
If the answers above are Yes, the retracement likely marks a continuation opportunity in the prevailing downtrend.
Confirm a downtrend (LH/LL structure, falling trendlines).
Treat red columns as a pullback zone within that trend.
Watch for confirmation such as:
Rejection candles near resistance
Break of a short-term uptrend line
Volume confirming renewed selling pressure
Enter once price resumes downward movement, not during the retracement itself.
⚪ Minor Retracements / Pullbacks
Minor retracements represent short, fast counter-moves within an active trend. They often occur as quick pauses or micro-corrections and are best suited for scalping or short-term continuation setups. Always align these signals with the dominant background trend and confirm direction using clear trendlines to stay on the right side of market structure.
Minor Bullish Retracements
When price is in a clear uptrend and a small pullback occurs:
Watch for short sequences of green retracement impulses (▲) or shrinking green columns on the indicator.
Treat these as quick buy-the-dip zones within the larger bullish context.
Look for confirmation from trendline support or a rejection candle before entering.
Minor Bearish Retracements
When price is trending downward and a brief rally appears:
Watch for red retracement impulses (▼) or shrinking red columns indicating weakening upward correction.
Use these as potential short re-entry zones in line with the broader downtrend.
Confirm with rejection at resistance or a break of a short-term uptrend line.
⚪ Retracements Signals
Bullish Signals
Bullish Retracement Signals appear during an active uptrend, typically within retracement phases when the market experiences a short-term pullback against the main trend. These signals are triggered when the retracement shows signs of exhaustion and the indicator detects renewed buying momentum aligned with the broader bullish structure.
They highlight potential continuation points, where the price may resume making higher highs after completing a healthy correction. This setup leverages the natural rhythm of the market — capturing the moment buyers regain control following temporary weakness.
Bearish Signals
Bearish Retracement Signals form during an active downtrend, typically within counter-trend rallies or retracement phases against the dominant bearish direction. They emerge when temporary upward movement loses strength, and the indicator identifies renewed selling pressure aligned with the main trend.
These signals often precede fresh downside continuation — when sellers reassert control and push price toward new lower lows.
⚪ Identifying the End of One Trend and the Start of Another
Every trend eventually runs out of strength. Early signs often look like a normal retracement, a routine pullback within the existing move. But when price fails to attract enough buyers or sellers to continue in the same direction, that retracement can mark the turning point where momentum shifts and a new trend begins.
When price can no longer find support in an uptrend or resistance in a downtrend, it signals exhaustion of the current phase and a possible transition into the opposite direction. The retracement columns highlight these transition zones, areas where one trend may fade and another may start forming.
When they appear, it’s important to ask:
Is the current trend mature? The longer a trend has been running, the greater the likelihood of reversal. If retracement columns show up late in a multi-leg move, treat them as early warnings.
Are there reversal signs forming? Watch for structures like double tops, double bottoms, trendline breaks, or channel violations that suggest the trend’s strength is fading.
By combining retracement columns with a clear understanding of trend structure and price action, traders can better distinguish between healthy pullbacks and the emergence of a new trend.
Bullish Trend Ends
Bearish Trend Ends
█ How It Works
⚪ Trend Phase Architecture
The indicator models directional bias through a continuously adaptive trend-mapping framework. It classifies market states as bullish, bearish, or neutral based on slope polarity and structural persistence.
Calculation: Utilizes layered regression vectors and dynamic range analysis to estimate directional gradients, blending short- and long-term components to maintain stability while remaining responsive to new motion.
⚪ Retracement Detection Engine
Retracement columns quantify counter-movements within the dominant trend, identifying deceleration, pullback depth, and phase overlap. Each bar’s classification reflects the relative strength trend progression.
Calculation: Applies trend-state comparison with phase-weighted averaging to isolate transitional motion. The resulting dual-polar columns (green/red) are normalized to a zero-centered scale for visual symmetry and precision.
⚪ Impulse & Triangle Module
Retracement impulses (▲/▼) represent local acceleration spikes during pullback phases, revealing the moment when opposing momentum reaches statistical significance.
Calculation: Identifies short-term impulse clusters through curvature mapping to isolate localized bursts of directional momentum within the retracement phase.
⚪ Entry & Signal Logic
The entry module fuses retracement data with trend-state validation, filtering signals through contextual structure and confirmation hierarchy. Only qualified impulses aligned with the dominant vector trigger actionable events.
Calculation: Integrates a composite decision function using multi-phase sensitivity weighting, differential smoothing, and state gating to separate impulsive noise from valid continuation momentum.
-----------------
Disclaimer
The content provided in my scripts, indicators, ideas, algorithms, and systems is for educational and informational purposes only. It does not constitute financial advice, investment recommendations, or a solicitation to buy or sell any financial instruments. I will not accept liability for any loss or damage, including without limitation any loss of profit, which may arise directly or indirectly from the use of or reliance on such information.
All investments involve risk, and the past performance of a security, industry, sector, market, financial product, trading strategy, backtest, or individual's trading does not guarantee future results or returns. Investors are fully responsible for any investment decisions they make. Such decisions should be based solely on an evaluation of their financial circumstances, investment objectives, risk tolerance, and liquidity needs.
Skrip berbayar

Ross Hook Pattern (Expo)█ Overview
The Ross Hook pattern is one of the most consistent and successful trading patterns that have been around for years. The Ross Hook is the first correction following the breakout of the 1-2-3 formation . This means that the Ross Hook only occurs in established trends. In other words, Ross Hook is a trend continuation setup. To fully understand the Ross Hook formation, you must understand the 1-2-3 pattern .
Ross Hook Pattern (Expo) is an indicator designed to detect the Ross Hook formation automatically and in real-time in any market and timeframe. With the inbuilt alert feature, the Ross Hook Pattern (Expo) Indicator analyzes the market for you and notifies you when the Ross Hook formations have been found.
█ How to use
Use this indicator to identify the Ross Hook pattern and to find good trend continuation setups. The formation can be used to determine when a trend is confirmed and established.
-----------------
Disclaimer
The information contained in my Scripts/Indicators/Ideas/Algos/Systems does not constitute financial advice or a solicitation to buy or sell any securities of any type. I will not accept liability for any loss or damage, including without limitation any loss of profit, which may arise directly or indirectly from the use of or reliance on such information.
All investments involve risk, and the past performance of a security, industry, sector, market, financial product, trading strategy, backtest, or individual's trading does not guarantee future results or returns. Investors are fully responsible for any investment decisions they make. Such decisions should be based solely on an evaluation of their financial circumstances, investment objectives, risk tolerance, and liquidity needs.
My Scripts/Indicators/Ideas/Algos/Systems are only for educational purposes!

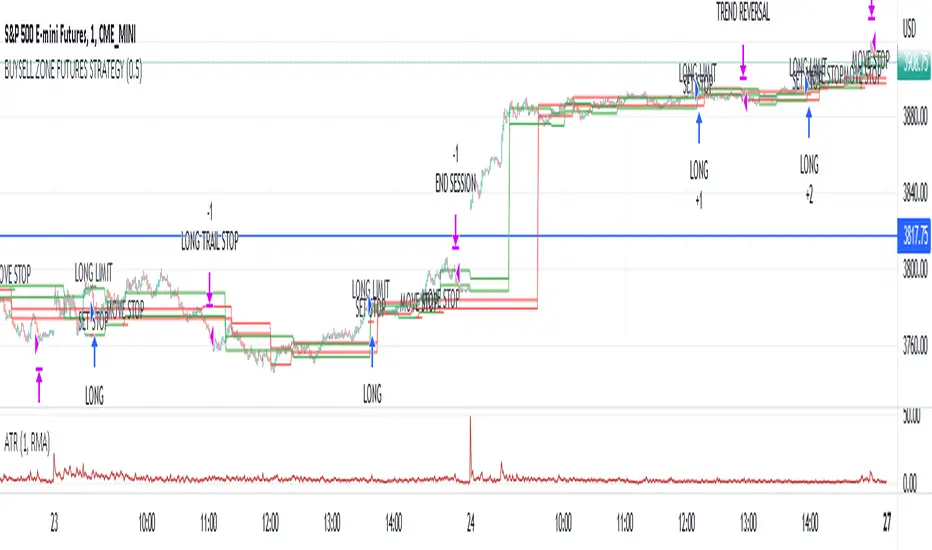
ATR Trend Run - Signals Alerts SL and TP by Tech Store OnThe script uses several ATR formulas for entering/exiting trades, support/resistance lines to take TP1 (take profit 1) and another ATR formula for TP2 (take profit 2). Everything is fully configurable to your preference, and you can back-test it via TradingView. You can also configure the indicator for signals during US trading sessions (with or without power hour), as well as taking profits/stop-loss session time(s), as well as to close a position at the end of the trading session no matter what. Also, you can turn all of that off, so there are no trading session/end of day limits and each trade will run until it either hits SL, TP1, TP1 > back to entry, TP2. Note: indicator is set to skip consecutive/opposite signals, while you currently have a trade open > if you hit a trend – ride it to the end!
For example: If you will be day trading SPY and you wish to close your positions no matter what right before the market closes (3:45PM ET > 15min before closes): Make sure to checkbox “Intraday – Close Position Before Market Closes” in the strategy/indicator Settings, so that you are alerted soon before the market closes, if you wish to continue holding the position – leave this checkbox unchecked.
SL: SL is set to be slightly above/below the signal candle, which is best suited for this strategy.
Strategy Take Profit Approach
While the initial position open and SL hit is always based on a closed candle bar (can’t do otherwise, as otherwise you will have 10s of fake signal alerts), there are 2 ways on trading this strategy in terms of TP1 and TP1 taken > back to Entry, which is based off Alert type.
You can switch this as you like within the indicator settings, “Checked: TP1 taken > back to Entry per Price Touch | Unchecked: per Candle Close”.
Candle Close vs Price Touch: with the Default method - Candle Close for an alert for TP1 or if price comes back to Entry after TP1 is taken will only be triggered once candle bar fully closes crossing the area, while Price Touch will alert when price touches the area before candle bar closes.
For example: your trade is running well, you grab TP1 and the price reverses and hits your trade Entry area. With Price Touch – you are immediately alerted to close your trade with no loss and with TP1 profit. With Candle Close - you will receive an alert only once candle bar fully closes on top of the Entry crossing it backwards, meaning it may lower your TP1 profit or even completely reverse the trade into loss in case it will be a huge candle bar for any reason. However, it may touch the Entry area, looking like the price is reversing, but then continue per initial trade direction, sometimes becoming a trend. So, while Price Touch seem like a more conservative approach, Candle Close can give you much bigger profits if you catch a trend, but you can always change it via the Settings.
Note: TradingView back-testing engine does not have a feature to open/close orders IMMEDIATELY via Price Touch trigger, but only when the candle closes after price touches the scripted area/line/etc., so you for the most accurate results, test your strategy out via Candle Close setting. Otherwise, decide yourself. I personally like more Candle Close since I can test it out via back-testing with the most accurate results.
TP2 is set per Candle Close as often the ATR trailing stop line will be hit and bounced off, so it’s best to wait until candle actually breaks it/closes through it.
Note: If you will be observing the strategy LIVE, during LIVE candle bar movement – it will look weird, like it’s placing an order after order during any trigger – this seem like a TradingView bug, but is only observational, once the candle bar is closed and you refresh TradingView it will all look correct.
Back-Testing
If you wish to do some back-testing, just modify the strategy/indicator Settings:
-----1) STRATEGY: This is for back-testing/experimenting with the script inputs.
----------a. You can setup a start date (date, month, year) from which it will start opening back-test trades, select a position size and select TP1 size, the idea here is to close half (or whatever you choose) portion of the trade once you hit your TP1, then to either close at small profit or to catch a trend and close the second portion of the position long way ahead from Entry, otherwise it will alert you to close the position at TP2, if price comes back to Entry, at reversal signal or at the end of US trading session if the option for it is checked. If you wish to close the whole position at TP1, just enter the same amount for TP1 to match backtest position size. Otherwise you can experiment with TP1 sizing – try it out!
-----2) Feel free to experiment with ATR settings and with S&R Left/Right bars, you may be amazed how results will differ and find some really cool combinations!
-----3) Make sure you select/de-select “Intraday – Close Position Before Market Closes” setting depending on what you are back-testing and on which conditions
-----4) Note: If you wish to do some deep back-testing (1+ years), use the “Deep Backtesting” feature within Strategy Tester on the TradingView as otherwise it may show wrong results or even fail to compute the results
Add the alerts
-----Right-click anywhere on the TradingView chart
-----Click on Add alert
-----Condition: ATR Trend Run - Signals Alerts SL and TP, by Tech Store On
----------o Right underneath the condition click on the drop-down menu and select “alert() function calls only”
-----Expiration time: Whatever you wish
-----Alert actions: Whatever notifications you wish
-----Alert name: DO NOT TOUCH THIS
-----Hit “Create”
-----Note: If you change ANY Settings within the indicator – you must DELETE the current alert and create a new one per steps above, otherwise it will continue triggering alerts per old Settings!
- Note: If you add the alert while the script is currently “In Position” it will not know that. So either wait when there will be no position open at all or close your position partially if the bot opens it twice bigger or so in case per script the bot will think it is already in position.
Note: Because of the slippage and the order processing time between TradingView, AutoView and the Broker (it’s usually about a second or so), it is suggested to not use a timeframe lower than 1min. The script is working really well with 1M/3M/5M/H1/H4 timeframes per my back-testing, but feel free to explore via Strategy Back-testing what’s best for the instrument you wish to trade.
If you wish to try this out for a week or so – please reach out and I will give you access.

Wick-off Check Moving Average [Misu]█ This Indicator shows a wick-off check pattern applied to a moving average.
This pattern appears when a candle opens below the moving average and closes above it, or when it opens above a moving average and closes below it. This causes a wick to go through the moving average: a wick-off check moving average.
█ Usages:
This indicator detects small pullbacks in a trend. This is mainly used for trading continuation strategies.
It can also be used to validate a resistance or support level .
█ Features:
> Average Wick Validation: You can validate a wick-off check pattern depending on the average wick size. This is configured with parameters "Lenght Avg Wick Validation" and "Factor Wick Validation".
> Trend Validation: A trend is taken into account when detecting a "continuation pattern". A trend is validated if X candles close above (up trend) or under (down trend) the moving average. This "X" is defined by "Length Bar - Trend Validation" parameter.
> Buy and Sell: Labels are showing wick-of check patterns but can be interpreted as a buy & sell signal.
> Multi Moving Average.
> Alerts.
█ Parameters:
Method Multi MA : The method for calculating the moving average.
Multi MA Length : The length used to calculate the moving average.
Length Bar - Trend Validation : Define the number of bar needed to validate a trend. When price is above the MA, trend is up. When price is under MA, trend is down.
Wickoff Mode : Mode used to detect Wickoff check pattern.
> continuation pattern: only shows wick-off check pattern in a confirmed trend.
> no trend in progress: only shows wick-off check pattern in a not confirmed trend.
> both: shows both.
Lenght Avg Wick Validation : Lenght used to calculate the average wick size.
Factor Wick Validation : Factor used to validate the length of a wick when a wick-off check is detected.
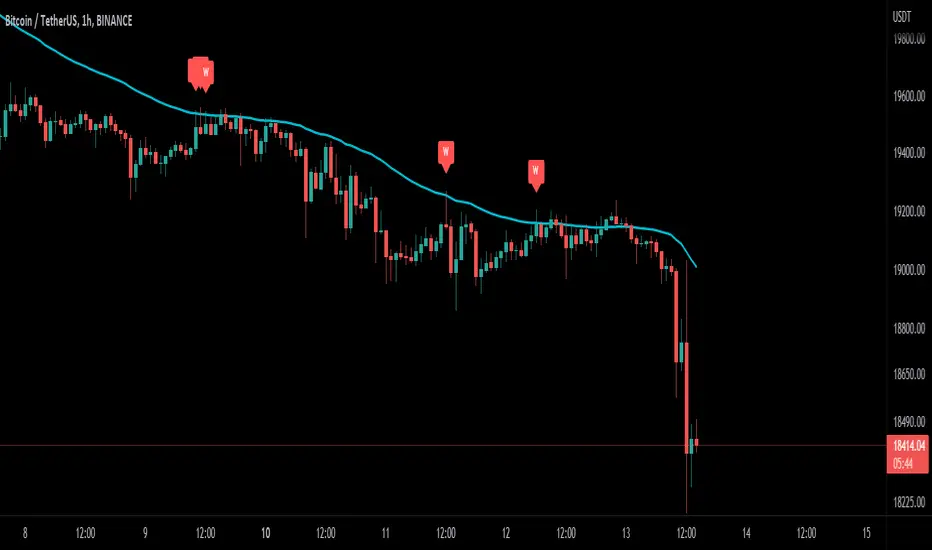
MACD strategy + Trailstop indicatorWelcome traveler !
Here is my first indicator I made after 3 days of hardlearning pine code (beginner in coding).
I hope it will please you, if you have any suggestion to enhance this indicator, do not hesitate to give me your thoughts in the comments section or by Private message on trading View !
How does it works ?
It's a simple MACD strategy as describe here :
Uses of EMA 200 as a trend confirmer,
For sells :
When above Zero line (MACD) and under EMA200, we go on sell (background color is red)
For buys:
When under Zero line (MACD) and above EMA 200, we go on Buy (back ground color is green)
FILTERS !
I haded one filter to reduce noise on the indicator :
Signals aren't taken if one of the 14 last candles closed on the other side of the EMA 14.
What are the green and red lines ?
The green line is equivalent of a potential stop loss as a buyer side, same for the red one on seller side !
To make the space with the price bigger, please use "ATR multiplier" in the input options of the indicator while on your chart !
Is it timeframe specific ?
Hell no it is not timeframe specific ! You can try to use it on every timeframe !
As usual, I like to remind you that the best way to test an indicator is to go backtest it or to paper trade before using it on real market conditions !
If you find an idea of filter for a specific timeframe, do not hesitate to contact me ! I'll try to do my best to enhance this indicator as the time goes !
Is there repainting ?
There is no repainting on confirmation !
There's only a movement that I don't know how to ignore on the current open candle for the trail stop indicator I built, it should not be a problem if you place alerts to automatise your trading on the close of the candle, and not the high or low !
If you know how to resolve this problem with my code, I would be glad to get your tips to enhance the script ! :)
Example of the indicator in market (backtest, as said, no repaint on confirmation) :

Trend101 v5Welcome to what I believe to be the best indicator on TradingView. Trend101 v5
"Not all trends are made equal"
You should be only trading the trends that matter most... The basis of this script is using volume to rank price trends and give more prominence to the trends that are backed by volume, enabling you to only focus on riding the trends that matter.
If we see a trend with high volume, this will show up in the indicator with larger green or red columns / bars & the trends with low volume will cause little movement in the indicator.
Some indicators are great at showing price trends, some are great at showing volume... Trend101 v5 is great at showing both of these.
This indicator can be used in a variety of ways:
1) The most simplistic is to trade crossovers from Bull > Bear trends and vice versa. This alone can be profitable with a "scalping" mindset where you ride the trend until it shows signs of weakness.
2) The other way I use this indicator is to act as a confirmation tool... for example if price is approach a level of support, you can wait until the price shows signs of rejection and then your confirmation for entry is that Trend101 v5 will change to green. (& the opposite for levels of resistance).
Finally you are also able to use the Timeframe input to select different timeframes, this is useful to use two Trend101 indicators together to filter trade entries. An example would be using one Trend101 indicator set on the 15min timeframe and one set on the Daily timeframe and when both of these align in the same trend direction you are able to enter your trade.
I will produce a video "How To..." guide for this indicator shortly to explain other details.
Let me know in the comments below how you are using the indicator and all feedback is welcome.

Directional BiasA Directional Bias to stop me trading against the trend
Utilising EMA'S - I personally view on the 15M TF but it can be set on any
40/50/60 15Minute STF
and 13/35/50 - 30M 1H and 4H HTF
Mixing them together in direction and location to each other Gives a 6 colour system for keeping away from trading against trend
Dark Red Both Align - Sells Only do not take Buy Trades
Medium Red HTF and Dark Red Mix - Sells Only do not take Buy Trades
Light Red STF - if in a mix with Blanks and greens - Trade Both Directions - if 8 hours of solid Light Red ? Darker Red - do not take Buy Trades - Sells Only
Orange - Trading Both ways - No Directional Bias
Dark Green Both Align - Buys Only do not take Sell Trades
Medium Green HTF and Dark Green Mix - Buys Only do not take Sell Trades
Light Red STF - if in a mix with Blanks and greens - Trade Both Directions - if 8 hours of solid Light Green ? Darker Green - do not take Sell Trades - Buys Only
Alert Setting for Change of Direction included
I find this useful - to at least give me a pause for thought when I am about to trade against the trend - I hope you do to

Rate Of Change Trend Strategy (ROC)This is very simple trend following or momentum strategy. If the price change over the past number of bars is positive, we buy. If the price change over the past number of bars is negative, we sell. This is surprisingly robust, simple, and effective especially on trendy markets such as cryptos.
Works for many markets such as:
INDEX:BTCUSD
INDEX:ETHUSD
SP:SPX
NASDAQ:NDX
NASDAQ:TSLA

Delta Volume by SiddWolfDelta Volume is Difference between Buying Volume and Selling Volume. This indicator gives the Delta Volume based on Lower TimeFrame Candles. It utilizes security_lower_tf() function, a function that provides Lower TF candle data in Higher TF Chart.
security_lower_tf() is a new function provided by TradingView yesterday. If you are a PineScript Programmer, I suggest you to read about it, as it is a very powerful function that can extremely improve your trading strategy.
How this indicator works:
This indicator checks volume data on lower TimeFrame Candles and Shows it's delta in the current Chart Timeframe. For example: If you open 4 hours chart, this indicator checks volume of 1 minute chart and separates Buying-Selling volume. Then it subtracts Candle's Selling volume from Candle's Buying volume, finally calculating the Delta Volume.
This indicator also provides a Smooth Delta Volume, which is moving average of Delta Volume. As Delta Volume changes a lot, Smooth Delta Volume can be very helpful for identifying Trends . Goto settings and in "Show" section select "Smooth Delta Volume" to lay it on the chart.
Settings is the Key:
Settings are key to all of my indicators. Play around with it a bit. You can change what to show on the chart from settings. Smooth Delta Volume moving average length can be changed from the settings. You can also select "Show as Percentage", which shows Delta Volume as Percentage of Overall Candle's Volume. If you use Weekly or Monthly Timeframe, change increase lower timeframe from settings. Read the tooltips to understand what each settings mean. Tooltips are the (i) button in-front of each settings.
FAQs:
Q. Does the indicator Repaint ?
--- No. None of my indicators repaints. What you see now is what's drawn in real time.
Q. What TimeFrame is Best for this Indicator ?
--- It can be used on timeframes from 5 minutes to higher. But I would prefer to use it from timeframes higher than 30 minutes, as it gathers data from 1 minute TF.
Q. Indicator doesn't show anything ?
--- This indicator only works on security with Volume data. Also use it from higher timeframe than specified in Settings, because Volume Delta is calculated using Data from Lower TimeFrame.
Q. Delta volume is not provided by TradingView, So how exactly does this indicator work?
--- This indicator takes advantage of new pinescript function security_lower_tf(), and calculates volume for smaller timeframe data and calculates delta on higher timeframe.
Q. Does this indicator give financial advice?
--- No. Nope. Nein. Não. नहीं.
Conclusion:
This indicator is very basic but if used correctly it can be very powerful. If you have any questions or suggestions feel free to comment below. I'd love to connect with you. Thank you.
~ @SiddWolf

Commercial Algo Trend © Fzn V1Hello Traders,
Here i bring to you my 2nd Price Action Atr based Indictor combined with fib entry and exit trailing levels with minimum risk and maximum profit , as we must have seen at times as we enter the trend reverse and hits our stop losses . Keeping that in mind as i too struggled and made losses so i decided and focused more on minimizing the stop loss and only on confirmation of Long or Short trade is been initiated with proper Stop loss as explained in the images below , why should we give market our money ;) as we are here to make money :D .. There is no holy grail as Stop loss wont be hit but yes it will be way less and all alerts are based on candle close . One can use this on any chart and any timeframe and its very good for scalping too .ATR Trailing SL is added too just incase you want to enter and exit trend manually . Better results are on 15m and above . Hope you guys will like it and comment if you have any doubts..
-----------------
Disclaimer
Copyright by FaizanNawazz.
The information contained in my scripts/indicators/strategies/ideas does not constitute financial advice or a solicitation to buy or sell any securities of any type. I will not accept liability for any loss or damage, including without limitation any loss of profit, which may arise directly or indirectly from the use of or reliance on such information.
All investments involve risk, and the past performance of a security, industry, sector, market, financial product, trading strategy, or individual’s trading does not guarantee future results or returns. Investors are fully responsible for any investment decisions they make. Such decisions should be based solely on an evaluation of their financial circumstances, investment objectives, risk tolerance, and liquidity needs.
My scripts/indicators are only for educational purposes!
Happy Trading!
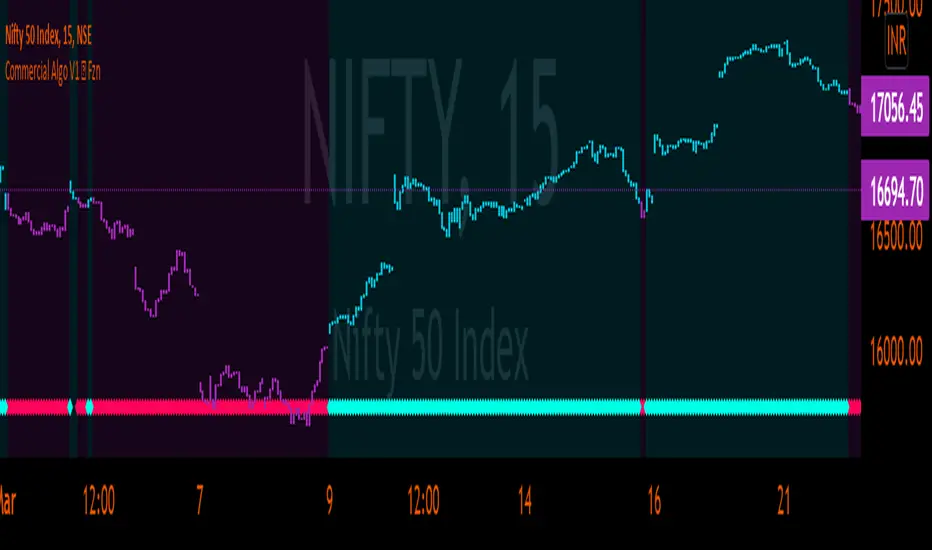
Trending Bollinger Bands by SiddWolfBollinger Bands are mostly used for trend reversal. I believe they should be used for Trend Continuation and Trend Confirmation.
In this Trending Bollinger Bands script you will see two bands drawn on chart. The Upper band is suggestive of Uptrend and Lower Band is suggestive of Downtrend Market. It just provides the guidance of where the market is now and where it is headed. It is not to be used as a standalone indicator. Use this to confirm your hypothesis of Uptrend or Downtrend.
Bollinger Bands Trend
When the price crosses the moving average it is interpreted as the price is gonna continue in that direction. But most of the time it is a fake breakout. With this script you get an additional confirmation so that you know it is not a fake breakout and the price have caught the trend.
Bollinger Bands Reversal:
This indicator can also work for reversal. For example when price closes outside the outer bands, it is most likely that the trend is gonna reverse. Don't just enter the trade wait for some other confirmation as reversal trading is more complicated.
Confluence:
Confluence is the key factor for profitable trading. Don't use this indicator as standalone indicator instead combine it with other indicators and price action. Like the divergence occurring when the price is outside the bands is suggestive of trend reversal. I have created a non-delay, non-repaint indicator for finding divergence. I'd soon publish that script. Stay tuned.
Settings is the Key:
Try to play around with the settings. It is a simple yet effective indicator. Change the moving average type or length. I've found moving average RMA or WMA works better than SMA. Find the best setting that works with your setup. Set the Band Source as High/Low to make the outer bands more extreme.
Conclusion:
This is my first script but it isn't my last. I've created quite a few gems that I'm gonna publish soon. If you have any questions or suggestions feel free to comment below. I'd love to connect with you. Thank you.

Market structure intraday ES futures strategy - BuySell ZonesThis market structure strategy for ES Mini Futures optimized for intraday market analysis ( RTH ).
Entry condition identified by bearish and bullish market structure.
Support level (Green Lines) is identified based on different variations of price fluctuations followed by the close above the range.
Resistance level (Red Lines) is identified based on different variations of price fluctuations followed by the close below the range.
The idea is to spot areas where market players were fighting for the best price and one side finally won.
Bullish trend is identified by consecutive series of support levels developing in upside direction.
Bearish trend is identified by consecutive series of resistance levels developing in downside direction.
When market develops bullish trend , strategy sets LONG limit order at fresh support level .
When market develops bearish trend , strategy sets SHORT limit order at fresh resistance level .
If there is an open position no new entries are performed.
For longs initial stop is set at previous support level adjusted by ATR.
For shorts stop is set at previous resistance level adjusted by ATR.
Stop trailing is also based on market structure.
If new support level is identified, stop moves to previous support level .
If new resistance level is identified, stop moves to previous resistance level .
There are no target. Strategy either gets stopped at current stop level or exits at session end.
Strategy calculates position size based on the previous market structure and ATR.
Strategy performs compounding position sizing so as account amount increases so does amount of traded contracts.
Usage:
Add script to your favorites and apply it on ES1! 1 minute time frame setting regular trading hours.
Script will print the limit order as well as stop levels according to the rules described above. As trade will progress, script will print levels to move the stop to.
Settings:
I added an option to disable the support and resistance lines printing if you prefer to have clean charts.
You can also change risk % to best fit your trading style.
If you just want to use the support and resistance levels as indicator you can also disable the strategy execution.
Support and Resistance indicator itself is universal and can be used on any market or timeframe.
If you want the strategy to be optimized for other markets or timeframes or have other rule set in mind feel free PM me, we will create the solution that best fits your needs and styles.
Real life trading is not get rich scheme. It is continuous process that involves various steps and dedication. If you are willing to take this path please PM me to enable the strategy for you.
Enjoy!