Volatility Radar [upslidedown]💎 Overview
Volatility Radar visualizes extreme volatility conditions in a clean, intuitive oscillator format.
Unlike traditional momentum oscillators, it transforms average true range (ATR) behavior into a directional volatility structure, making it easier to spot moments when markets may be shifting into expansion, compression, or potential pivot zones.
💎 How to Use
The oscillator highlights moments when the internal volatility condition becomes active as well as when that condition breaks. These events may coincide with structural turning points, breakout conditions, or volatility expansions. While not a prediction tool, Volatility Radar helps traders identify moments worth paying closer attention to.
💎 Signal Markers
■ Square icons on top/bottom identify when the Volatility Radar condition is ACTIVE
▲▼ Triangle icons on top/bottom identify when the Volatility Radar condition BREAKS
📌 Chart Example:
💎 Oscillator Trends
One of the core features of Volatility Radar is its ability to highlight positive or negative volatility trends. The oscillator automatically colors its components to reflect uptrending vs. downtrending volatility structure, making trend context easier to interpret at a glance.
📌 Chart Example:
💎 Histogram Trends
For users who prefer a more compact or traditional visual style, Volatility Radar includes an optional histogram display mode. This mode provides a clean representation of the detected trend and can be helpful for validating price-action concepts within the broader volatility context.
📌 Chart Example:
💎 Volatility Moving Average
The yellow moving average line offers a volatility moving average that can aid in determining longer term trend strength.
Interpret the trend direction by observing whether the average is increasing/decreasing or above/below the zero line.
Reversals may be observed when values move into oversold territories.
Trend continuation may occur during periods when the average is near the zero line.
Evaluate opportunities when the moving average is "touched" or "pinged" by the radar line (setting available to highlight these crosses).
📌 Chart Example:
💎 Backtesting Support
Volatility Radar outputs external signals designed for use with automated backtesting on TradingView. It integrates with @jason5480’s open-source Template Trailing Strategy and its supporting signal libraries.
Trenddirection

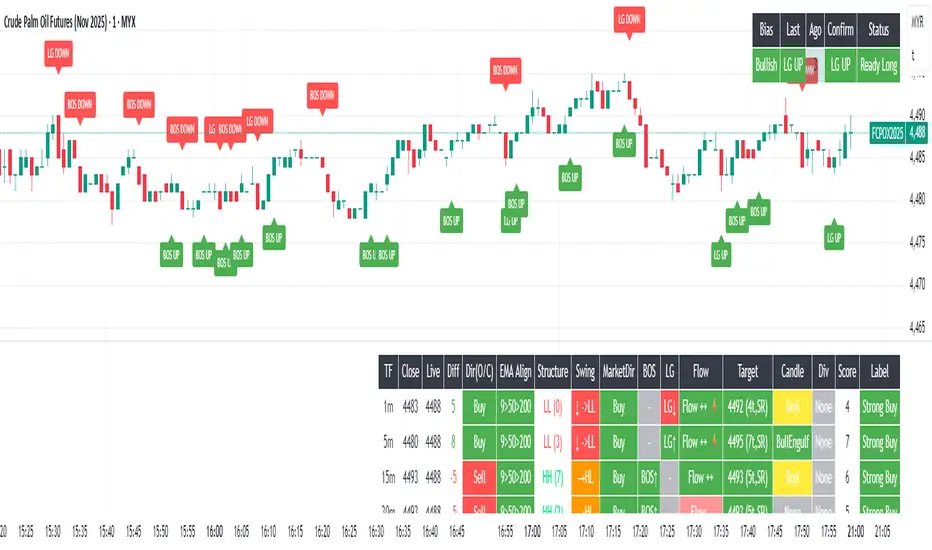
Multi-Timeframe Dashboard INDIpendence AAZ is a powerful Multi-Timeframe Dashboard that provides real-time readings of:
✔ Market Structure
✔ Market Direction
✔ Entry Signals
This tool is designed for Derivatives (Soy, FCPO, etc.), Forex, Crypto, and Global Markets.
Perfect for new traders and those who do not have the time to study charts in detail.
⚠️ Disclaimer: This indicator is for educational and analytical purposes only. All trading decisions and risks remain with the user.
Trend CandlesTrend Candles
Overview
The Trend Candles indicator is a simple yet effective tool designed to help traders visually identify the prevailing market trend. By combining candle coloring with a trend-based Exponential Moving Average (EMA), it enhances chart readability and makes trend-following strategies easier to apply.
Concepts
Exponential Moving Average (EMA): The EMA is a moving average that places more weight on recent price data. It reacts faster to price changes compared to a Simple Moving Average (SMA), making it well-suited for trend detection.
Trend Determination:
- If the EMA is rising (current EMA > previous EMA), the market is considered bullish.
- If the EMA is falling (current EMA < previous EMA), the market is considered bearish.
- If the EMA is flat (no significant change), no trend color is applied.
Candle Coloring:
- Green candles = Uptrend
- Purple candles = Downtrend
- Default candles = Sideways/Flat EMA
Features
- Trend Visualization: Candles automatically change color based on EMA slope, making it easy to spot bullish and bearish phases.
- Customizable EMA Length: The trader can set the EMA period (default is 50), allowing flexibility for short-term or long-term trend analysis.
- Overlay EMA Line: An orange EMA line is plotted on the chart for additional confirmation of the trend.
- Clean & Minimalist: Focuses on trend clarity without cluttering the chart with unnecessary signals.
How to Use
1. Apply the indicator to your chart.
2. Adjust the EMA Length as per your trading style (shorter = faster signals, longer = smoother trend).
3. Follow the candle color:
- Green = Favor long entries.
- Purple = Favor short entries.
- No color = Stay cautious, as trend is unclear.
4. Use with other confirmation tools (support/resistance, volume, or oscillators).
5. Users are encouraged to experiment with different EMA lengths. The default length is 50, but you can explore other values based on your needs. In particular, try Fibonacci numbers such as 13, 21, 34, 55, 89, 144, and 233 to observe how trends behave differently.
Disclaimer
The information provided by the Trend Candles indicator is for educational purposes only. It should not be considered financial advice. Trading involves substantial risk, and past performance is not necessarily indicative of future results. Always do your own research and use risk management practices.

TradeDots - Buy Sell Signals ProThe TradeDots - Buy Sell Signals Pro is an advanced technical analysis tool engineered to identify key market turning points and trend continuations. By combining multiple confirmation methods, this indicator provides traders with a comprehensive system for recognizing high-probability entry and exit points across various market conditions.
📝 HOW IT WORKS
Enhanced Supertrend Implementation
Unlike the traditional Supertrend indicator that simply changes color when price crosses above or below a calculated line, our implementation incorporates multiple layers of confirmation:
Advanced Calculation: Uses an enhanced ATR-based algorithm that incorporates trend bias detection and momentum filtering
Multi-Factor Confirmation: Considers price interaction with previous Supertrend values, not just current crossovers
Contextual Awareness: Distinguishes between different entry types based on market risk levels and momentum conditions
Visual Enhancement: Provides background shading to clearly indicate trend direction and strength
Smart Trendline Algorithm
The indicator employs a proprietary Smart Trendline that adapts to market conditions using an advanced moving average system. Unlike traditional moving averages that simply track price, the Smart Trendline incorporates volatility data to change colors based on momentum strength, providing immediate visual feedback about the current market phase with zero lag.
Calculation: Processes price data through selectable advanced calculation methods (including Hull, Jurik, and McGinley averages) with dynamic color-coding based on a modified Keltner Channel system.
Visualization: Green indicates strong bullish momentum, purple represents bearish momentum, and gray signals consolidation or uncertain conditions.
Multi-Signal Confirmation System
The indicator integrates three distinct signal mechanisms to confirm trading opportunities:
1. RSI-Sequential Reversal Signals: Combines RSI levels with seq count patterns to identify potential short-term reversals.
Calculation: Analyzes RSI conditions against specific thresholds while tracking consecutive pattern formations.
Visualization: Green triangles for buy signals and red triangles for sell signals.
2. Statistical Reversal Signals: Identifies statistically significant deviations from normal price behavior.
Calculation: Uses a modified standard deviation approach to determine when price has moved too far from its statistical average.
Visualization: Large green arrows emoji for powerful buy signals and red arrows emoji for powerful sell signals.
3. Supply & Demand Zone Detection: Automatically identifies key price levels where significant buying or selling pressure may exist.
Calculation: Uses RSI extremes combined with confirmation periods to establish high-probability reversal zones.
Visualization: Green-filled areas mark support (demand) zones and red-filled areas mark resistance (supply) zones.
Buy/Sell Signal Generation
The system generates several types of signals with varying strengths:
1. Regular Buy/Sell Signals: Generated when:
Price crosses with MA above/below the Supertrend line
RSI conditions confirm the direction
Candlestick patterns support the signal direction (bullish/bearish candle formation)
Visualized as green/red triangles
2. Strong Buy/Sell Signals: Appear when multiple confirmation factors align:
Regular buy/sell condition is met
Price is interacting with a Supply/Demand zone
Additional momentum confirmation from auxiliary indicators
Seq count reaches significant levels
Statistical Reversal signal confirms the direction
3. Breakout Signals: Special case signals that appear during:
Trend transitions after consolidation
When price breaks through significant resistance/support levels from previous trend
Following pattern completions that suggest increased momentum
Market Structure Analysis
The indicator categorizes market conditions and provides visual cues for traders:
Trend Identification: Supertrend-based algorithm with enhanced visual presentation identifies the prevailing market direction.
Bar Coloring System: Candles change color based on price position relative to EMAs to clearly display strength and direction of momentum
🛠️ HOW TO USE
Signal Interpretation
Buy Signals: "Buy" signals, Green triangles (RSI-Sequential) and large green arrows (Statistical Reversals) appear at potential buy points.
Sell Signals: "Sell" signals, Red triangles (RSI-Sequential) and large red arrows (Statistical Reversals) appear at potential sell points.
Highest Probability Entries: Occur when signals appear near or within Supply & Demand zones.
Trading Strategies
Trend-Following Strategy
1. Identify the main trend using the Smart Trendline color
2. Enter long positions during uptrends when:
Price pulls back to the Smart Trendline
Green triangles or arrows appear
Signals occur near green demand zones
3. Enter short positions during downtrends when:
Price bounces up to the Smart Trendline
Red triangles or arrows appear
Signals occur near red supply zones
Counter-Trend/Reversal Strategy
1. Look for Statistical Reversal arrows at significant price extremes
2. Confirm with an RSI-Sequential signal in the same direction
3. Pay special attention when these signals appear inside Supply & Demand zones
4. Use the Smart Trendline color change as additional confirmation
Multiple Confirmation Technique
For highest probability trades, look for:
Signal alignment (both signal types in same direction)
Supply/Demand zone interaction
Smart Trendline color supporting the signal direction
❗️LIMITATIONS
Signal Lag: The system identifies reversals after they have begun, potentially missing the absolute bottom or top.
False Signals: Can occur during periods of high volatility or range-bound markets.
Timeframe Sensitivity: Some signals work better on higher timeframes for long-term trading, while others are more effective on lower timeframes for short-term trading.
Bar Closing Requirement: All signals are based on closed candles and may be subject to change until the candle closes.
RISK DISCLAIMER
Trading involves substantial risk, and most traders may incur losses. All content, tools, scripts, articles, and education provided by TradeDots are for informational and educational purposes only. Past performance is not indicative of future results.
This indicator should be used as part of a complete trading approach that includes proper risk management, consideration of the broader market context, and confirmation from price action patterns. No trading system can guarantee profits, and users should always exercise caution and use appropriate position sizing.

Trend Matrix - XTrend Matrix - X: Advanced Market Trend Analysis
Introduction: Trend Matrix - X is a powerful indicator designed to provide a comprehensive view of market trends, state transitions, and dynamics. By integrating advanced algorithms, statistical methods, and smoothing techniques, it identifies Bullish, Bearish, or Ranging market states while offering deep insights into trend behavior.
This indicator is ideal for traders seeking a balance between noise reduction and real-time responsiveness, with configurations that adapt dynamically to market conditions.
How It Works?
The indicator combines K-Median Clustering, Kalman Filtering, Fractal Dimension Analysis, and various regression techniques to provide actionable insights.
Market State Detection
- Divides data into three clusters: Bullish, Bearish, and Ranging.
- Uses K-Median Clustering to partition data based on medians, ensuring robust state classification even in volatile markets.
- Slope-Based Trend Analysis: Calculates trend slopes using Linear, Polynomial, or Exponential Regression. The slope represents the trend direction and strength, updated dynamically based on market conditions. It can apply Noise Reduction with Kalman Filter to balance stability and sensitivity
Dynamic Lookback Adjustment
- Automatically adjusts the analysis window length based on market stability, volatility, skewness, and kurtosis.
- This feature ensures the indicator remains responsive in fast-moving markets while providing stability in calmer conditions.
Fractal Dimension Measurement
- Calculates Katz Fractal Dimension to assess market roughness and choppiness.
- Helps identify periods of trend consistency versus noisy, range-bound markets.
Why Use Trend Matrix - X?
- Actionable Market States: Quickly determine whether the market is Bullish, Bearish, or Ranging.
- Advanced Smoothing: Reduces noise while maintaining trend-following precision.
- Dynamic Adaptation: Automatically adjusts to market conditions for consistent performance across varying environments.
- Customization: Configure regression type, lookback dynamics, and smoothing to suit your trading style.
- Integrated Visualization: Displays trend states, fractal dimensions, and cluster levels directly on the chart.
Configuration Options
Matrix Type (Raw or Filtered)
- Raw shows the unfiltered slope for real-time precision.
- Filtered applies Kalman smoothing for long-term trend clarity.
Regression Type
- Choose Linear, Polynomial, or Exponential Regression to calculate slopes based on your market strategy.
Dynamic Lookback Adjustment
- Enable Gradual Adjustment to smoothly adapt lookback periods in response to market volatility.
Noise Smoothing
- Toggle Smooth Market Noise to apply advanced filtering, balancing stability with responsiveness.
Cluster State Detection
- Visualize the current state of the market by coloring the candles to match the detected state.
How to Use the Trend Matrix - X Indicator
Step-by-Step Guide
Add the Indicator to Your Chart
- Once applied, it will display: Trend line (Trend Matrix) for identifying market direction, A state table showing the current market state (Bullish, Bearish, or Ranging), Cluster levels (High, Mid, and Low) for actionable price areas, Fractal dimension metrics to assess market choppiness or trend consistency.
Configure Your Settings
- Matrix Source (Raw vs. Filtered): Raw Matrix : Displays real-time, unsmoothed slope values for immediate precision. Ideal for fast-moving markets where rapid changes need to be tracked. Filtered Matrix : Applies advanced smoothing (Kalman Filter) for a clearer trend representation. Recommended for longer-term analysis or noisy markets
- Regression Type (Choose how the trend slope is calculated): Linear Regression : Tracks the average linear rate of change. Best for stable, straightforward trends. Polynomial Regression : Captures accelerating or decelerating trends with a curved fit. Ideal for dynamic, cyclical markets. Exponential Regression : Highlights compounding growth or decay rates. Perfect for parabolic trends or exponential moves.
- Market Noise Smoothing: Applies an adaptive (no lag) smoothing technique to the Matrix Source.
- Gradual Lookback Adjustment: Enable "Gradually Adjust Lookback" to allow the indicator to dynamically adapt its analysis window. (Indicator already does an automatic window, this just refines it).
Read the Outputs
- Trend Matrix Line: Upward Line (Bullish): Market is trending upward; look for buy opportunities. Downward Line (Bearish): Market is trending downward; look for sell opportunities.
- Cluster Levels: High Level (Cluster 0): Represents the upper bound of the trend, often used as a resistance level. Mid Level (Cluster 2): Serves as a key equilibrium point in the trend. Low Level (Cluster 1): Indicates the lower bound of the trend, often used as a support level.
- Market State Table: Displays the current state of the market. Bullish State: Strong upward trend, suitable for long positions. Bearish State: Strong downward trend, suitable for short positions. Ranging State: Sideways market, suitable for range-bound strategies.
- Fractal Dimension Analysis: Low Fractal Dimension (< 1.6): Indicates strong trend behavior; look for trend-following setups. High Fractal Dimension (> 1.6): Suggests choppy, noisy markets; focus on range-trading strategies.
Advanced Usage
- Adaptive Clustering: The indicator uses K-Median Clustering to dynamically identify Bullish, Bearish, and Ranging states based on market data. For traders interested in state transitions, monitor the cluster levels and the state table for actionable changes.
Trading Strategies
- Trend-Following: Use the Filtered Matrix and Fractal Dimension (< 1.6) to identify and follow strong trends. Enter long positions in Bullish States and short positions in Bearish States.
Disclaimer
I am not a professional market analyst, financial advisor, or trading expert. This indicator, Trend Matrix - X, is the result of personal research and development, created with the intention of contributing something that the trading community might find helpful.
It is important to note that this tool is experimental and provided "as-is" without any guarantees of accuracy, profitability, or suitability for any particular trading strategy. Trading involves significant financial risk, and past performance is not indicative of future results.
Users should exercise caution and use their own discretion when incorporating this indicator into their trading decisions. Always consult with a qualified financial advisor before making any financial or trading decisions.
By using this indicator, you acknowledge and accept full responsibility for your trading activities and outcomes. This tool is intended for educational and informational purposes only.

Bollinger Bands color candlesThis Pine Script indicator applies Bollinger Bands to the price chart and visually highlights candles based on their proximity to the upper and lower bands. The script plots colored candles as follows:
Bullish Close Above Upper Band: Candles are colored green when the closing price is above the upper Bollinger Band, indicating strong bullish momentum.
Bearish Close Below Lower Band: Candles are colored red when the closing price is below the lower Bollinger Band, signaling strong bearish momentum.
Neutral Candles: Candles that close within the bands remain their default color.
This visual aid helps traders quickly identify potential breakout or breakdown points based on Bollinger Band dynamics.

Trend Speed Analyzer (Zeiierman)█ Overview
The Trend Speed Analyzer by Zeiierman is designed to measure the strength and speed of market trends, providing traders with actionable insights into momentum dynamics. By combining a dynamic moving average with wave and speed analysis, it visually highlights shifts in trend direction, market strength, and potential reversals. This tool is ideal for identifying breakout opportunities, gauging trend consistency, and understanding the dominance of bullish or bearish forces over various timeframes.
█ How It Works
The indicator employs a Dynamic Moving Average (DMA) enhanced with an Accelerator Factor, allowing it to adapt dynamically to market conditions. The DMA is responsive to price changes, making it suitable for both long-term trends and short-term momentum analysis.
Key components include:
Trend Speed Analysis: Measures the speed of market movements, highlighting momentum shifts with visual cues.
Wave Analysis: Tracks bullish and bearish wave sizes to determine market strength and bias.
Normalized Speed Values: Ensures consistency across different market conditions by adjusting for volatility.
⚪ Average Wave and Max Wave
These metrics analyze the size of bullish and bearish waves over a specified Lookback Period:
Average Wave: This represents the mean size of bullish and bearish movements, helping traders gauge overall market strength.
Max Wave: Highlights the largest movements within the period, identifying peak momentum during trend surges.
⚪ Current Wave Ratio
This feature compares the current wave's size against historical data:
Average Wave Ratio: Indicates if the current momentum exceeds historical averages. A value above 1 suggests the trend is gaining strength.
Max Wave Ratio: Shows whether the current wave surpasses previous peak movements, signaling potential breakouts or trend accelerations.
⚪ Dominance
Dominance metrics reveal whether bulls or bears have controlled the market during the Lookback Period:
Average Dominance: Compares the net difference between average bullish and bearish wave sizes.
Max Dominance: Highlights which side had the stronger individual waves, indicating key power shifts in market dynamics.
Positive values suggest bullish dominance, while negative values point to bearish control. This helps traders confirm trend direction or anticipate reversals.
█ How to Use
Identify Trends: Leverage the color-coded candlesticks and dynamic trend line to assess the overall market direction with clarity.
Monitor Momentum: Use the Trend Speed histogram to track changes in momentum, identifying periods of acceleration or deceleration.
Analyze Waves: Compare the sizes of bullish and bearish waves to identify the prevailing market bias and detect potential shifts in sentiment. Additionally, fluctuations in Current Wave ratio values should be monitored as early indicators of possible trend reversals.
Evaluate Dominance: Utilize dominance metrics to confirm the strength and direction of the current trend.
█ Settings
Maximum Length: Sets the smoothing of the trend line.
Accelerator Multiplier: Adjusts sensitivity to price changes.
Lookback Period: Defines the range for wave calculations.
Enable Table: Displays statistical metrics for in-depth analysis.
Enable Candles: Activates color-coded candlesticks.
Collection Period: Normalizes trend speed values for better accuracy.
Start Date: Limits calculations to a specific timeframe.
Timer Option: Choose between using all available data or starting from a custom date.
-----------------
Disclaimer
The information contained in my Scripts/Indicators/Ideas/Algos/Systems does not constitute financial advice or a solicitation to buy or sell any securities of any type. I will not accept liability for any loss or damage, including without limitation any loss of profit, which may arise directly or indirectly from the use of or reliance on such information.
All investments involve risk, and the past performance of a security, industry, sector, market, financial product, trading strategy, backtest, or individual's trading does not guarantee future results or returns. Investors are fully responsible for any investment decisions they make. Such decisions should be based solely on an evaluation of their financial circumstances, investment objectives, risk tolerance, and liquidity needs.
My Scripts/Indicators/Ideas/Algos/Systems are only for educational purposes!

RSI Trail [UAlgo]The RSI Trail indicator is a technical analysis tool designed to assist traders in making informed decisions by utilizing the Relative Strength Index (RSI) and various moving average calculations. This indicator dynamically plots support and resistance levels based on RSI values, providing visual cues for potential bullish and bearish signals. The inclusion of a trailing stop mechanism allows traders to adapt to market volatility, ensuring optimal entry and exit points.
🔶 Key Features
Multiple Moving Average Types: Choose from Simple Moving Average (SMA), Exponential Moving Average (EMA), Weighted Moving Average (WMA), Running Moving Average (RMA), and McGinley Dynamic for diverse analytical approaches.
Configurable RSI Bounds: Tailor the RSI lower and upper bounds to your specific trading preferences, with default settings at 40 and 60.
Signals: The indicator determines bullish and bearish market states and plots corresponding signals on the chart.
Customizable Visualization: Options to display the midline and color candles based on market state enhance visual analysis.
Alerts: Integrated alert conditions notify you of bullish and bearish signals.
🔶 Calculations
The RSI Trail indicator calculates dynamic support and resistance levels using a combination of moving averages and the Relative Strength Index (RSI). It starts by computing a chosen moving average (SMA, EMA, WMA, RMA, or McGinley) over a period of 27 using the typical price (ohlc4).
The indicator then defines upper and lower bounds based on customizable RSI levels (default 40 and 60) and adjusts these bounds using the Average True Range (ATR) to account for market volatility. The upper bound is calculated by adding a volatility-adjusted value to the moving average, while the lower bound is found by subtracting this value. Bullish signals occur when the price crosses above the upper bound, and bearish signals when it falls below the lower bound.
The RSI Trail indicator also can be used to identify pullback opportunities. When the price high/low crosses above/below the calculated upper/lower bound, it indicates a potential pullback, suggesting a favorable point to enter a trade during a pullback.
🔶 Disclaimer
This indicator is for informational purposes only and should not be considered financial advice.
Always conduct your own research and due diligence before making any trading decisions. Past performance is not necessarily indicative of future results.

RSI Trend Detector PSAR BasedRSI Trend Detector is based on the Direction of PSAR. This indicator helps the easy detection of Trend Direction and Sideways Movement of Price. It was difficult to determine the RSI Trend Direction in a basic RSI indicator. one cannot decide the exact entry point where to enter.
RSI Trend Detector helps with the direction of trend using PSAR direction which is almost instant direction changing indicator with Zero Lag. The color of the RSI changes immediately based on PSAR direction. One can determine the trend whether its in UP / Down or Sideways.
One can easily detect Pullback and entry points using this indicator.
The basic working can be interpreted with a normal default RSI, The only additional feature is the direction of trend using a SAR signal.
Oversold Zone is below 30
Overbought Zone is above 70
how ever RSI above 50 is treated a UP trend and Below 50 as Down Trend.
when RSI is between 40 and 60 price must be considered as Sideways. One can easily interpret the TREND.
Yellow Line = RSI Moving Average
RED and Green Line= RSI
Grey Zone = Sideways
Horizontal line = RSI level 50
Settings can be changed as required.
RSI Line:
RSI Above 50 up trend and Entry when color is green
RSI Below 50 down trend and Entry when color is Red
RSI in Grey Zone is sideways, wait for a breakout
RSI above 50 and color is red then its a pullback in uptrend
RSI below 50 and color is green then its a pullback in downtrend
ALERTS:
Up signal and Down Signal are provided when ever RSI crosses RSIMA
Up Signal: RSI crosses RSI Moving Average upwards
Down Signal: RSI crosses RSI Moving Average Downwards
Hope the Tradingview community likes this.

GKD-C Trend Direction [Loxx]The Giga Kaleidoscope GKD-C Trend Direction is a confirmation module included in Loxx's "Giga Kaleidoscope Modularized Trading System."
█ GKD-C Trend Direction
Trend Direction relies both on the Average True Range (ATR) – a measure of market volatility – and the market's closing price. If ATR Smoothing is set to greater than 0, the ATR is smoothed using an Exponential Moving Average (EMA). This ATR is then multiplied by a factor to derive a threshold. Using this threshold and the market's close price, the code determines the position of the plotted line. The plotted line's color changes based on the close price's relationship to this derived value: green if the close price is above, and red if below, signifying the trend's upward or downward direction respectively.
█ Giga Kaleidoscope Modularized Trading System
Core components of an NNFX algorithmic trading strategy
The NNFX algorithm is built on the principles of trend, momentum, and volatility. There are six core components in the NNFX trading algorithm:
1. Volatility - price volatility; e.g., Average True Range, True Range Double, Close-to-Close, etc.
2. Baseline - a moving average to identify price trend
3. Confirmation 1 - a technical indicator used to identify trends
4. Confirmation 2 - a technical indicator used to identify trends
5. Continuation - a technical indicator used to identify trends
6. Volatility/Volume - a technical indicator used to identify volatility/volume breakouts/breakdown
7. Exit - a technical indicator used to determine when a trend is exhausted
8. Metamorphosis - a technical indicator that produces a compound signal from the combination of other GKD indicators*
*(not part of the NNFX algorithm)
What is Volatility in the NNFX trading system?
In the NNFX (No Nonsense Forex) trading system, ATR (Average True Range) is typically used to measure the volatility of an asset. It is used as a part of the system to help determine the appropriate stop loss and take profit levels for a trade. ATR is calculated by taking the average of the true range values over a specified period.
True range is calculated as the maximum of the following values:
-Current high minus the current low
-Absolute value of the current high minus the previous close
-Absolute value of the current low minus the previous close
ATR is a dynamic indicator that changes with changes in volatility. As volatility increases, the value of ATR increases, and as volatility decreases, the value of ATR decreases. By using ATR in NNFX system, traders can adjust their stop loss and take profit levels according to the volatility of the asset being traded. This helps to ensure that the trade is given enough room to move, while also minimizing potential losses.
Other types of volatility include True Range Double (TRD), Close-to-Close, and Garman-Klass
What is a Baseline indicator?
The baseline is essentially a moving average, and is used to determine the overall direction of the market.
The baseline in the NNFX system is used to filter out trades that are not in line with the long-term trend of the market. The baseline is plotted on the chart along with other indicators, such as the Moving Average (MA), the Relative Strength Index (RSI), and the Average True Range (ATR).
Trades are only taken when the price is in the same direction as the baseline. For example, if the baseline is sloping upwards, only long trades are taken, and if the baseline is sloping downwards, only short trades are taken. This approach helps to ensure that trades are in line with the overall trend of the market, and reduces the risk of entering trades that are likely to fail.
By using a baseline in the NNFX system, traders can have a clear reference point for determining the overall trend of the market, and can make more informed trading decisions. The baseline helps to filter out noise and false signals, and ensures that trades are taken in the direction of the long-term trend.
What is a Confirmation indicator?
Confirmation indicators are technical indicators that are used to confirm the signals generated by primary indicators. Primary indicators are the core indicators used in the NNFX system, such as the Average True Range (ATR), the Moving Average (MA), and the Relative Strength Index (RSI).
The purpose of the confirmation indicators is to reduce false signals and improve the accuracy of the trading system. They are designed to confirm the signals generated by the primary indicators by providing additional information about the strength and direction of the trend.
Some examples of confirmation indicators that may be used in the NNFX system include the Bollinger Bands, the MACD (Moving Average Convergence Divergence), and the MACD Oscillator. These indicators can provide information about the volatility, momentum, and trend strength of the market, and can be used to confirm the signals generated by the primary indicators.
In the NNFX system, confirmation indicators are used in combination with primary indicators and other filters to create a trading system that is robust and reliable. By using multiple indicators to confirm trading signals, the system aims to reduce the risk of false signals and improve the overall profitability of the trades.
What is a Continuation indicator?
In the NNFX (No Nonsense Forex) trading system, a continuation indicator is a technical indicator that is used to confirm a current trend and predict that the trend is likely to continue in the same direction. A continuation indicator is typically used in conjunction with other indicators in the system, such as a baseline indicator, to provide a comprehensive trading strategy.
What is a Volatility/Volume indicator?
Volume indicators, such as the On Balance Volume (OBV), the Chaikin Money Flow (CMF), or the Volume Price Trend (VPT), are used to measure the amount of buying and selling activity in a market. They are based on the trading volume of the market, and can provide information about the strength of the trend. In the NNFX system, volume indicators are used to confirm trading signals generated by the Moving Average and the Relative Strength Index. Volatility indicators include Average Direction Index, Waddah Attar, and Volatility Ratio. In the NNFX trading system, volatility is a proxy for volume and vice versa.
By using volume indicators as confirmation tools, the NNFX trading system aims to reduce the risk of false signals and improve the overall profitability of trades. These indicators can provide additional information about the market that is not captured by the primary indicators, and can help traders to make more informed trading decisions. In addition, volume indicators can be used to identify potential changes in market trends and to confirm the strength of price movements.
What is an Exit indicator?
The exit indicator is used in conjunction with other indicators in the system, such as the Moving Average (MA), the Relative Strength Index (RSI), and the Average True Range (ATR), to provide a comprehensive trading strategy.
The exit indicator in the NNFX system can be any technical indicator that is deemed effective at identifying optimal exit points. Examples of exit indicators that are commonly used include the Parabolic SAR, the Average Directional Index (ADX), and the Chandelier Exit.
The purpose of the exit indicator is to identify when a trend is likely to reverse or when the market conditions have changed, signaling the need to exit a trade. By using an exit indicator, traders can manage their risk and prevent significant losses.
In the NNFX system, the exit indicator is used in conjunction with a stop loss and a take profit order to maximize profits and minimize losses. The stop loss order is used to limit the amount of loss that can be incurred if the trade goes against the trader, while the take profit order is used to lock in profits when the trade is moving in the trader's favor.
Overall, the use of an exit indicator in the NNFX trading system is an important component of a comprehensive trading strategy. It allows traders to manage their risk effectively and improve the profitability of their trades by exiting at the right time.
What is an Metamorphosis indicator?
The concept of a metamorphosis indicator involves the integration of two or more GKD indicators to generate a compound signal. This is achieved by evaluating the accuracy of each indicator and selecting the signal from the indicator with the highest accuracy. As an illustration, let's consider a scenario where we calculate the accuracy of 10 indicators and choose the signal from the indicator that demonstrates the highest accuracy.
The resulting output from the metamorphosis indicator can then be utilized in a GKD-BT backtest by occupying a slot that aligns with the purpose of the metamorphosis indicator. The slot can be a GKD-B, GKD-C, or GKD-E slot, depending on the specific requirements and objectives of the indicator. This allows for seamless integration and utilization of the compound signal within the GKD-BT framework.
How does Loxx's GKD (Giga Kaleidoscope Modularized Trading System) implement the NNFX algorithm outlined above?
Loxx's GKD v2.0 system has five types of modules (indicators/strategies). These modules are:
1. GKD-BT - Backtesting module (Volatility, Number 1 in the NNFX algorithm)
2. GKD-B - Baseline module (Baseline and Volatility/Volume, Numbers 1 and 2 in the NNFX algorithm)
3. GKD-C - Confirmation 1/2 and Continuation module (Confirmation 1/2 and Continuation, Numbers 3, 4, and 5 in the NNFX algorithm)
4. GKD-V - Volatility/Volume module (Confirmation 1/2, Number 6 in the NNFX algorithm)
5. GKD-E - Exit module (Exit, Number 7 in the NNFX algorithm)
6. GKD-M - Metamorphosis module (Metamorphosis, Number 8 in the NNFX algorithm, but not part of the NNFX algorithm)
(additional module types will added in future releases)
Each module interacts with every module by passing data to A backtest module wherein the various components of the GKD system are combined to create a trading signal.
That is, the Baseline indicator passes its data to Volatility/Volume. The Volatility/Volume indicator passes its values to the Confirmation 1 indicator. The Confirmation 1 indicator passes its values to the Confirmation 2 indicator. The Confirmation 2 indicator passes its values to the Continuation indicator. The Continuation indicator passes its values to the Exit indicator, and finally, the Exit indicator passes its values to the Backtest strategy.
This chaining of indicators requires that each module conform to Loxx's GKD protocol, therefore allowing for the testing of every possible combination of technical indicators that make up the six components of the NNFX algorithm.
What does the application of the GKD trading system look like?
Example trading system:
Backtest: Multi-Ticker CC Backtest
Baseline: Hull Moving Average
Volatility/Volume: Hurst Exponent
Confirmation 1: Advance Trend Pressure as shown on the chart above
Confirmation 2: uf2018
Continuation: Coppock Curve
Exit: Rex Oscillator
Metamorphosis: Baseline Optimizer
Each GKD indicator is denoted with a module identifier of either: GKD-BT, GKD-B, GKD-C, GKD-V, GKD-M, or GKD-E. This allows traders to understand to which module each indicator belongs and where each indicator fits into the GKD system.
█ Giga Kaleidoscope Modularized Trading System Signals
Standard Entry
1. GKD-C Confirmation gives signal
2. Baseline agrees
3. Price inside Goldie Locks Zone Minimum
4. Price inside Goldie Locks Zone Maximum
5. Confirmation 2 agrees
6. Volatility/Volume agrees
1-Candle Standard Entry
1a. GKD-C Confirmation gives signal
2a. Baseline agrees
3a. Price inside Goldie Locks Zone Minimum
4a. Price inside Goldie Locks Zone Maximum
Next Candle
1b. Price retraced
2b. Baseline agrees
3b. Confirmation 1 agrees
4b. Confirmation 2 agrees
5b. Volatility/Volume agrees
Baseline Entry
1. GKD-B Baseline gives signal
2. Confirmation 1 agrees
3. Price inside Goldie Locks Zone Minimum
4. Price inside Goldie Locks Zone Maximum
5. Confirmation 2 agrees
6. Volatility/Volume agrees
7. Confirmation 1 signal was less than 'Maximum Allowable PSBC Bars Back' prior
1-Candle Baseline Entry
1a. GKD-B Baseline gives signal
2a. Confirmation 1 agrees
3a. Price inside Goldie Locks Zone Minimum
4a. Price inside Goldie Locks Zone Maximum
5a. Confirmation 1 signal was less than 'Maximum Allowable PSBC Bars Back' prior
Next Candle
1b. Price retraced
2b. Baseline agrees
3b. Confirmation 1 agrees
4b. Confirmation 2 agrees
5b. Volatility/Volume agrees
Volatility/Volume Entry
1. GKD-V Volatility/Volume gives signal
2. Confirmation 1 agrees
3. Price inside Goldie Locks Zone Minimum
4. Price inside Goldie Locks Zone Maximum
5. Confirmation 2 agrees
6. Baseline agrees
7. Confirmation 1 signal was less than 7 candles prior
1-Candle Volatility/Volume Entry
1a. GKD-V Volatility/Volume gives signal
2a. Confirmation 1 agrees
3a. Price inside Goldie Locks Zone Minimum
4a. Price inside Goldie Locks Zone Maximum
5a. Confirmation 1 signal was less than 'Maximum Allowable PSVVC Bars Back' prior
Next Candle
1b. Price retraced
2b. Volatility/Volume agrees
3b. Confirmation 1 agrees
4b. Confirmation 2 agrees
5b. Baseline agrees
Confirmation 2 Entry
1. GKD-C Confirmation 2 gives signal
2. Confirmation 1 agrees
3. Price inside Goldie Locks Zone Minimum
4. Price inside Goldie Locks Zone Maximum
5. Volatility/Volume agrees
6. Baseline agrees
7. Confirmation 1 signal was less than 7 candles prior
1-Candle Confirmation 2 Entry
1a. GKD-C Confirmation 2 gives signal
2a. Confirmation 1 agrees
3a. Price inside Goldie Locks Zone Minimum
4a. Price inside Goldie Locks Zone Maximum
5a. Confirmation 1 signal was less than 'Maximum Allowable PSC2C Bars Back' prior
Next Candle
1b. Price retraced
2b. Confirmation 2 agrees
3b. Confirmation 1 agrees
4b. Volatility/Volume agrees
5b. Baseline agrees
PullBack Entry
1a. GKD-B Baseline gives signal
2a. Confirmation 1 agrees
3a. Price is beyond 1.0x Volatility of Baseline
Next Candle
1b. Price inside Goldie Locks Zone Minimum
2b. Price inside Goldie Locks Zone Maximum
3b. Confirmation 1 agrees
4b. Confirmation 2 agrees
5b. Volatility/Volume agrees
Continuation Entry
1. Standard Entry, 1-Candle Standard Entry, Baseline Entry, 1-Candle Baseline Entry, Volatility/Volume Entry, 1-Candle Volatility/Volume Entry, Confirmation 2 Entry, 1-Candle Confirmation 2 Entry, or Pullback entry triggered previously
2. Baseline hasn't crossed since entry signal trigger
4. Confirmation 1 agrees
5. Baseline agrees
6. Confirmation 2 agrees

RAINBOW AVERAGES - INDICATOR - (AS) - 1/3
-INTRODUCTION:
This is the first of three scripts I intend to publish using rainbow indicators. This script serves as a groundwork for the other two. It is a RAINBOW MOVING AVERAGES indicator primarily designed for trend detection. The upcoming script will also be an indicator but with overlay=false (below the chart, not on it) and will utilize RAINBOW BANDS and RAINBOW OSCILLATOR. The third script will be a strategy combining all of them.
RAINBOW moving averages can be used in various ways, but this script is mainly intended for trend analysis. It is meant to be used with overlay=true, but if the user wishes, it can be viewed below the chart. To achieve this, you need to change the code from overlay=true to false and turn off the first switch that plots the rainbow on the chart (or simply move the indicator to a new pane below). By doing this, you will be able to see how all four conditions used to detect trends work on the chart. But let's not get ahead of ourselves.
-WHAT IS IT:
In its simplest form, this indicator uses 10 moving averages colored like a rainbow. The calculation is as follows:
MA0: This is the main moving average and can be defined with the type (SMA, EMA, RMA, WMA, SINE), length, and price source. However, the second moving average (MA1) is calculated using MA0 as its source, MA2 uses MA1 as the data source, and so on, until the last one, MA9. Hence, there are 10 moving averages. The first moving average is special as all the others derive from it. This indicator has many potential uses, such as entry/exit signals, volatility indication, and stop-loss placement, but for now, we will focus on trend detection.
-TREND DETECTION:
The indicator offers four different background color options based on the user's preference:
0-NONE: No background color is applied as no trend detection tools is being used (boring)
1-CHANGE: The background color is determined by summing the changes of all 10 moving averages (from two bars). If the sum is positive and not falling, the background color is GREEN. If the sum is negative and not rising, the background color is RED. From early testing, it works well for the beginning of a movement but not so much for a lasting trend.
2-RAINBW: The background color is green when all the moving averages are in ascending order, indicating a bullish trend. It is red when all the moving averages are in descending order, indicating a bearish trend. For example, if MA1>MA2>MA3>MA4..., the background color is green. If MA1 threshold, and red indicates width < -threshold.
4-DIRECT: The background color is determined by counting the number of moving averages that are either above or below the input source. If the specified number of moving averages is above the source, the background color is green. If the specified number of moving averages is below the source, the background color is red. If all ten MAs are below the price source, the indicator will show 10, and if all ten MAs are above, it will show -10. The specific value will be set later in the settings (same for 3-TSHOLD variant). This method works well for lasting trends.
Note: If the indicator is turned into a below-chart version, all four color options can be seen as separate indicators.
-PARAMETERS - SETTINGS:
The first line is an on/off switch to plot the skittles indicator (and some info in the tooltip). The second line has already been discussed, which is the background color and the selection of the source (only used for MA0!).
The line "MA1: TYP/LEN" is where we define the parameters of MA0 (important). We choose from the types of moving averages (SMA, EMA, RMA, WMA, SINE) and set the length.
Important Note: It says MA1, but it should be MA0!.
The next line defines whether we want to smooth MA1 (which is actually MA0) and the period for smoothing. When smoothing is turned on, MA0 will be smoothed using a 3-pole super smoother. It's worth noting that although this only applies to MA0, as the other MAs are derived from it, they will also be smoothed.
In the line below, we define the type and length of MAs for MA2 (and other MAs except MA0). The same type and length are used for MA1 to MA9. It's important to remember that these values should be smaller. For example, if we set 55, it means that MA1 is the average of 55 periods of MA0, MA2 will be 55 periods of MA1, and so on. I encourage trying different combinations of MA types as it can be easily adjusted for ur type of trading. RMA looks quirky.
Moving on to the last line, we define some inputs for the background color:
TSH: The threshold value when using 3-TSHOLD-BGC. It's a good idea to change the chart to a pane below for easier adjustment. The default values are based on EURUSD-5M.
BG_DIR: The value that must be crossed or equal to the MA score if using 4-DIRECT-BGC. There are 10 MAs, so the maximum value is also 10. For example, if you set it to 9, it means that at least 9 MAs must be below/above the price for the script to detect a trend. Higher values are recommended as most of the time, this indicator oscillates either around the maximum or minimum value.
-SUMMARY OF SETTINGS:
L1 - PLOT MAs and general info tooltip
L2 - Select the source for MA0 and type of trend detection.
L3 - Set the type and length of MA0 (important).
L4 - Turn smoothing on/off for MA0 and set the period for super smoothing.
L5 - Set the type and length for the rest of the MAs.
L6 - Set values if using 4-DIRECT or 3-TSHOLD for the trend detection.
-OTHERS:
To see trend indicators, you need to turn off the plotting of MAs (first line), and then choose the variant you want for the background color. This will plot it on the chart below.
Keep in mind that M1 int settings stands for MA0 and MA2 for all of the 9 MAs left.
Yes, it may seem more complicated than it actually is. In a nutshell, these are 10 MAs, and each one after MA0 uses the previous one as its source. Plus few conditions for range detection. rest is mainly plots and colors.
There are tooltips to help you with the parameters.
I hope this will be useful to someone. If you have any ideas, feedback, or spot errors in the code, LET ME KNOW.
Stay tuned for the remaining two scripts using skittles indicators and check out my other scripts.
-ALSO:
I'm always looking for ideas for interesting indicators and strategies that I could code, so if you don't know Pinescript, just message me, and I would be glad to write your own indicator/strategy for free, obviously.
-----May the force of the market be with you, and until we meet again,

Trend Cloud [Tcs] | ALGO The TCS CLOUD has been developed to provide information about trend direction and potential buy/sell entry points in the market.
The cloud is a momentum and ATR-based indicator that removes all the noise that MAs usually provide, improving the simplicity of reading market direction. It can be adjusted based on a trader's own trading ideas through look-back adjustment and a multiplier.
Minor values are more indicated for scalpers.
It can be useful to find entry for trend continuation and has been designed to provide accurate points of retracement.
The middle line, based on Donchian concepts and plotted in dots, and candlestick color are based on the price action of highs and lows compared to past highs/lows.
Dots and candles can be green (strong bullish), light green (bullish), gray (non-directional), purple (strong bearish), and light purple (bearish).
Please note that this indicator is for educational purposes only and should not be used for trading without further testing and analysis.

Z Algo (Expo)█ Overview
Z Algo (Expo) is a sophisticated and user-friendly trading tool designed to meet the needs of both novice and seasoned traders. With its real-time signals, trend analysis, and risk management capabilities, this tool can be a valuable addition to any trader's toolkit.
█ Main Features & How to Use
Buy/Sell signals: Z Algo provides real-time buy and sell signals, which assist traders in identifying the most opportune moments to enter or exit a trade.
Strong Buy/Sell signals: In addition to regular buy and sell signals, the tool also offers strong buy and sell signals. These are generated when the market conditions align with a higher probability of a significant price movement.
Sniper Signals: This feature is specifically designed for contrarian traders who look to exploit temporary market inefficiencies or take advantage of price reversals. When enabled, Sniper Signals identify potential market turning points, offering traders the opportunity to profit from sharp price fluctuations.
Reversal Cloud: The Reversal Cloud is a unique visual representation of the market's potential trend reversals. It offers traders an easy-to-understand display of changing market dynamics, enabling them to quickly identify potential entry and exit points based on trend reversals.
Support and Resistance (S/R) Levels: Z Algo automatically calculates and displays support and resistance levels on the chart. These are crucial price points where buying or selling pressure may change, providing valuable insights for traders looking to enter or exit positions based on these levels.
Trend Tracker: This feature helps traders monitor and analyze the prevailing market trend. Trend Tracker identifies and highlights the direction of the trend, allowing traders to align their strategies accordingly and increase their chances of success.
Trend Background Color: To improve the user experience and simplify the interpretation of market data, Z Algo changes the chart's background color based on the identified trend direction. This visual cue makes it easier for traders to recognize bullish or bearish trends at a glance.
Bar Coloring: In addition to the trend background color, Z Algo also provides bar coloring for both contrarian and trend bars. This feature helps traders visualize price movements and trends more effectively, enabling them to identify potential opportunities for both trend-following and contrarian trading strategies.
Risk Management: The tool incorporates risk management features that help traders to protect their capital and maximize potential returns. Users can set stop-loss and take-profit levels, as well as customize their risk exposure according to their individual preferences and trading style.
█ Calculations
█ What are the Buy/Sell signals based on?
The Buy/Sell signals use volatility and price range with a weighting function that can help reduce lag and respond faster to recent price changes. The function gives more weight to the most recent volatility values and absolute price changes, making the algorithm more responsive to changes in volatility and price moves. Using a model that factors in both price changes and volatility gives a bias toward more recent data. This advanced approach to trading signal generation incorporates the concepts of trend following and mean reversion while accounting for changing market volatility.
Traditional systems often use fixed parameters, which may not adapt quickly to changes in market conditions. This can lead to late entries or exits, potentially reducing profitability or increasing risk. Our algorithm uses a weighting function to give more importance to recent volatility values, and absolute price changes can make these signals more responsive. This is especially useful in dynamic markets where price swings and volatility can change rapidly.
Adapting to Recent Price Changes: Markets can often exhibit trending behavior over certain periods. By weighing recent price changes more heavily, the model can quickly identify and react to the emergence of new trends. This can lead to earlier entries in a new trend, potentially increasing profitability.
Adapting to Recent Volatility Changes: Markets can shift from low to high volatility regimes (and vice versa) quite rapidly. A model that gives more weight to recent volatility can adapt its signals to these changing conditions. For example, in high volatility conditions, the model might generate fewer signals to reduce the risk of false breakouts. Conversely, in low volatility conditions, the model might generate more signals to capitalize on trending behavior.
Adaptive Trading: The approach inherently leads to an adaptive trading system. Rather than using fixed parameters, the system can adjust its behavior based on recent market activity. This can lead to a more robust system that performs well across different market conditions.
█ What are the Sniper signals (contrarian signals) based on?
Our contrarian signals are based on deviation from the expected value. The algorithm quantifies the amount of variation or dispersion in a set of values. Non-expected values are the fundamental core of the signal generation process.
█ Reversal Cloud Calculation
The cloud uses the information of how much the price fluctuates over a specific time period and updates its equilibrium value automatically at new price changes. The price changes are used to predict what will happen next, and the band adapts accordingly. The algorithm assumes that past price changes can predict future market behavior.
█ Support and Resistance (S/R) Levels Calculation
The support and resistance levels use historical overbought and oversold levels combined with a weighted atr function to predict future support and resistance areas. This calculation can potentially give traders a great heads-up on where the price may find support and resistance at.
█ Trend & Bar coloring Calculation
Trend calculations with dynamic events are key in ever-changing markets. The main idea of the calculation method is to find the mathematical function that best fits the data points, by minimizing the sum of the squares of the vertical distances of each data point from the equilibrium. The outcome is a function that finds the best mathematical description of that data. Hence the trend output may vary depending on the asset and timeframe. A unique approach where the same settings can give different results.
█ Risk Management Calculation
The risk management system is not unique in itself and contains everything that can help traders to manage their risk, such as different types of stop losses, Take Profits calculations.
-----------------
Disclaimer
The information contained in my Scripts/Indicators/Ideas/Algos/Systems does not constitute financial advice or a solicitation to buy or sell any securities of any type. I will not accept liability for any loss or damage, including without limitation any loss of profit, which may arise directly or indirectly from the use of or reliance on such information.
All investments involve risk, and the past performance of a security, industry, sector, market, financial product, trading strategy, backtest, or individual's trading does not guarantee future results or returns. Investors are fully responsible for any investment decisions they make. Such decisions should be based solely on an evaluation of their financial circumstances, investment objectives, risk tolerance, and liquidity needs.
My Scripts/Indicators/Ideas/Algos/Systems are only for educational purposes!
Skrip berbayar

Momentum Covariance Oscillator by TenozenWell, guess what? A new indicator is here! Again it's a coincidence, as I experiment with my formula. So far it's less noisy than Autoregressive Covariance Oscillator, so possibly this one is better. The formula is much simpler, care me to explain.
___________________________________________________________________________________________________
Yt = close - previous average
Val = Yt/close
___________________________________________________________________________________________________
Welp that's the formula lol. Funny thing is that it's so simple, but it's good! What matters is the use of it haha.
So how to use this Oscillator? If the value is above 0, we expect a bullish response, if the value is below 0 we expect a bearish response. That simple. Ciao.
(Any questions and suggestions? feel free to comment!)

SAR MACDSAR MACD is an idea of implementing Directional MACD with Parabolic SAR to exactly detect and confirm Trend. This p-SAR MACD consist of a HYBRID MACD which acts as MACD TREND oscillator, MACD Oscillator, PSAR Indicator combined with MA line. thus Fake MACD Signals can be eliminated using this SAR MACD. Sideways can be detected using Threshold Levels must be adjusted based on timeframe.
Indicators Hybrid model contains:
1.MACD (12,26,9) Standard with MA Crossovers
2.MACD Trend
3.Parabolic SAR with 0.02
4.Threshold level - indicates Sideways
How to use.
Histogram:
-> HIST MODE: normal MACD indicator
MA Line Color is based on PSAR Direction Blue-Up/ Pink -Down
A crossover upside with a Blue MA line denotes Up confirmation
A Crossover downwards with a red MA line denotes Down Confirmation
Additionally Histogram above zero line and below zero line are to be confirmed
-> MACD MODE: MACD Trend indicator
MA Line Color is based on PSAR Direction Blue-Up/ Pink -Down
A crossover upside with a Blue MA line denotes Up confirmation
A Crossover downwards with a red MA line denotes Down Confirmation
Additionally Histogram above zero line and below zero denotes long term Trend
-> Histogram Color: Indicates candles direction
Yellow indicates Unconfirmed Direction
Green Indicates up direction
Red Indicates Down Direction
Buy Condition:
MA Color - Blue
Histogram- Above Zero
Histogram/Candle -Green
MA Crossover is must
Sell Condition:
MA Color - Red
Histogram- Below Zero
Histogram/Candle -Red
MA Cross under is must
Warning: Must not be used as a standalone indicator. Use for confirmation of your Buy Sell Signals and Entry only.

Diddly - Real Volume TrendDiddly Real Volume Trend is an indicator to help traders identify the real trending direction of an asset, it achieves this by using liquidity to assess the overall buying and selling volume sentiment of a market place.
What is Liquidity
Liquidity refers to the ability of an asset to be turned into cash. Cash is the more liquid form of any asset, whereas selling a house would take a little longer to liquidate and convert to cash. Liquidity in financial markets is in essence based on the same principle and refers to how easily an asset can be bought and sold.
Liquidity in simple terms is the volume of participants who are willing to be involved in the market at any given time. Markets are based on auction theory, the more participants who want to buy at a certain price than sell, will dictate that the price goes up. As a result it is important to understand the role that volume has in financial markets, as volume will directly correlate to liquidity and supply and demand.
What does it mean?
Although markets are based on auction theory, sadly we don't have the advantage of a traditional auction, where we are all sitting in a room putting our hands in the air when we are interested in paying x price for a particular item. In this environment it is very clear to see how popular the item for sale is and whether it is possible to pick up a bargain.
Being able to identify the prevailing direction of buying versus selling volume on a chart provides an insight into market sentiment. Also we have to consider that typically most retail traders participate in very liquid markets, where you can get in and out of a position with relative ease.
There are obviously exceptions, extremely low float stocks, but on the whole with liquid assets it takes some big orders to move price, especially with currencies and high float stocks. Understanding these principles helps us as retail traders identify where the big money is seeing a bargain, if buying or overpriced if selling.
However you identify liquidity, I hope you agree that it is an extremely important element to be considering before taking a trade. The last thing any trader wants to be doing if they can avoid it, is getting on the wrong side of the market.
Just as a side note, high and low "Float Stocks" refers to the number of shares in general circulation for buying and selling.
What is "Diddly Real Volume Trend"
This volume trend indicator in simple terms will display the combined accumulated bullish and bearish volume within a window below the main chart. What you will see is a line chart that will be doing one of three things. Either it could be stair stepping in an upwards direction, identifying that we are in a bullish trend or stepping down in a bearish trend. Alternatively it could just be going sideways, which would suggest a ranging market.
This enables traders to make an assessment of the market sentiment using the liquidity direction that it has identified. This can help form an overall daily bias for intra-day traders or help confirm a longer term trend for swing traders.
Although this indicator is not a true oscillator (where the limits of number are fixed between a known upper and lower limit) , it can still be extremely useful in identifying divergence in price and the volume sentiment. As well as assisting in the process of identifying and confirming peak formations and potential reversal points in a market.
How does it Work
The indicator is plotting the volume trend line based on the output of a set of volume calculations, which is confirmed on the close of each candle. The resultant output is either a positive (Bullish sentiment) or negative (Bearish Sentiment), which are all totalled up to show the next point on the graph. As a result the visual effect seen from this process is that the more bullish calculated volume identified than bearish, you will see a rising trend line and the reverse for a bearish market.
The algo calculation which is used on each candle and its related volume is using the following elements.
Volume
Rate of Change
Relative Strength
The indicator is not just looking at the volume total and saying this is a green candle and must provide a positive number. It is looking for the volume and liquidity extremes and filtering out the nothingness of a market that makes no difference to price either way. It is from using these extremes that the indicator is able to plot the activities and direction of the big money in the market.
What is the Indicator Showing me?
Examples:
Here on a stock VKTX, on a 1 minute chart the elements that make up the indicator are annotated on the chart.
There are 6 components highlighted in the above chart, these have been listed below.
Volume Trend Line
This is the indicator driving line and is the result of the calculations described in the previous section.
Fast Moving Average
This is the fast moving average of the "Volume Trend Line". The moving average type and length can be changed in the settings.
(Default = Exponential Moving Average, Length: 60)
Slow Moving Average
This is a slower moving average of the "Volume Trend Line". The moving average type and length can be changed in the settings.
(Default = Hull Moving Average, Length: 3500)
Long Term Moving Average
This is a long term moving average of the "Volume Trend Line". The moving average type and length can be changed in the settings.
(Default = Exponential Moving Average, Length: 400)
Bullish Confirmation
On the "Volume Trend Line", you will see coloured circles dotted along the line, the green circles signifying Bullish Confirmation.
Bearish Confirmation
On the "Volume Trend Line", you will see coloured circles dotted along the line, the red circles signifying Bearish Confirmation.
The Bullish and Bearish confirmation signals are not signals to take trades, they are there to highlight the predominant direction. Seeing one confirmation signal in isolation is not that helpful, but continued prints of confirmation in a single direction would be interesting.
There are a further two signal types that are displayed on the volume trend line, these should be seen infrequently across charts and represent potential extremes of price movement in a single direction. These signals act as a warning that price could stall in this area or potentially make a reversal. As with the other signals within this indicator they are not signals to buy or sell, they are there to provide warning alerts and should be considered with other pieces of information that you are working with.
Bullish Extreme
Plotted on the "Volume Trend Line", you will occasionally see a green coloured downwardly pointing triangle, this represents a Bullish Extreme.
GBPAUD Hourly chart October 2022
Bearish Extreme
Plotted on the "Volume Trend Line", you will occasionally see a red coloured upward pointing triangle, this represents a Bearish Extreme.
GBPAUD Daily chart (February - April) 2023
How Does It Help?
This indicator will compliment any existing strategy and is not intended to be used standalone.
It can be used on any chart from a monthly, one minute to one second, depending on your trading strategy. Using multiple time frame analysis can help traders with a number of decisions that need to be considered before taking entries.
What is my market direction bias?
This can be taken from an hourly for intraday trader or daily for swing traders. What that time frame is depends on your trading plan and objectives from the trades you take.
When do I take my trades?
Again depending on the trading strategy used will dictate many aspect of this decision, although using the volume trend on a lower time frame, can help confirm breakouts, reversals and divergence.
How should I manage my trade?
With any trade you should have a defined risk reward clearly defined, with stops and targets in mind before taking an entry.
The age old saying of "cut your losses quickly and let your winner run", is easier said than mastered. Once in a trade the volume trend can be really helpful to identify trades that could be real runners and allows you to change expectations after entering the trade. Maybe you want to take some profit at the original point and let the remaining run. Maybe there is such strength you want to add to the position. Being able to assess market sentiment once in a trade can help with optimising returns.
The "Volume Trend Line", which is the driving element of this indicator, will be doing one of three things. Either it could be stair stepping in an upwards direction, identifying that we are in a bullish trend, stepping down in a bearish trend or going sideways in a ranging market.
Bullish Volume Trending Market
Here is stock VKTX, on a 1 minute chart. Trend confirmation on price action is determined by Higher Highs and Higher Lows for an uptrend or Lower Lows and Lower Highs on a downtrend. The same principle applies for the volume trend line.
In this example we first see breakout volume on the indicator with the Bullish Break volume, following that the volume trend keeps making higher highs and higher lows, confirming that this asset has short-term upwards potential. (why short-term? this is the 1 minute chart, you would want to consult the daily or hourly for a longer term perspective).
Price also is making higher highs and higher lows, which is in alignment with the indicator and known as "convergence" and is a positive signal for a continued trend.
Bearish Market
So here on Tesla (TSLA) on the 4 hour chart we can see the big sell off that started in April 2022. Where it clearly shows a downward trend, with lots of confirmation for continuation.
Ranging Markets
On this example on the AUDJPY 1 Hour chart, we can see that price is in a ranging market. By drawing trend lines on price and the indicator, it is clear to see that price and the volume trend line are both showing a ranging market. What is more interesting is the structure of the ranges.
The price range at the top of the chart is in an upward direction, whereas the volume trend in the bottom window is showing a downward range. Giving us an early indication of what to expect from this asset.
Diverging Markets
"Divergence" is a very powerful mechanism for identifying potential reversal points in price actions. There is a wealth of published information on this topic which is well worth reviewing, if this is a new principle to you.
Here again on the same AUDJPY 1 Hour chart example, points of interest have been annotated on the chart where the historical range turns into a step down to the next level within the market cycle, as predicted by the divergence in range patterns, price point up and volume pointing down.
In the above example, after identifying the divergence the next most important element is an extremely fast accelerated move down which breaks the lower level of the range, this can be seen on the right side of the bottom window and is labelled "Bearish Breaking Volume".
What is interesting here is that the volume indicator has identified the range breakout when price was still above the lower level of the range. Following that break out volume signal, if we zoom out to a 4 hour chart to see what happened next.
The range breakout was confirmed and price and the volume trend continues to show a downward direction in the market. As for entries and stops that is not the intention of this indicator and will be down to other elements in your trading strategy or in our case other indicators.
Peak Formations
Peak formation refers to the point where an asset is over extended in one direction and there is a potential of change in direction, with a wider pullback or a reversal in the higher time frame trend. These formations are often seen with double bottoms (W patterns) or double tops (M patterns) . Unfortunately these patterns appear all over the chart and trading them in isolation will be challenging.
In this example of EURJPY on the 1 hour chart, we see price and the indicator in the bottom window for the first 3 weeks in March 2022. The pair is trending down which is confirmed by both price and the indicator. There are no signals points plotted on the volume trend line, until one appears on March 4th 2022.
Another one appeared on the next trading day of Monday the 7th and we now have these two signals relatively close to each other. This is interesting information, especially considering that there was no extreme signals for the previous couple of months.
Later that day the volume trend broke the previous volume level, after a W pattern was completed and a green bullish confirmation signal was printed. The following day another bullish confirmation signal is displayed to further confirm that we had made a peak formation reversal.
Please note that using the settings style tab, has enabled the change to the bearish extremes signal, changing the colour and shape to be an orange circle. Which for the purposes of this illustration is easier to see.
Another example of the same pair in August 2022, with a very similar confirmation sequence.
Stock Examples
Here on UBER on a 1 hour chart , is an example of how the indicator can be used in confluence with other trading strategies. If a trader was trading candle patterns, they may see this classic 1 hour bull flag pattern forming.
Without the volume trend analysis this looks like a good buy setup. Adding this analysis to the chart we clearly have a different view point.
Here is what subsequently happened to price and this is in a generally bullish market March 2023.
Scalping Entries
For those traders who work with super fast time frames like the 5 second or even on a 1 second charts, the volume indicator can be used to help time entries as a part of a wider trading strategy of trading a pullback or trading support and resistance levels.
Styling options in the indicator settings enabled this different view of the indicator output, which can be extremely useful for timing entries.
Here on this hot IPO stock, LUNR from February 16th 2023, we have an extremely strong move up from $13.80 to $18.00. One aspect of this move up, is that it is doing this on extremely light volume and the predominant market sentiment on the surface seems very bearish.
This would be a clear indication not to trade this stock at this moment in time, as a trader there would be lots of emotions of FOMO (fear of missing out) , seeing a stock making that kind off move on a new IPO - there is the sense that this stock will go to the moon and your not going to be involved.
As traders we have to consider the risk : reward potential. This stock could drop to $10.00 if someone put in a 50 k market sell order, as it is clear there are not the buyers to support that kind of liquidation.
The following charts are in the 5 second time frame, until otherwise stated
So we need to wait for some confirmation of buying liquidity before we can make any plans for taking an entry, which we get in the form of a couple of strong bullish candles on the chart below. Interestingly the price breaks the previous all time high for this stock, although the volume trend at this stage does not seem strong enough to consider an entry.
At this point we should be on the lookout for further buying liquidity, ideally to break the previous high volume line, which appears in the next chart. This would be the time to take an entry based on other aspects of a trading plan.
Having now taken an entry, we can use the indicator to understand the strength of the buying liquidity and identify areas where we should be looking to take profit or close out the trade. Looking at the volume trend profile shown in the chart below, there is no reason not to hold this stock for a wider move up.
In the next chart we see the first signs of some selling pressure, as the indicator shows signs of red. This would be the area to take some profit and look at a higher time frame perspective, to get the sense of whether to hold the remaining position.
Here on the 5 minute time frame the volume trend is still looking very strong to hold the remaining position. As it turned out it was a good place to take profit as it was just under the high of the day.
Knowing when an asset is going to reverse is not easy and this stock was way too over extended and a top had to finally come. This one minute view of the indicator, shows the point where you would see that the upward liquidity was over and you were now on the backside of the move, with no reason to trade further.
Here on a 15 minute chart you can see the full extent of the move and its reversal back to the original price. It provides a clear illustration that chasing trades through FOMO or holding and hoping is not a profitable approach. Being able to time your entries and exits, where you can clearly manage risk is one of the most important elements to any traders strategy.
This is an extreme example and not something you see every day in any market. It has been included within this narrative with the hope that it clearly illustrates the risk involved in trading and being able to mitigate them, has to be at the forefront of your mind.
Key Settings
Within the indicator settings there are a number of options that are available to users. All aspects of what you can see can either be changed or turned on or off in the "Style" tab as well as changing the colours and their transparency.
The available settings on the "Inputs" tab are for fine tuning the indicator to your style of trading. This fine tuning can be applied to the moving averages that can be displayed and follow the volume trend line as well as the volume filtering process.
The most important ones that are in need of explanation are outline below:
General Settings
"What type of asset is the Algo looking at" : Available Options = "Small Caps", "Large Caps", "Futures", "Currencies" (Default Setting = Currencies)
The indicator will make an assessment of the best settings to use as defaults for the volume filtering, confirmation and extremes signals. The defaults can be changed in the following sections using the override.
"Turn on Turbo Mode" : True or False (Default Settings = True)
This setting will give the indicator volume filtering processes a boost
Signal Settings
Based on the "Asset Type" from the general settings, the indicator will make an assessment of the best settings to use by default. These can be changed by using the settings below.
"Override Default Assessment Thresholds" = True / False
"Percentage Difference to Signify Trend Confirmation" = A percentage value that will tell the indicator how to identify the volume trend line swing points used to identify bullish or bearish confirmation signals. Values from 0.1 to 10 would make the most sense. A too high setting and you will not see any confirmation points plotted. Too low and you may see too many to be useful.
"Percentage Difference to Signify Extremes" = A percentage value that will tell the indicator how to identify the volume trend line swing points used to identify bullish or bearish confirmation signals. Values from 20 to 200 would make the most sense. A low a setting and you will see too many extreme points plotted.
Filter Settings
"Turn On Volume Assessment Filters" = True / False : The volume assessment filters are used to focus the "volume trend line" on higher volume extremes.
Based on the "Asset Type" from the general settings, the indicator will make an assessment of the best settings to use by default. These can be changed by using the settings below.
"Override Default Assessment Filters" = True / False
"Filter Volume using Setting" = The number used in this setting represents a value from 0 to 100. Zero will filter out no volume, whereas 100 would filter it all out. The default setting is 1, as there is a danger of setting this number too high and all you will see in the line chart is big steps up and down, with a plateaus in the middle. Which may be useful, although it would not be so helpful in divergence or volume line breaks.
Fast Moving Average
This is the fast moving average of the "Volume Trend Line".
"Moving Average Type" = The type of moving average calculation to be applied.
Default = "EMA"
Available Options: "SMA","EMA" ,"HMA" ,"SMMA (RMA)" ,"WMA" ,"VWMA"
Moving Average Key
SMA : Simple Moving Average
EMA : Exponential Moving Average
HMA : Hull Moving Average
SMMA (RMA) : Exponentially Weighted Moving Average (alpha = 1 / length.)
WMA : Weighted Moving Average
VWMA : Volume Weighted Moving Average
"Moving Average Length" = The number of candles back into the chart used to calculate the Moving Average. (The higher the number, the slower the moving average becomes)
Default Length = 60
"Apply Double Smoothing" = True or False : This is an option to turn on if an extra smoothing effect to the moving average if required.
Slow Moving Average
This is the slow moving average of the "Volume Trend Line".
"Moving Average Type" = The type of moving average calculation to be applied.
Default = "HMA"
Available Options: "SMA","EMA" ,"HMA" ,"SMMA (RMA)" ,"WMA" ,"VWMA"
(See moving average key)
"Moving Average Length" = The number of candles back into the chart used to calculate the Moving Average. (The higher the number, the slower the moving average becomes)
Default Length = 3500
(By default we have a higher number for the slow length compared to the long term length in the next setting. This is because using the Hull Moving Average, is an accelerated moving average that needs higher values to slow it down. If you were to change this to say an EMA, then you would need to change the length to something like 200, to put this slower moving average in context with the others).
Long Term Moving Average
This is a long term moving average of the "Volume Trend Line".
"Moving Average Type" = The type of moving average calculation to be applied.
Default = "EMA"
Available Options: "SMA","EMA" ,"HMA" ,"SMMA (RMA)" ,"WMA" ,"VWMA"
(See moving average key)
"Moving Average Length" = The number of candles back into the chart used to calculate the Moving Average. (The higher the number, the slower the moving average becomes)
Default Length = 400
"Apply Double Smoothing" = True or False : This is an option to turn on if an extra smoothing effect to the moving average if required.
Finally
We greatly appreciate the support and feedback from the Trading View community, and we are dedicated to continuing to improve our indicators with your support.
We want to help you manage risk, and that's why we emphasise that trading is risky and any technology used to support our trading decisions is based on information from the past. We encourage traders to take responsibility for their trading businesses and always prioritise risk management.

Moving Average Band Width ((((20/04/2022))))Todays Script uses 5 Moving Averages with the new function on V5 called fill, we can now colour fill between moving averages.
9ema
20ema
50ema
100ema
200ema
100-200ema which is labelled in Redis where the big impulse moves will fall into if the pressure is so strong on the opposite of the trend.
50-100ema which is labelled in Blue is where price could be heading in a healthy trend
20-50ema which is labelled in Purple, price will enter this area when price is in a strong impulse move/trend
9-20ema which is labelled in Green is a super strong trend/ impulse move, price will most likely break this stream and enter the 20-50ema
(the colour of EMAS can be changed in the settings)
I would use this to either gauge the strength of a trend//impulse leg or buy/sell opportunities.
This works best in trending environments, LTF and liquid markets

[UPRIGHT Trading] Trend Direction Force Index (TDFI)The Trend Direction Force Index, TDFI or TDF Index, is a staple in the Forex community, but is excellent on most asset (i.e. stock) trading.
Developed by Pyotr Wojdyo for metastock trading platform originally, but now on several other.
The idea of the TDFI is that there is enough trend directional force to enter the trade.
How it works:
When the signal is above the high threshold, the trader can go long.
When the signal is below the low threshold, the trader can go short.
It's usually used as confirmation along with another indicator.
Features:
Fully customizable
Built-in color changing
Alerts!
If you like this, you will definitely like what else I've published.
Like, follow, support, etc.
Enjoy.
Cheers,
Mike
(UPRIGHT Trading)

Up/Down Indicator - DurbtradeA simple but unique indicator to show ONLY whether there is an increase or a decrease in price compared to the previous value.
Also includes a customizable SMA or EMA based "Smoothing Length" variable,
allowing the indicator to show whether the SMA or the EMA of the price
is up or down compared to the previous value.
An offset option is also included if you need it.
Settings :
Personal thoughts :
I wanted to have an indicator that showed ONLY whether the price is UP or DOWN from the previous value.
My logic was that I could have a more accurate perception of general up or down trend direction
if I removed the AMOUNT of increase or decrease happening from moment to moment over time.
From there, I added the SMA/EMA "Smoothing Length" and "Smoothing Type" variables into the script.
By increasing the value of the smoothing length above 1,
the indicator act as a color-changing moving average, except without showing an actual value.
"Smooth Length" acts just like the length of any other moving average...
When the value of the "Smooth Length" is = 1, the indicator shows whether PRICE is up or down.
When the value of the "Smooth Length" is = 50, the indicator shows whether the MOVING AVERAGE with a length of 50 is up or down.
When the value of the "Smooth Type" is = 1, the indicator is SMA based.
When the value of the "Smooth Type" is = 2, the indicator is EMA based.
As you can see in the main chart above, or in the picture below, I show the indicator in 2 different ways...
The indicator on the top shows price up/down action,
and the indicator on the bottom shows the 50 SMA up/down action :
Other key points :
The indicator height can be smashed down as small as possible and still remain 100% functional...
which is very important when chart real-estate is limited.
Here is an example of my main layout setup, with the Up/Down indicator on the top left :
As you can see, it takes up very little space, but still remains fully functional.
In the example above, I have it overlayed on the left chart price panel,
with the price visibility turned off.
If it is overlayed on the price panel like so, and you want to see both the indicator and price,
simply turn the price visibility on to see both.
Since the indicator displays itself merely by changing the color of the background,
layer order has no effect, and the indicator is always drawn in the background.
The Up/Down indicator can also be used in conjunction with other candle types
that sometimes display candle color differently than standard candles, such as heikin-ashi candles.
Just take note that the colors of the indicator may not match the colors of the heikin-ashi candles.
Finally, I looked very hard to find an indicator like this on TradingView, and found absolutely nothing.
I know that it is a simple concept, but I'm honestly surprised I couldn't find anything like it.
I have been using it for awhile now, and I'm proud of the results...
therefore, I'd like to share it with the community, along with my previously published indicators,
in the hope that you find it useful!
Outro :
A) As with my previous indicators,
this one was written while keeping information, color, clarity, chart real-estate, and customization in mind.
B) It is optimized to be displayed on all display setups...
for use on your own personal television, laptop, or cellular phone screen...
and on all chart zoom levels and layout styles.
C) Please feel free to comment your thoughts, critiques, or suggestions. They are all very helpful!
D) Check out my previous pine script indicators if you like this one. They work really well together.
E) I hope that you find this script useful.
F) Enjoy!
// Durbtrade

Rosebud Trend Backtest [DepthHouse]*Past Performance Does Not Guarantee Future Results*
*Strategy created for backtesting purposes only.
*Backtesting assesses the viability of a trading strategy or pricing model by discovering how it would have played out retrospectively using historical data.
* Please be sure to read all updates below as the information below could change with future updates.
Rosebud Trend Indicator uses complex range calculations to easily detect trend changes, critical support and resistance levels, and even aid in spotting reversals. The Critical Support & Resistance Zones are plotted via the red and green cloud. This cloud not only visually displays the expected trend direction but often acts as major support and resistance zones. The outer band measures the expected range in which the assets trade over longer periods of time.
The Rosebud Trend Backtest combines the calculations of the ATR Auto Oscillator & the Rosebud Trend Indicator to demonstrate backtest performance.
// Settings //
Users can switch the ‘ Trend Sensitivity ’ between ‘ Low ', ' Med ', and ‘ High ’ to increase or decrease the rate at which the cloud changes.
By altering the S/R Band Thickness users can furthermore increase or decrease the rate at which a trend changes by altering the thickness of the cloud. Default is .50 however this can be lowered if needed.
Bar colors are generated by a combination of Rosebuds primary function and our ATR AUTO Oscillator base functions. Users have 3 bar color options to select from: Simple, Complex, and Off.
Simple: Bars colors alternate between shades of red and green based on the trend direction and the ATR Auto strength. The stronger the shade, the stronger the trend.
Complex: This adds a few extra variables to the script which generates a more complex bar color display. Using this option, Rosebud will generate light red bars in a bull trend if downward movement is strong and vice versa in a bear trend. It also will generate a purple bar if the candle successfully closes above or below the Top & Bottom Range Bands; We call this a range break, and it could be an early sign of strong upward or downward movement.
Off: In case you like to keep things even simpler, this option hides all overlay bar colors.
ATR Options: Used for Light & Strong Entries/Exits // Bar Colors also based on these settings
ATR Smoothed Signal Option: Turns advance smoothing on or off. On will reduce signal noise, while Off could land you that perfect bottom signal with a lower success rate.
ATR Candlestick Length: Default factor for bar color and shape generation, the higher the number the fewer signals that will generate.
ATR Candlestick Smoothing: Default smoothing for the Candlestick Length
Signal Lookback: Adjust the factor at which Bull, Bear, Up, and Down. Lower this to 2 for more signals.
// ⇅ BackTest Settings ⇅ //
Short Trading: Option to see backtest results for both long and short positions. Default is Long Only.
Strategy Entry Options:
Trend Only: Positions are entered right as there is a cloud trend change.
Light Entry: This enters a trade as soon as there is a breakout or breakdown signal generated from the ATR settings.
Strong Entry: Multiple conditions must be met; Price action must be near the Trend Base and must receive either a bullish or bearish crossover in the oversold or overbought range of the ATR Settings.
Strategy Exit Options:
Trend Only: Exits all positions after there is a primary trend change.
Light Exit: Exits a user set percentage of open positions when the ATR generates a breakdown or breakout. Will continue to do this at each occurrence. Presets are built in to keep these from triggering too often in volatile conditions.
Strong Exit: Exits a user set percentage of open positions when the ATR generates a bullish or bearish crossover in the overbought or oversold ranges. Will continue to do this with each occurrence. Presets are built in to keep these from triggering too often in volatile conditions.
Profit Points: Exits a set percentage of the position up to 3 times at a user set percentage gap from the entry. Any remaining amount in the position exits upon a trend change.
Profit QTY Percent: Percent of the position to exit when an exit condition triggers. This does not apply to the “Trend Only” exit option.
Profit Percent Gap: Percent gap for Profit Point Exits. Recommend adjusting based on timeframe. See example below.

Linear Regression Channel / Curve / Slope by DGTTʜᴇ Lɪɴᴇᴀʀ Rᴇɢʀᴇꜱꜱɪᴏɴ Cʜᴀɴɴᴇʟꜱ
Linear Regression Channels are useful measure for technical and quantitative analysis in financial markets that help identifying trends and trend direction. The use of standard deviation gives traders ideas as to when prices are becoming overbought or oversold relative to the long term trend
The basis of a linear regression channel
Linear Regression Line – is a line drawn according to the least-squares statistical technique which produces a best-fit line that cuts through the middle of price action, a line that best fits all the data points of interest. The resulting fitted model can be used to summarize the data, to predict unobserved values from the same system. Linear Regression Line then present basis for the channel calculations
The linear regression channel
2. Upper Channel Line – A line that runs parallel to the Linear Regression Line and is usually one to two standard deviations above the Linear Regression Line.
3. Lower Channel Line – This line runs parallel to the Linear Regression Line and is usually one to two standard deviations below the Linear Regression Line.
Unlike Fibonacci Channels and Andrew’s Pitchfork, Linear Regression Channels are calculated using statistical methods, both for the regression line (as expressed above) and deviation channels. Upper and Lower channel lines are presenting the idea of bell curve method, also known as a normal distribution and are calculated using standard deviation function.
A standard deviation include 68% of the data points, two standard deviations include approximately 95% of the data points and any data point that appears outside two standard deviations is very rare.
It is often assumed that the data points will move back toward the average, or regress and channels would allow us to see when a security is overbought or oversold and ready to revert to the mean
please note : Over time, the price will move up and down, and the linear regression channel will experience changes as old prices fall off and new prices appear
█ Linear Regression Study Features
Linear Regression Channel
- Linear regression line as basis
- Customizable multiple channels based on Standard Deviation
- ALERTs for the channel levels
Linear Regression Curve
- Linear regression curve as basis
- Optional : Bands based on Standard Deviation or Volatility (ATR). Bands are applied with fixed levels 1, 2 and 3 times StdDev or ATR away from the curve
Linear Regression Slope
- Optional : Up/Down slope arrows for a used defined period
█ Volume / Volatility Add-Ons
High Volatile Bar Indication
Volume Spike Bar Indication
Volume Weighted Colored Bars
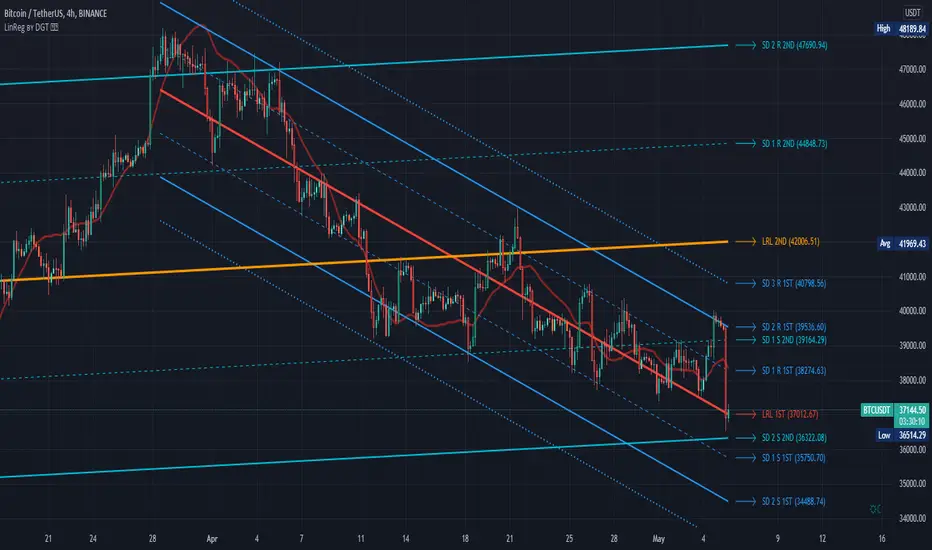
Ichimoku Trend DirectionThis script will help you detect the current trend of market use Ichimoku trading system. We use the default parameters.
To reduce risk, ONLY trade follow the trend of high time frame!
Very simple to use:
- Green background when market Up trend
- Red background when market Down trend
Have a nice trade! :P
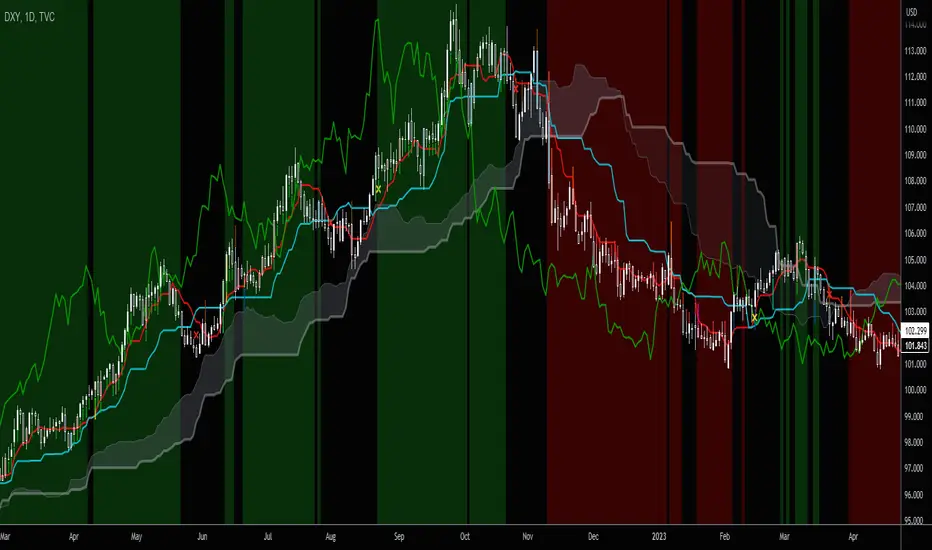
[Jett.][GoldenRush] Market DirectionThis script was created to analyze levels of market trends.
This is an indicator that is used to analyze the overall 2 levels.
1.Considering the index's key trends (Strategic Level)
2.Trend Analysis (Tactical Level)
To get a big overview of the trend and catch short-term movements. In this indicator, there are 4 levels of momentum measurements.
with the default setting
Major trends (Strategic Level)
1.We have the highest and lowest prices in the 52-week or 1-year scale.
2.We use the average of the highest and lowest prices(basis of 52-week). can be filtering the overview of the trend
3.As for the trend in 24-week or 6-month. Used to find the direction of the price And helps confirm that a trend is starting to take a certain direction.
Sub-level trend (Tactical Level)
1.Price in the level 12-week or 3-month. We use it to calculate the direction of movement in the short term, it is possible that the market will be bullish or bearish in 3-month.
2.And the 12-week or 3-month price is a confirmation of how strongly the short-term price moves in any direction.
3.If there will be a correction of the price base 12 weeks or 3-month price swings always happen first.
4.The 1-month price is the same as the trigger, if the market has a breakout in any way it could mean the start of a short sway.
By this indicator Besides being used to measure direction or trend, it can also be used as a significant filter for both support and resistance for short, medium, long term.
Jet.T.S. Trader