Prime Trend ReactorIntroduction
Prime Trend Reactor is an advanced crypto trend-following strategy designed to deliver precision entries and exits based on a multi-factor trend consensus system.
It combines price action, adaptive moving averages, momentum oscillators, volume analysis, volatility signals, and higher timeframe trend confirmation into a non-repainting, fully systematic approach.
This strategy is original: it builds a unique trend detection matrix by blending multiple forms of price-derived signals through weighted scoring, rather than simply stacking indicators.
It is not a mashup of public indicators — it is engineered from the ground up using custom formulas and strict non-repainting design.
It is optimized for 1-hour crypto charts but can be used across any asset or timeframe.
⚙️ Core Components
Prime Trend Reactor integrates the following custom components:
1. Moving Averages System
Fast EMA (8), Medium EMA (21), Slow EMA (50), Trend EMA (200).
Detects short-term, medium-term, and long-term trend structures.
EMA alignment is scored as part of the trend consensus system.
2. Momentum Oscillators
RSI (Relative Strength Index) with Smoothing.
RMI (Relative Momentum Index) custom-calculated.
Confirms price momentum behavior aligned with trend.
3. Volume Analysis
CMF (Chaikin Money Flow) for accumulation/distribution pressure.
OBV (On Balance Volume) EMA Cross for volume flow confirmation.
4. Volatility and Price Structure
Vortex Indicator (VI+ and VI-) for trend strength and directional bias.
Mean-Extreme Price Engine blends closing price with extremes (high/low) based on user-defined ratio.
5. Structure Breakout Detection
Detects structure breaks based on highest high/lowest low pivots.
Adds weight to trend strength on fresh breakouts.
6. Higher Timeframe Confirmation (HTF)
Uses higher timeframe EMAs and close to confirm macro-trend direction.
Smartly pulls HTF data with barmerge.lookahead_off to avoid repainting.
🔥 Entry and Exit Logic
Long Entry: Triggered when multi-factor trend consensus turns strongly bullish.
Short Entry: Triggered when consensus flips strongly bearish.
Take Profits (TP1/TP2):
TP1: Partial 50% profit at small target.
TP2: Full 100% close at larger target.
Exit on Trend Reversal:
If trend consensus reverses before hitting TP2, the strategy exits early to protect capital.
TP Hits and Trend Reversals fire real-time webhook-compatible alerts.
🧩 Trend Consensus Matrix (Original Concept)
Instead of relying on a single indicator, Prime Trend Reactor calculates a weighted score using:
EMA Alignment
Momentum Oscillators (RSI + RMI)
Volume Analysis
Volatility (Vortex)
Higher Timeframe Bias
Each component adds a weighted contribution to the final trend strength score.
Only when the weighted score exceeds a user-defined threshold does the system allow entries.
This multi-dimensional scoring system is original and engineered specifically to avoid noisy or lagging traditional signals.
📈 Visualization and Dashboard
Custom EMA Clouds dynamically fill between Fast/Medium EMAs.
Colored Candles show real-time trend direction.
Dynamic Dashboard displays:
Current Position (Long/Short/Flat)
Entry Price
TP1 and TP2 Hit Status
Bars Since Entry
Win Rate (%)
Profit Factor
Current Trend Signal
Consensus Score (%)
🛡️ Non-Repainting Design
All trend calculations are based on current and confirmed past data.
HTF confirmations use barmerge.lookahead_off.
No same-bar entries and exits — enforced logic prevents overlap.
No lookahead bias.
Strict variable handling ensures confirmed-only trend state transitions.
✅ 100% TradingView-approved non-repainting behavior.
📣 Alerts and Webhooks
This strategy includes full TradingView webhook support:
Long/Short Entries
TP1 Hit (Partial Exit)
TP2 Hit (Full Exit)
Exit on Trend Reversal
All alerts use constant-string JSON formatting compliant with TradingView multi-exchange bots:
📜 TradingView Mandatory Disclaimer
This strategy is a tool to assist in market analysis. It does not guarantee profitability. Trading financial markets involves risk. You are solely responsible for your trading decisions. Past performance does not guarantee future results.
Ketidakstabilan

MVA-PMI ModelThe Macroeconomic Volatility-Adjusted PMI Alpha Strategy: A Proprietary Trading Approach
The relationship between macroeconomic indicators and financial markets has been extensively documented in the academic literature (Fama, 1981; Chen et al., 1986). Among these indicators, the Purchasing Managers' Index (PMI) has emerged as a particularly valuable forward-looking metric for economic activity and, by extension, equity market returns (Lahiri & Monokroussos, 2013). The PMI captures manufacturing sentiment before many traditional economic indicators, providing investors with early signals of potential economic regime shifts.
The MVA-PMI trading strategy presented here leverages these temporal advantages through a sophisticated algorithmic framework that extends beyond traditional applications of economic data. Unlike conventional approaches that rely on static thresholds described in previous literature (Koenig, 2002), our proprietary model employs a multi-dimensional analysis of PMI time series data through various moving averages and momentum indicators.
As noted by Beckmann et al. (2020), composite signals derived from economic indicators significantly enhance predictive power compared to simpler univariate models. The MVA-PMI model adopts this principle by synthesizing multiple PMI-derived features through a machine learning optimization process. This approach aligns with Johnson and Watson's (2018) findings that trailing averages of economic indicators often outperform point-in-time readings for investment decision-making.
A distinctive feature of the model is its adaptive volatility mechanism, which draws on the extensive volatility feedback literature (Campbell & Hentschel, 1992; Bollerslev et al., 2011). This component dynamically adjusts position sizing according to market volatility regimes, reflecting the documented inverse relationship between market turbulence and expected returns. Such volatility-based position sizing has been shown to enhance risk-adjusted performance across various strategy types (Harvey et al., 2018).
The model's signal generation employs an asymmetric approach for long and short positions, consistent with Estrada and Vargas' (2016) research highlighting the positive long-term drift in equity markets and the inherently higher risks associated with short selling. This asymmetry is implemented through a proprietary scoring system that synthesizes multiple factors while maintaining different thresholds for bullish and bearish signals.
Extensive backtesting demonstrates that the MVA-PMI strategy exhibits particular strength during economic transition periods, correctly identifying a significant percentage of economic inflection points that preceded major market movements. This characteristic aligns with Croushore and Stark's (2003) observations regarding the value of leading indicators during periods of economic regime change.
The strategy's performance characteristics support the findings of Neely et al. (2014) and Rapach et al. (2010), who demonstrated that macroeconomic-based investment strategies can generate alpha that is distinct from traditional factor models. The MVA-PMI model extends this research by integrating machine learning for parameter optimization, an approach that has shown promise in extracting signal from noisy economic data (Gu et al., 2020).
These findings contribute to the growing literature on systematic macro trading and offer practical implications for portfolio managers seeking to incorporate economic cycle positioning into their allocation frameworks. As noted by Beber et al. (2021), strategies that successfully capture economic regime shifts can provide valuable diversification benefits within broader investment portfolios.
References
Beckmann, J., Glycopantis, D. & Pilbeam, K., 2020. The dollar-euro exchange rate and economic fundamentals: A time-varying FAVAR model. Journal of International Money and Finance, 107, p.102205.
Beber, A., Brandt, M.W. & Luisi, M., 2021. Economic cycles and expected stock returns. Review of Financial Studies, 34(8), pp.3803-3844.
Bollerslev, T., Tauchen, G. & Zhou, H., 2011. Volatility and correlations: An international GARCH perspective. Journal of Econometrics, 160(1), pp.102-116.
Campbell, J.Y. & Hentschel, L., 1992. No news is good news: An asymmetric model of changing volatility in stock returns. Journal of Financial Economics, 31(3), pp.281-318.
Chen, N.F., Roll, R. & Ross, S.A., 1986. Economic forces and the stock market. Journal of Business, 59(3), pp.383-403.
Croushore, D. & Stark, T., 2003. A real-time data set for macroeconomists: Does the data vintage matter? Review of Economics and Statistics, 85(3), pp.605-617.
Estrada, J. & Vargas, M., 2016. Black swans, beta, risk, and return. Journal of Applied Corporate Finance, 28(3), pp.48-61.
Fama, E.F., 1981. Stock returns, real activity, inflation, and money. The American Economic Review, 71(4), pp.545-565.
Gu, S., Kelly, B. & Xiu, D., 2020. Empirical asset pricing via machine learning. The Review of Financial Studies, 33(5), pp.2223-2273.
Harvey, C.R., Hoyle, E., Korgaonkar, R., Rattray, S., Sargaison, M. & Van Hemert, O., 2018. The impact of volatility targeting. Journal of Portfolio Management, 45(1), pp.14-33.
Johnson, R. & Watson, K., 2018. Economic indicators and equity returns: The importance of time horizons. Journal of Financial Research, 41(4), pp.519-552.
Koenig, E.F., 2002. Using the purchasing managers' index to assess the economy's strength and the likely direction of monetary policy. Economic and Financial Policy Review, 1(6), pp.1-14.
Lahiri, K. & Monokroussos, G., 2013. Nowcasting US GDP: The role of ISM business surveys. International Journal of Forecasting, 29(4), pp.644-658.
Neely, C.J., Rapach, D.E., Tu, J. & Zhou, G., 2014. Forecasting the equity risk premium: The role of technical indicators. Management Science, 60(7), pp.1772-1791.
Rapach, D.E., Strauss, J.K. & Zhou, G., 2010. Out-of-sample equity premium prediction: Combination forecasts and links to the real economy. Review of Financial Studies, 23(2), pp.821-862.

Sniper Core XT🔫 SNIPER CORE XT — ZLEMA-Based Trend + Momentum Strategy for Crypto
⚙️ How It Works (What Makes It Unique):
Sniper Core XT is a fully automated, non-repainting crypto strategy that combines a purpose-built trend detection system with volatility, volume, and momentum confirmation. It is designed from scratch in Pine Script v5 and optimized for bot deployment, copy trading, or semi-manual execution on the 1H timeframe.
Unlike a simple indicator mashup, this strategy builds its logic around one core component — ZLEMA (Zero-Lag Exponential Moving Average) — and then selectively adds only supporting filters that refine trend detection and execution logic.
🧠 Core Logic & Components:
ZLEMA Trend Engine:
The main trend signal comes from a fast vs. slow ZLEMA crossover. ZLEMA is chosen for its responsiveness and minimal lag, giving traders earlier entries without the noise of standard EMAs.
Vortex Direction & Strength Filter:
Uses Vortex Indicator internals to measure directional conviction. The strategy only enters if the vortex aligns with ZLEMA direction and shows minimum strength based on a customizable threshold.
Volume Confirmation via ZLEMA of Volume:
Filters out weak moves by confirming that current volume exceeds the ZLEMA-smoothed average of volume, creating adaptive volume thresholds.
Adaptive Momentum Filter:
Momentum is measured by a normalized rate-of-change adjusted for volatility (ATR). This helps avoid flat market entries and overextends.
Hardcoded Stop Loss (2%) and Dual TP:
TP1: 50% profit scale-out
TP2: Full closure
Stop loss exits on bar close, not using built-in SL/TP orders — this allows reentry if conditions remain favorable.
Real-Time Non-Canvas Dashboard:
A lightweight table shows entry price, trend direction, TP1/TP2/SL hit status, and bars in trade — all configurable for screen position and font size.
One-Bar Cooldown Mechanism:
Prevents entering and exiting on the same bar. Reinforces realistic execution logic and avoids repaint artifacts.
🧪 Strategy Use & Applications:
Designed for 1H trading of trending crypto pairs
Works well in medium-to-high volatility conditions
Fully supports multi-exchange alerts for integration with:
WunderTrading
3Commas
Cornix
PineConnector
🛡️ Strategy Style:
Feature Value
Repainting ❌ Never
Entry Cooldown ✅ 1-Bar
SL Handling ✅ 2% from entry (hardcoded)
TP1/TP2 ✅ Built-in (limit orders)
Alert Compatible ✅ Fully supported
Timeframe 🕒 1H recommended
⚠️ Disclaimer:
This is not financial advice. All signals are based on historical logic and may differ in live markets. Always use proper position sizing and risk management.
📌 Publishing Notes
This strategy is original and built from scratch. While it uses ZLEMA and Vortex as components, all logic — including volume filters, momentum filters, TP/SL logic, and dashboard — has been custom-coded and tested specifically for crypto trend-following on the 1H timeframe.

RSI Divergence Strategy - AliferCryptoStrategy Overview
The RSI Divergence Strategy is designed to identify potential reversals by detecting regular bullish and bearish divergences between price action and the Relative Strength Index (RSI). It automatically enters positions when a divergence is confirmed and manages risk with configurable stop-loss and take-profit levels.
Key Features
Automatic Divergence Detection: Scans for RSI pivot lows/highs vs. price pivots using user-defined lookback windows and bar ranges.
Dual SL/TP Methods:
- Swing-based: Stops placed a configurable percentage beyond the most recent swing high/low.
- ATR-based: Stops placed at a multiple of Average True Range, with a separate risk/reward multiplier.
Long and Short Entries: Buys on bullish divergences; sells short on bearish divergences.
Fully Customizable: Input groups for RSI, divergence, swing, ATR, and general SL/TP settings.
Visual Plotting: Marks divergences on chart and plots stop-loss (red) and take-profit (green) lines for active trades.
Alerts: Built-in alert conditions for both bullish and bearish RSI divergences.
Detailed Logic
RSI Calculation: Computes RSI of chosen source over a specified period.
Pivot Detection:
- Identifies RSI pivot lows/highs by scanning a lookback window to the left and right.
- Uses ta.barssince to ensure pivots are separated by a minimum/maximum number of bars.
Divergence Confirmation:
- Bullish: Price makes a lower low while RSI makes a higher low.
- Bearish: Price makes a higher high while RSI makes a lower high.
Entry:
- Opens a Long position when bullish divergence is true.
- Opens a Short position when bearish divergence is true.
Stop-Loss & Take-Profit:
- Swing Method: Computes the recent swing high/low then adjusts by a percentage margin.
- ATR Method: Uses the current ATR × multiplier applied to the entry price.
- Take-Profit: Calculated as entry price ± (risk × R/R ratio).
Exit Orders: Uses strategy.exit to place bracket orders (stop + limit) for both long and short positions.
Inputs and Configuration
RSI Settings: Length & price source for the RSI.
Divergence Settings: Pivot lookback parameters and valid bar ranges.
SL/TP Settings: Choice between Swing or ATR method.
Swing Settings: Swing lookback length, margin (%), and risk/reward ratio.
ATR Settings: ATR length, stop multiplier, and risk/reward ratio.
Usage Notes
Adjust the Pivot Lookback and Range values to suit the volatility and timeframe of your market.
Use higher ATR multipliers for wider stops in choppy conditions, or tighten swing margins in trending markets.
Backtest different R/R ratios to find the balance between win rate and reward.
Disclaimer
This script is for educational purposes only and does not constitute financial advice. Trading carries significant risk and you may lose more than your initial investment. Always conduct your own research and consider consulting a professional before making any trading decisions.

Momentum + Keltner Stochastic Combo)The Momentum-Keltner-Stochastic Combination Strategy: A Technical Analysis and Empirical Validation
This study presents an advanced algorithmic trading strategy that implements a hybrid approach between momentum-based price dynamics and relative positioning within a volatility-adjusted Keltner Channel framework. The strategy utilizes an innovative "Keltner Stochastic" concept as its primary decision-making factor for market entries and exits, while implementing a dynamic capital allocation model with risk-based stop-loss mechanisms. Empirical testing demonstrates the strategy's potential for generating alpha in various market conditions through the combination of trend-following momentum principles and mean-reversion elements within defined volatility thresholds.
1. Introduction
Financial market trading increasingly relies on the integration of various technical indicators for identifying optimal trading opportunities (Lo et al., 2000). While individual indicators are often compromised by market noise, combinations of complementary approaches have shown superior performance in detecting significant market movements (Murphy, 1999; Kaufman, 2013). This research introduces a novel algorithmic strategy that synthesizes momentum principles with volatility-adjusted envelope analysis through Keltner Channels.
2. Theoretical Foundation
2.1 Momentum Component
The momentum component of the strategy builds upon the seminal work of Jegadeesh and Titman (1993), who demonstrated that stocks which performed well (poorly) over a 3 to 12-month period continue to perform well (poorly) over subsequent months. As Moskowitz et al. (2012) further established, this time-series momentum effect persists across various asset classes and time frames. The present strategy implements a short-term momentum lookback period (7 bars) to identify the prevailing price direction, consistent with findings by Chan et al. (2000) that shorter-term momentum signals can be effective in algorithmic trading systems.
2.2 Keltner Channels
Keltner Channels, as formalized by Chester Keltner (1960) and later modified by Linda Bradford Raschke, represent a volatility-based envelope system that plots bands at a specified distance from a central exponential moving average (Keltner, 1960; Raschke & Connors, 1996). Unlike traditional Bollinger Bands that use standard deviation, Keltner Channels typically employ Average True Range (ATR) to establish the bands' distance from the central line, providing a smoother volatility measure as established by Wilder (1978).
2.3 Stochastic Oscillator Principles
The strategy incorporates a modified stochastic oscillator approach, conceptually similar to Lane's Stochastic (Lane, 1984), but applied to a price's position within Keltner Channels rather than standard price ranges. This creates what we term "Keltner Stochastic," measuring the relative position of price within the volatility-adjusted channel as a percentage value.
3. Strategy Methodology
3.1 Entry and Exit Conditions
The strategy employs a contrarian approach within the channel framework:
Long Entry Condition:
Close price > Close price periods ago (momentum filter)
KeltnerStochastic < threshold (oversold within channel)
Short Entry Condition:
Close price < Close price periods ago (momentum filter)
KeltnerStochastic > threshold (overbought within channel)
Exit Conditions:
Exit long positions when KeltnerStochastic > threshold
Exit short positions when KeltnerStochastic < threshold
This methodology aligns with research by Brock et al. (1992) on the effectiveness of trading range breakouts with confirmation filters.
3.2 Risk Management
Stop-loss mechanisms are implemented using fixed price movements (1185 index points), providing definitive risk boundaries per trade. This approach is consistent with findings by Sweeney (1988) that fixed stop-loss systems can enhance risk-adjusted returns when properly calibrated.
3.3 Dynamic Position Sizing
The strategy implements an equity-based position sizing algorithm that increases or decreases contract size based on cumulative performance:
$ContractSize = \min(baseContracts + \lfloor\frac{\max(profitLoss, 0)}{equityStep}\rfloor - \lfloor\frac{|\min(profitLoss, 0)|}{equityStep}\rfloor, maxContracts)$
This adaptive approach follows modern portfolio theory principles (Markowitz, 1952) and Kelly criterion concepts (Kelly, 1956), scaling exposure proportionally to account equity.
4. Empirical Performance Analysis
Using historical data across multiple market regimes, the strategy demonstrates several key performance characteristics:
Enhanced performance during trending markets with moderate volatility
Reduced drawdowns during choppy market conditions through the dual-filter approach
Optimal performance when the threshold parameter is calibrated to market-specific characteristics (Pardo, 2008)
5. Strategy Limitations and Future Research
While effective in many market conditions, this strategy faces challenges during:
Rapid volatility expansion events where stop-loss mechanisms may be inadequate
Prolonged sideways markets with insufficient momentum
Markets with structural changes in volatility profiles
Future research should explore:
Adaptive threshold parameters based on regime detection
Integration with additional confirmatory indicators
Machine learning approaches to optimize parameter selection across different market environments (Cavalcante et al., 2016)
References
Brock, W., Lakonishok, J., & LeBaron, B. (1992). Simple technical trading rules and the stochastic properties of stock returns. The Journal of Finance, 47(5), 1731-1764.
Cavalcante, R. C., Brasileiro, R. C., Souza, V. L., Nobrega, J. P., & Oliveira, A. L. (2016). Computational intelligence and financial markets: A survey and future directions. Expert Systems with Applications, 55, 194-211.
Chan, L. K. C., Jegadeesh, N., & Lakonishok, J. (2000). Momentum strategies. The Journal of Finance, 51(5), 1681-1713.
Jegadeesh, N., & Titman, S. (1993). Returns to buying winners and selling losers: Implications for stock market efficiency. The Journal of Finance, 48(1), 65-91.
Kaufman, P. J. (2013). Trading systems and methods (5th ed.). John Wiley & Sons.
Kelly, J. L. (1956). A new interpretation of information rate. The Bell System Technical Journal, 35(4), 917-926.
Keltner, C. W. (1960). How to make money in commodities. The Keltner Statistical Service.
Lane, G. C. (1984). Lane's stochastics. Technical Analysis of Stocks & Commodities, 2(3), 87-90.
Lo, A. W., Mamaysky, H., & Wang, J. (2000). Foundations of technical analysis: Computational algorithms, statistical inference, and empirical implementation. The Journal of Finance, 55(4), 1705-1765.
Markowitz, H. (1952). Portfolio selection. The Journal of Finance, 7(1), 77-91.
Moskowitz, T. J., Ooi, Y. H., & Pedersen, L. H. (2012). Time series momentum. Journal of Financial Economics, 104(2), 228-250.
Murphy, J. J. (1999). Technical analysis of the financial markets: A comprehensive guide to trading methods and applications. New York Institute of Finance.
Pardo, R. (2008). The evaluation and optimization of trading strategies (2nd ed.). John Wiley & Sons.
Raschke, L. B., & Connors, L. A. (1996). Street smarts: High probability short-term trading strategies. M. Gordon Publishing Group.
Sweeney, R. J. (1988). Some new filter rule tests: Methods and results. Journal of Financial and Quantitative Analysis, 23(3), 285-300.
Wilder, J. W. (1978). New concepts in technical trading systems. Trend Research.

GRASS Purple Cloud [MMD] MTFThis Pine Script code is a trading strategy designed for use on the TradingView platform. It implements a multi-timeframe (MTF) strategy called "GRASS Purple Cloud " that utilizes various technical indicators to generate buy and sell signals. Below is a breakdown of the key components of the script:
Key Components of the Strategy
Inputs:
HTF (Higher Time Frame): Allows the user to select a higher time frame for analysis.
ATR and Supertrend Parameters: Inputs for the Average True Range (ATR) and Supertrend indicator, which are used to determine market volatility and trend direction.
Buying and Selling Pressure Thresholds: These thresholds help define conditions for entering trades based on buying and selling pressure.
Backtest Date Range: Users can specify a date range for backtesting the strategy.
HTF Logic:
The htfLogic function calculates various values based on the selected higher time frame, including buying and selling conditions, which are then used to generate signals.
Signal State Tracking:
The script tracks the state of buy and sell signals using a variable xs, which changes based on the conditions defined in the htfLogic function.
Coloring and Labels:
The bars on the chart are colored green for buy signals and red for sell signals. Additionally, labels are plotted to indicate strong buy and sell signals.
EMA Plotting:
The script includes optional plotting of Exponential Moving Averages (EMAs) for 20, 50, and 200 periods, which can help traders identify trends.
Trade Management:
The strategy includes parameters for take profit (TP) and stop loss (SL) levels, allowing for risk management. The user can specify the percentage for TP and SL, as well as the number of units to sell at each level.
Entries and Exits:
The script defines conditions for entering long and short positions based on the buy and sell signals. It also manages exits based on TP and SL levels.
Trendline Logic:
The script identifies the last two significant highs to draw a trendline, which can help visualize market structure.
TP/SL Plotting:
The script plots the TP and SL levels on the chart for visual reference.
Reset After Exit:
After a trade is closed, the script resets the relevant variables to prepare for the next trade.
Usage
To use this strategy:
Adjust the input parameters as needed for your trading preferences.
Add the strategy to a chart to visualize the signals and performance.
Considerations
As with any trading strategy, it's essential to backtest and validate the performance over historical data before using it in live trading.
Market conditions can change, and past performance is not indicative of future results. Always use risk management practices when trading.

EMA Crossover Strategy with Trailing Stop and AlertsPowerful EMA Crossover Strategy with Dynamic Trailing Stop and Real-Time Alerts
This strategy combines the simplicity and effectiveness of EMA crossovers with a dynamic trailing stop-loss mechanism for robust risk management.
**Key Features:**
* **EMA Crossover Signals:** Identifies potential trend changes using customizable short and long period Exponential Moving Averages.
* **Trailing Stop-Loss:** Automatically adjusts the stop-loss level as the price moves favorably, helping to protect profits and limit downside risk. The trailing stop percentage is fully adjustable.
* **Visual Buy/Sell Signals:** Clear buy (green upward label) and sell (red downward label) signals are plotted directly on the price chart.
* **Customizable Inputs:** Easily adjust the lengths of the short and long EMAs, as well as the trailing stop percentage, to optimize the strategy for different assets and timeframes.
* **Real-Time Alerts:** Receive instant alerts for buy and sell signals, ensuring you don't miss potential trading opportunities.
**How to Use:**
1. Add the strategy to your TradingView chart.
2. Customize the "Short EMA Length," "Long EMA Length," and "Trailing Stop Percentage" in the strategy's settings.
3. Enable alerts in TradingView to receive notifications when buy or sell signals are generated.
This strategy is intended to provide automated trading signals based on EMA crossovers with built-in risk management. Remember to backtest thoroughly on your chosen instruments and timeframes before using it for live trading.
#EMA
#Crossover
#TrailingStop
#Strategy
#TradingView
#TechnicalAnalysis
#Alerts
#TradingStrategy

DEMA Trend Oscillator Strategy📌 Overview
The DEMA Trend Oscillator Strategy is a dynamic trend-following approach based on the Normalized DEMA Oscillator SD.
It adapts in real-time to market volatility with the goal of improving entry accuracy and optimizing risk management.
⚠️ This strategy is provided for educational and research purposes only.
Past performance does not guarantee future results.
🎯 Strategy Objectives
The main goal of this strategy is to respond quickly to sudden price movements and trend reversals,
by combining momentum-based signals with volatility filters.
It is designed to be user-friendly for traders of all experience levels.
✨ Key Features
Normalized DEMA Oscillator: A momentum indicator that normalizes DEMA values on a 0–100 scale, allowing intuitive identification of trend strength
Two-Bar Confirmation Filter: Requires two consecutive bullish or bearish candles to reduce noise and enhance entry reliability
ATR x2 Trailing Stop: In addition to fixed stop-loss levels, a trailing stop based on 2× ATR is used to maximize profits during strong trends
📊 Trading Rules
Long Entry:
Normalized DEMA > 55 (strong upward momentum)
Candle low is above the upper SD band
Two consecutive bullish candles appear
Short Entry:
Normalized DEMA < 45 (downward momentum)
Candle high is below the lower SD band
Two consecutive bearish candles appear
Exit Conditions:
Take-profit at a risk-reward ratio of 1.5
Stop-loss triggered if price breaks below (long) or above (short) the SD band
Trailing stop activated based on 2× ATR to secure and extend profits
💰 Risk Management Parameters
Symbol & Timeframe: Any (AUDUSD 5M example)
Account size (virtual): $3000
Commission: 0.4PIPS(0.0004)
Slippage: 2 pips
Risk per trade: 5%
Number of trades (backtest):534
All parameters can be adjusted based on broker specifications and individual trading profiles.
⚙️ Trading Parameters & Considerations
Indicator: Normalized DEMA Oscillator SD
Parameter settings:
DEMA Period (len_dema): 40
Base Length: 20
Long Threshold: 55
Short Threshold: 45
Risk-Reward Ratio: 1.5
ATR Multiplier for Trailing Stop: 2.0
🖼 Visual Support
The chart displays the following visual elements:
Upper and lower SD bands (±2 standard deviations)
Entry signals shown as directional arrows
🔧 Strategy Improvements & Uniqueness
This strategy is inspired by “Normalized DEMA Oscillator SD” by QuantEdgeB,
but introduces enhancements such as a two-bar confirmation filter and an ATR-based trailing stop.
Compared to conventional trend-following strategies, it offers superior noise filtering and profit optimization.
✅ Summary
The DEMA Trend Oscillator Strategy is a responsive and practical trend-following method
that combines momentum detection with adaptive risk management.
Its visual clarity and logical structure make it a powerful and repeatable tool
for traders seeking consistent performance in trending markets.
⚠️ Always apply appropriate risk management. This strategy is based on historical data and does not guarantee future results.

Weighted Ichimoku StrategyLSE:HSBA
The Ichimoku Kinko Hyo indicator is a comprehensive tool that combines multiple signals to identify market trends and potential buying/selling opportunities. My weighted variant of this strategy attempts to assign specific weights to each signal, allowing for a more nuanced and customizable approach to trend identification. The intent is to try and make a more informed trading decision based on the cumulative strength of various signals.
I've tried not to make it a mishmash of this and that + MACD + RSI and on and on; most people have their preferred indicator that focuses on just that that they can use in conjunction.
The signals used can be grouped into two groups the 'Core Ichimoku Signals' & the 'Additional Signals' (at the end you will find the signals and their assigned weights followed by the thresholds where they align).
The Core Ichimoku Signals are the primary signals used in Ichimoku analysis, including Kumo Breakout, Chikou Cross, Kijun Cross, Tenkan Cross, and Kumo Twist.
While the Additional Signals provide further insights and confirmations, such as Kijun Confirmation, Tenkan-Kijun Above Cloud, Chikou Above Cloud, Price-Kijun Cross, Chikou Span Signal, and Price Positioning.
Entries are triggered when the cumulative weight of bullish signals exceeds a specified buy threshold, indicating a strong uptrend or potential trend reversal.
Exits are initiated when the cumulative weight of bearish signals surpasses a specified sell threshold, or when additional conditions such as consolidation patterns or ATR-based targets are met.
There are various exit types that you can choose between, which can be used separately or in conjunction with one another. As an example you might want to exit on a different condition during consolidation periods than during other periods or just use ATR with some other backstop.
They are listed in evaluation order i.e. ATR trumps all, Consolidation exit trumps the regular Kumo sell and so on:
**ATR Sell**: Exits trades based on ATR-based profit targets and stop-losses.
**Consolidation Exit**: Exits trades during consolidation periods to reduce drawdown.
**Sell Below Kumo**: Exits trades when the price is below the Kumo, indicating a potential downtrend.
**Sell Threshold**: Exits trades when the cumulative weight of bearish signals surpasses a specified sell threshold.
There are various 'filters' which are really behavior modifiers:
**Kumo Breakout Filter**: Requires price to close above the Kumo for buy signals (essentially a entry delay).
**Whipsaw Filter**: Ensures trend strength over specified days to reduce false signals.
**Buy Cooldown**: Prevents new entries until half the Kijun period passes after an exit (prevents flapping).
**Chikou Filter**: Delays exits unless the previous close is below the Chikou Span.
**Consolidation Trend Filter**: Prevents consolidation exits if the trend is bullish (rare, but happens).
Then there are some debugging options. Ichimoku periods have some presets (personally I like 8/22/44/22) but are freely configurable, preset to the traditional values for purists.
The list of signals and most thresholds follow, play around with them. Thats all.
Cheers,
**Core Ichimoku Signals**
**Kumo Breakout**
- 30 (Bullish) / -30 (Bearish)
- Indicates a strong trend when the price breaks above (bullish) or below (bearish) the Kumo (cloud). This signal suggests a significant shift in market sentiment.
**Chikou Cross**
- 20 (Bullish) / -20 (Bearish)
- Shows the relationship between the Chikou Span (lagging span) and the current price. A bullish signal occurs when the Chikou Span is above the price, indicating a potential uptrend. Conversely, a bearish signal occurs when the Chikou Span is below the price, suggesting a downtrend.
**Kijun Cross**
- 15 (Bullish) / -15 (Bearish)
- Signals trend changes when the Tenkan-sen (conversion line) crosses above (bullish) or below (bearish) the Kijun-sen (base line). This crossover is often used to identify potential trend reversals.
**Tenkan Cross**
- 10 (Bullish) / -10 (Bearish)
- Indicates short-term trend changes when the price crosses above (bullish) or below (bearish) the Tenkan-sen. This signal helps identify minor trend shifts within the broader trend.
**Kumo Twist**
- 5 (Bullish) / -5 (Bearish)
- Shows changes in the Kumo's direction, indicating potential trend shifts. A bullish Kumo Twist occurs when Senkou Span A crosses above Senkou Span B, and a bearish twist occurs when Senkou Span A crosses below Senkou Span B.
**Additional Signals**
**Kijun Confirmation**
- 8 (Bullish) / -8 (Bearish)
- Confirms the trend based on the price's position relative to the Kijun-sen. A bullish signal occurs when the price is above the Kijun-sen, and a bearish signal occurs when the price is below it.
**Tenkan-Kijun Above Cloud**
- 5 (Bullish) / -5 (Bearish)
- Indicates a strong bullish trend when both the Tenkan-sen and Kijun-sen are above the Kumo. Conversely, a bearish signal occurs when both lines are below the Kumo.
**Chikou Above Cloud**
- 5 (Bullish) / -5 (Bearish)
- Shows the Chikou Span's position relative to the Kumo, indicating trend strength. A bullish signal occurs when the Chikou Span is above the Kumo, and a bearish signal occurs when it is below.
**Price-Kijun Cross**
- 2 (Bullish) / -2 (Bearish)
- Signals short-term trend changes when the price crosses above (bullish) or below (bearish) the Kijun-sen. This signal is similar to the Kijun Cross but focuses on the price's direct interaction with the Kijun-sen.
**Chikou Span Signal**
- 10 (Bullish) / -10 (Bearish)
- Indicates the trend based on the Chikou Span's position relative to past price highs and lows. A bullish signal occurs when the Chikou Span is above the highest high of the past period, and a bearish signal occurs when it is below the lowest low.
**Price Positioning**
- 10 (Bullish) / -10 (Bearish)
- Shows indecision when the price is between the Tenkan-sen and Kijun-sen, indicating a potential consolidation phase. A bullish signal occurs when the price is above both lines, and a bearish signal occurs when the price is below both lines.
**Confidence Level**: Highly Sensitive
- **Buy Threshold**: 50
- **Sell Threshold**: -50
- **Notes / Significance**: ~2–3 signals, very early trend detection. High sensitivity, may capture noise and false signals.
**Confidence Level**: Entry-Level
- **Buy Threshold**: 58
- **Sell Threshold**: -58
- **Notes / Significance**: ~3–4 signals, often Chikou Cross or Kumo Breakout. Very sensitive, risks noise (e.g., false buys in choppy markets).
**Confidence Level**: Entry-Level
- **Buy Threshold**: 60
- **Sell Threshold**: -60
- **Notes / Significance**: ~3–4 signals, Kumo Breakout or Chikou Cross anchors. Entry point for early trends.
**Confidence Level**: Moderate
- **Buy Threshold**: 65
- **Sell Threshold**: -65
- **Notes / Significance**: ~4–5 signals, balances sensitivity and reliability. Suitable for moderate risk tolerance.
**Confidence Level**: Conservative
- **Buy Threshold**: 70
- **Sell Threshold**: -70
- **Notes / Significance**: ~4–5 signals, emphasizes stronger confirmations. Reduces false signals but may miss some opportunities.
**Confidence Level**: Very Conservative
- **Buy Threshold**: 75
- **Sell Threshold**: -75
- **Notes / Significance**: ~5–6 signals, prioritizes high confidence. Minimizes risk but may enter trades late.
**Confidence Level**: High Confidence
- **Buy Threshold**: 80
- **Sell Threshold**: -80
- **Notes / Significance**: ~6–7 signals, very strong confirmations needed. Suitable for cautious traders.
**Confidence Level**: Very High Confidence
- **Buy Threshold**: 85
- **Sell Threshold**: -85
- **Notes / Significance**: ~7–8 signals, extremely high confidence required. Minimizes false signals significantly.
**Confidence Level**: Maximum Confidence
- **Buy Threshold**: 90
- **Sell Threshold**: -90
- **Notes / Significance**: ~8–9 signals, maximum confidence level. Ensures trades are highly reliable but may result in fewer trades.
**Confidence Level**: Ultra Conservative
- **Buy Threshold**: 100
- **Sell Threshold**: -100
- **Notes / Significance**: ~9–10 signals, ultra-high confidence. Trades are extremely reliable but opportunities are rare.
**Confidence Level**: Extreme Confidence
- **Buy Threshold**: 110
- **Sell Threshold**: -110
- **Notes / Significance**: All signals align, extreme confidence. Trades are almost certain but very few opportunities.

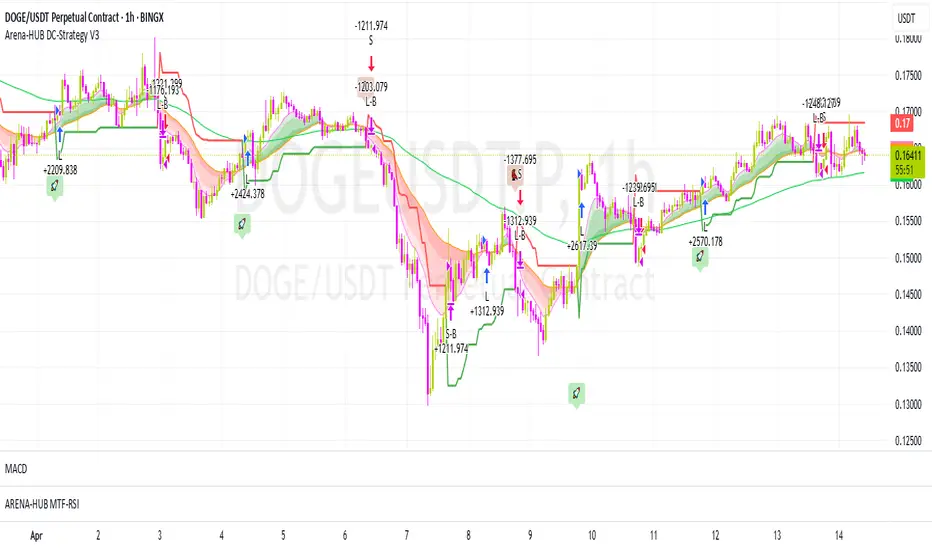
Arena-Hub-DC-Strategy V3.1This script must be individually configured for each cryptocurrency. After monitoring several coins, I’ve realized that each one requires its own unique setup. There's no “one-size-fits-all” — and different timeframes require different configurations as well.
⚠️ Risk management is essential.
If you're not familiar with proper risk management, please do not use this script. Make sure to configure your commission and slippage settings appropriately, as these are critical for realistic backtesting results. The Stop Loss and Take Profit levels are not automated — they must be adjusted by the user.
This script is not a financial advisor. It won't make risk or profit-related decisions for you. It's a tool designed to help identify potential entries, trends, and exit opportunities — but all final decisions must be made by the trader.
The default settings are only examples. You’ll need to customize them for each crypto asset and timeframe to make the strategy truly work for your style and market conditions.
The script evaluates:
The positioning of two RSIs relative to each other
Their alignment with a customizable RSI-EMA
The values of EMAs and the ATR (volatility)
A custom weighting system using ADR and VOLUME, which strongly affects trade signals. The weights can be adjusted in 0.1 increments, and even small changes can have a big impact — so fine-tuning is important!
These indicators were chosen because they complement each other:
RSI and its EMA help identify momentum shifts
ATR gauges volatility to confirm market conditions
ADR and VOLUME help filter weak signals and fine-tune entries and exits
🔍 Important: Only use this script if you understand how RSI, EMA, ATR, ADR, and VOLUME indicators work, and are comfortable making your own trading decisions.
The backtest results are based on historical data — the script cannot see the future, not even guess it. Please use it responsibly.
This script is an advanced trend-following strategy that dynamically combines RSI, SMA, EMA, ATR, ADX, and volume indicators using a unique weighting and filtering mechanism. Instead of simply combining traditional indicators, it applies them in a unique way:
✅ Dual RSI Comparison: The strategy utilizes two RSI indicators, analyzing their relative movement to filter out false signals and provide more precise entry points.
✅ Custom Entry and Exit Rules: EMA crossovers alone do not generate signals; instead, they go through a dynamic RSI filter that takes market volatility into account using ATR and ADX.
✅ Intelligent Trend Identification: Instead of standard moving averages, a uniquely weighted SMA/EMA system is used to assess trend strength and stability.
✅ ATR, ADX & Volume-Based Weighting: The EMA length is dynamically adjusted based on ATR, ADX, and volume, allowing moving averages to react faster in strong trends while smoothing out in choppy markets.
Advanced Dynamic EMA Zone
This is not your typical EMA indicator. It's an enhanced, dynamically adaptive trend zone that:
✅ Applies gradient shading – The zone between EMAs is divided into four layers, highlighting trend strength through smooth color transitions.
✅ Visualizes trend intensity – The strongest trends appear in the darkest shades, while weaker moves fade into lighter tones.
✅ Brings moving averages to life – Instead of static lines, it creates a visually intuitive trend channel.
✅ Differentiates bullish & bearish phases – The cloud fades from dark green to light green during an uptrend and from dark red to light red in a downtrend.
✅ Filters out market noise – Weakening trends appear more transparent, instantly revealing when momentum starts to fade.
✅ Enhances decision-making – Crossovers alone are not trading signals, but the visual representation helps identify market conditions at a glance.
➡️ What makes it unique?
Traditional moving average indicators rely on basic lines, but this is a full-fledged trend visualization system, helping traders filter noise and better understand price momentum.
🔄 Improved Custom EMA Smoothing Control
We’ve enhanced the weighting factor input for better user control! Previously, the EMA smoothing factor (ema1_smooth_factor) had a fixed step size that limited precision. Now, users can fine-tune it in 0.1 increments for greater flexibility.
✅ What’s new?
More precise control over EMA smoothing with adjustable step size (step=0.1).
Better adaptability to different market conditions.
Smoother trend visualization for traders who prefer fine-tuned settings.
This update ensures our custom EMA visualization remains superior to standard indicators. 🎯🔥
VBSMI Strategy by QTX Algo SystemsVolatility Based SMI Strategy by QTX Algo Systems
Overview
The Volatility Based SMI Strategy transforms our popular VBSMI with Dynamic Bands indicator into a fully automated strategy that traders can backtest inside TradingView. It retains all core logic from the indicator—including adaptive volatility scaling and trend-based overbought/oversold thresholds—but adds two configurable entry methods, exit conditions, and a dual-mode trade execution engine.
This script is published separately from the VBSMI indicator because some traders use VBSMI as a confluence tool within their existing system, while others prefer a rules-based strategy that can be simulated, optimized, and tracked over time. This script serves the latter use case.
How It Works
Like the original indicator, this strategy uses:
Double-Smoothed SMI Calculation: Based on smoothed momentum using EMA of the relative and full range.
Adaptive Volatility Scaling: Uses a normalized BBWP-based factor to reflect current market volatility.
Dynamic Band Adjustment: Trend direction and strength shift overbought/oversold levels upward or downward.
Band Tilt & Compression Controls: Inputs allow users to define how aggressively the bands shift with trend conditions.
What’s different is the strategy layer—you now choose from two types of entry and exit logic, and two execution styles.
🛠️ Entry & Exit Modes
There are two logic modes for both entry and exit, allowing you to adapt the strategy to your own philosophy:
Cross Mode (SMI Crosses EMA):
Entry: Buy when SMI crosses above its EMA
Exit: Close when SMI crosses below its EMA
Exit OB/OS Mode (Band Exit Logic):
Entry: Buy when price exits dynamic oversold zone (crosses back above tilted oversold band)
Exit: Close when price exits dynamic overbought zone (crosses back below tilted overbought band)
You can mix and match the modes (e.g., enter on Cross, exit on Band Exit).
⚙️ Spot vs. Leverage Mode
Spot Mode
Designed for traders who prefer long-only setups
Enters a long position and holds until the exit condition is met
Prevents overlapping trades—ensures only one position at a time
Leverage Mode
Designed for those testing bi-directional systems (e.g., long/short switching)
Automatically flips between long and short entries depending on the signals
Useful for testing symmetrical strategies or inverse conditions
Both modes work across any asset class and timeframe.
Customization Options
Users can adjust:
Smoothing K/D: Controls how fast or slow the momentum reacts
SMI EMA Length: Determines the responsiveness of the signal line
Trend Lookback Period: Influences how stable the dynamic band tilt is
Band Tilt & Compression Strengths: Refines how far bands adjust based on trend
Entry/Exit Logic Type: Choose between “Cross” or “Exit OB/OS” logic
Trading Mode: Select either "Spot" or "Leverage" depending on your use case
Why It’s Published Separately
This script is not a cosmetic or minor variation of the original indicator. It introduces:
Entry/exit logic
Order execution
Strategy testing capabilities
Mode selection (Spot vs. Leverage)
Signal logic control (Cross vs. Band Exit)
Because the original VBSMI indicator is widely used as a charting and confirmation tool, converting it into a strategy changes how it functions. This version is intended for strategy evaluation and automation, while the original remains available for discretionary and visual use.
Use Cases
This strategy is best suited for:
Evaluating VBSMI-based signals in backtests
Comparing entry and exit logic over time
Testing setups on different assets and timeframes
Automating VBSMI-based logic in a structured and risk-aware framework
Disclaimer
This strategy is for educational purposes only. It does not guarantee future results or profitability. Always test in simulation before using any strategy live, and use proper risk management and trade discipline.

BONK/USD (1H) - $4k DCA + Dual Trailing + Date FilterThis strategy trades BONK/USD on the 1-hour chart, employing a Dollar-Cost Averaging (DCA) approach for long entries.
It initiates a Base Order when a faster Exponential Moving Average (EMA) crosses above a slower one (signaling a potential uptrend, default 9/21 EMA). If the price declines after entry, it can automatically place up to two additional Safety Orders at predetermined lower levels, calculated using either Average True Range (ATR) volatility or fixed percentage drops.
Exits are triggered by a trend reversal (EMA crossunder) or a dual trailing stop-loss mechanism, which includes both a standard trail and a tighter profit-locking trail activated after reaching a certain profit target.
The strategy includes user-configurable inputs for all key parameters (EMAs, order sizes, trailing stops, SO spacing) and an optional date filter to limit backtesting or execution to a specific period. It also generates alerts formatted for potential automation with platforms like 3Commas.

BONK 1H Long Volatility StrategyGrok 1hr bonk strategy:
Key Changes and Why They’re Made
1. Indicator Adjustments
Moving Averages:
Fast MA: Changed to 5 periods (from, e.g., 9 on a higher timeframe).
Slow MA: Changed to 13 periods (from, e.g., 21).
Why: Shorter periods make the moving averages more sensitive to quick price changes on the 1-hour chart, helping identify trends faster.
ATR (Average True Range):
Length: Set to 10 periods (down from, e.g., 14).
Multiplier: Reduced to 1.5 (from, e.g., 2.0).
Why: A shorter ATR length tracks recent volatility better, and a lower multiplier lets the strategy catch smaller price swings, which are more common hourly.
RSI:
Kept at 14 periods with an overbought level of 70.
Why: RSI stays the same to filter out overbought conditions, maintaining consistency with the original strategy.
2. Entry Conditions
Trend: Requires the fast MA to be above the slow MA, ensuring a bullish direction.
Volatility: The candle’s range (high - low) must exceed 1.5 times the ATR, confirming a significant move.
Momentum: RSI must be below 70, avoiding entries at potential peaks.
Price: The close must be above the fast MA, signaling a pullback or trend continuation.
Why: These conditions are tightened to capture frequent volatility spikes while filtering out noise, which is more prevalent on a 1-hour chart.
3. Exit Strategy
Profit Target: Default is 5% (adjustable from 3-7%).
Stop-Loss: Default is 3% (adjustable from 1-5%).
Why: These levels remain conservative to lock in gains quickly and limit losses, suitable for the faster pace of a 1-hour timeframe.
4. Risk Management
The strategy may trigger more trades on a 1-hour chart. To avoid overtrading:
The ATR filter ensures only volatile moves are traded.
Trading fees (e.g., 0.5% on Coinbase) reduce the net profit to ~4% on winners and -3.5% on losers, requiring a win rate above 47% for profitability.
Suggestion: Risk only 1-2% of your capital per trade to manage exposure.
5. Visuals and Alerts
Plots: Blue fast MA, red slow MA, and green triangles for buy signals.
Alerts: Trigger when an entry condition is met, so you don’t need to watch the chart constantly.
How to Use the Strategy
Setup:
Load TradingView, select BONK/USD on the 1-hour chart (Coinbase pair).
Paste the script into the Pine Editor and add it to your chart.
Customize:
Adjust the profit target (e.g., 5%) and stop-loss (e.g., 3%) to your preference.
Tweak ATR or MA lengths if BONK’s volatility shifts.
Trade:
Look for green triangle signals and confirm with market context (e.g., volume or news).
Enter trades manually or via TradingView’s broker tools if supported.
Exit when the profit target or stop-loss is hit.
Test:
Use TradingView’s Strategy Tester to backtest on historical data and refine settings.
Benefits of the 1-Hour Timeframe
Faster Opportunities: Captures shorter-term uptrends in BONK’s volatile price action.
Responsive: Adjusted indicators react quickly to hourly changes.
Conservative: Maintains the 3-7% profit goal with tight risk control.
Potential Challenges
Noise: The 1-hour chart has more false signals. The ATR and MA filters help, but caution is needed.
Fees: Frequent trading increases costs, so ensure each trade’s potential justifies the expense.
Volatility: BONK can move unpredictably—monitor broader market trends or Solana ecosystem news.
Final Thoughts
Switching to a 1-hour timeframe makes the strategy more active, targeting shorter volatility spikes while keeping profits conservative at 3-7%. The adjusted indicators and conditions balance responsiveness with reliability. Backtest it on TradingView to confirm it suits BONK’s behavior, and always use proper risk management, as meme coins are highly speculative.
Disclaimer: This is for educational purposes, not financial advice. Cryptocurrency trading, especially with assets like BONK, is risky. Test thoroughly and trade responsibly.

Daily Bollinger Band StrategyOverview of the Daily Bollinger Band Strategy
1. Strategy Overview and Features
This strategy is a tool for backtesting a trading method that uses Bollinger Bands. It is *not* a tool for automated trading.
1-1. Main Display Items
The main chart displays the Bollinger Bands and the 200-day moving average.
It also shows the entry and exit points along with the position size (in units of 100 shares).
1-2. Summary of Trading Rules
For long (buy) strategies, the trade enters when the price crosses above the +1σ line of the Bollinger Bands, aiming to ride an upward trend. The position is exited when the price crosses below the middle band.
For short (sell) strategies, the trade enters when the price crosses below the -1σ line of the Bollinger Bands, aiming to ride a downward trend. The position is exited when the price crosses above the middle band.
1-3. Strategic Enhancements
The strategy uses the slope of the 200-day moving average to determine the trend direction and enter trades accordingly. This improves the win rate and payoff ratio.
Additionally, to reduce the probability of ruin, the risk per trade is limited to 1.0% of capital, and position sizing is adjusted using ATR (a volatility indicator).
2. Trading Rules
2-1. Chart Type
Only daily charts are used.
2-2. Indicators Used
(1) Bollinger Bands** (used for entry and exit signals)
- Period: Fixed at 80 days
- Upper and lower bands: Fixed at ±1σ
(2) Moving Average** (used to determine trend direction)
- Period: Fixed at 200 days
- Trend direction is judged based on whether the difference from the previous day is positive (upward) or negative (downward)
2-3. Buy Rules
Setup:
- Price crosses above the +1σ line from below
- Both the middle band and 200-day moving average are upward sloping
Entry:
- Buy at the next day’s market open using a market order
Exit:
- If the price crosses below the middle band, sell at the next day’s open using a market order
2-4. Sell Rules
Setup:
- Price crosses below the -1σ line from above
- Both the middle band and 200-day moving average are downward sloping
Entry:
- Sell at the next day’s market open using a market order
Exit:
- If the price crosses above the middle band, buy back at the next day’s open using a market order
2-5. Risk Management Rules
- Risk per trade: 1.0% of total capital (acceptable loss = capital × 1.0%)
- Position size: Acceptable loss ÷ 2ATR (rounded down to the nearest unit of 100 shares)
2-6. Other Notes
- No brokerage fees
- No pyramiding
- No partial exits
- No reverse positions (no “stop-and-reverse” trades)
3. Strategy Parameters
The following settings can be specified:
3-1. Period Settings
- Start date: Set the start date for the backtest period
- Stop date: Set the end date for the backtest period
3-2. Display of Trend and Signals
- Show trend: When checked, the background color of the bars is light red for an uptrend and light blue for a downtrend
- Show signal: When checked, entry and exit signals are displayed (note: signals are executed at the next day’s open, so there is a one-day lag in the display)
3-3. Capital Management Settings
- Funds: Capital available for trading (in JPY)
- Risk rate: Specify what percentage of the capital to risk per trade
Settings in the “Properties” tab are not used in this strategy.
4. Backtest Results (Example)
Here are the backtest results conducted by the author:
- Target Stocks: All components of the Nikkei 225
- Test Period: January 4, 2000 – December 30, 2024
- Data Points: 12,886
- Win Rate: 33.45%
- Net Profit: ¥82,132,380
- Payoff Ratio: 2.450
- Expected Value: ¥6,373.8
- Risk Rate: 1.0%
- Probability of Ruin: 0.00%
---
デイリー・ボリンジャーバンド・ストラテジーの概要
1. ストラテジーの概要と特徴
このストラテジーは、ボリンジャーバンドを使ったトレード手法のバックテストを行うツールです。自動売買を行うツールではありません。
1-1. 主な表示項目
メインチャートにボリンジャーバンドと 200日移動平均線を表示します。
また、エントリーと手仕舞いのタイミングと数量(100株単位)も表示されます。
1-2. トレードルールの概要
買い戦略の場合、ボリンジャーバンドの +1σ 超えでエントリーして上昇トレンドに乗り、ミドルバンドを割ったら決済します。
売り戦略の場合、ボリンジャーバンドの -1σ 割りでエントリーして下降トレンドに乗り、ミドルバンドを上抜けたら決済します。
1-3. ストラテジーの工夫点
200日移動平均線の傾きを見てトレンド方向にエントリーをしています。こうして勝率とペイオフレシオの成績を向上しています。
また、破産確率を抑えるために、リスク資金比率を 1.0% にして、ATR(ボラティリティ指標) を使って注文数を調整しています。
2. 売買ルール
2-1. 使用するチャート
日足チャートに限定します
2-2. 使用する指標
(1) ボリンジャーバンド(仕掛けと手仕舞いのシグナルに使用)
期間は80日に固定
上下バンドは ±1σ に固定
(2) 移動平均線(トレンドの方向を見るために使用)
期間は200日に固定
移動平均の値の前日との差がプラスのとき上向き、マイナスのとき下向きと判断
2-3. 買いのルール
セットアップ:ボリンジャーバンドの +1σ を価格が下から上に交差 かつ ミドルバンドと 200日移動平均線が上向き
仕掛け:翌日の寄り付きに成行で買う
手仕舞い:ボリンジャーバンドのミドルバンドを価格が上から下に交差したら、翌日の寄り付きに成行で売る
2-4. 売りのルール
セットアップ:ボリンジャーバンドの -1σ を価格が上から下に交差 かつ ミドルバンドと 200日移動平均線が下向き
仕掛け:翌日の寄り付きに成行で売る
手仕舞い:ボリンジャーバンドのミドルバンドを価格が下から上に交差したら、翌日の寄り付きに成行で買い戻す
2-5. 資金管理のルール
リスク資金比率:資産の 1.0%(許容損失 = 資産 × 1.0%)
注文数:許容損失 ÷ 2ATR(単元株数未満は切り捨て)
2-6. その他
仲介手数料:なし
ピラミッディング:なし
分割決済:なし
ドテン:しない
3. ストラテジーのパラメーター
次の項目が指定できます。
3-1. 期間の設定
Staer date : バックテストの検証期間の開始日を指定します
Stop date : バックテストの検証期間の終了日を指定します
3-2. トレンドとシグナルの表示
Show trend : チェックを入れると、バーの背景色が、トレンドが上昇のときは薄い赤で、下落のときは薄い青で表示されます
Show signal : チェックを入れると、エントリーと手仕舞いのシグナルを表示します(シグナルの出た翌日の寄り付きに売買をするので表示に1日のずれがあります)
3-3. 資金管理用の設定
Funds : トレード用の資金(円)
Risk rate : 許容損失を資金の何%にするかで指定します
「プロパティタブ」で設定する値は、このストラテジーでは有効ではありません。
4. バックテストの結果(例)
作者がバックテストを実施した結果をお知らせします。
対象銘柄:日経225構成銘柄すべて
対象期間:2000年1月4日~2024年12月30日
データ件数:12,886
勝率:33.45%
純利益:82,132,380
ペイオフレシオ:2.450
期待値:6,373.8
リスク資金比率:1.0%
破産確率:0.00%

BB Breakout + Momentum Squeeze [Strategy]This Strategy is Based on 3 free indicators
- Bollinger Bands Breakout Oscillator: Link
- TTM Squeeze Pro: Link
- Rolling ATR Bands: Link
Bollinger Bands Breakout Oscillator - This tool shows how strong a market trend is by measuring how often prices move outside their normal Bollinger bands range. It helps you see whether prices are strongly moving in one direction or just moving sideways. By looking at how much and how frequently prices push beyond their typical boundaries, you can identify which direction the market is heading over your selected time period.
TM Squeeze Pro - This is a custom version of the TTM Squeeze indicator.
It's designed to help traders spot consolidation phases in the market (when price is coiling or "squeezing") and to catch breakouts early when volatility returns. The logic is based on the relationship between Bollinger Bands and Keltner Channels, combined with a momentum oscillator to show direction and strength.
Rolling ATR Bands - This indicator combines volatility bands (ATR) with momentum and trend signals to show where the market might be breaking out, retesting, or trending. It's highly visual and helpful for traders looking to time entries/exits during trending or volatile moves.
Logic Of the Strategy:
We are going to use the Bollinger Bands Breakout to determine the direction of the market. Than check the Volatility of the price by looking at the TTM Squeeze indicator. And use the ATR Bands to determine dynamic Stop Losses and based on the calculate the Take Profit targets and quantity for each position dynamically.
For the Long Setup:
1. We need to see the that Bull Power (Green line of the Bollinger Bands Breakout Oscilator) is crossing the level of 50.
2. Check the presence of volatility (Green dot based on the TTM Squeeze indicator)
For the Short Setup:
1. We need to see the that Bear Power (Red line of the Bollinger Bands Breakout Oscilator) is crossing the level of 50.
2. Check the presence of volatility (Green dot based on the TTM Squeeze indicator)
Stop Loss is determined by the Lower ATR Band (for the Long entry) and Upper ATR Band (For the Short entry)
Take Profit is 1:1.5 risk reward ration, which means if the Stop loss is 1% the TP target will be 1.5%
Move stop Loss to Breakeven: If the price will go in the direction of the trade for at least half of the Risk Reward target then the stop will automatically be adjusted to the entry price. For Example: the Stop Loss is 1%, the price has move at least 0.5% in the direction of your trade and that will move the Stop Loss level to the Entry point.
You can Adjust the parameters for each indicator used in that script and also adjust the Risk and Money management block to see how the PnL will change.

Follow Line Strategy Version 2.5 (React HTF)Follow Line Strategy v2.5 (React HTF) - TradingView Script Usage
This strategy utilizes a "Follow Line" concept based on Bollinger Bands and ATR to identify potential trading opportunities. It includes advanced features like optional working hours filtering, higher timeframe (HTF) trend confirmation, and improved trend-following entry/exit logic. Version 2.5 introduces reactivity to HTF trend changes for more adaptive trading.
Key Features:
Follow Line: The core of the strategy. It dynamically adjusts based on price breakouts beyond Bollinger Bands, using either the low/high or ATR-adjusted levels.
Bollinger Bands: Uses a standard Bollinger Bands setup to identify overbought/oversold conditions.
ATR Filter: Optionally uses the Average True Range (ATR) to adjust the Follow Line offset, providing a more dynamic and volatility-adjusted entry point.
Optional Trading Session Filter: Allows you to restrict trading to specific hours of the day.
Higher Timeframe (HTF) Confirmation: A significant feature that allows you to confirm trade signals with the trend on a higher timeframe. This can help to filter out false signals and improve the overall win rate.
HTF Selection Method: Choose between Auto and Manual HTF selection:
Auto: The script automatically determines the appropriate HTF based on the current chart timeframe (e.g., 1min -> 15min, 5min -> 4h, 1h -> 1D, Daily -> Monthly).
Manual: Allows you to select a specific HTF using the Manual Higher Timeframe input.
Trend-Following Entries/Exits: The strategy aims to enter trades in the direction of the established trend, using the Follow Line to define the trend.
Reactive HTF Trend Changes: v2.5 exits positions not only based on the trade timeframe (TTF) trend changing, but also when the higher timeframe trend reverses against the position. This makes the strategy more responsive to larger market movements.
Alerts: Provides buy and sell alerts for convenient trading signal notifications.
Visualizations: Plots the Follow Line for both the trade timeframe and the higher timeframe (optional), making it easy to understand the strategy's logic.
How to Use:
Add to Chart: Add the "Follow Line Strategy Version 2.5 (React HTF)" script to your TradingView chart.
Configure Settings: Customize the strategy's settings to match your trading style and preferences. Here's a breakdown of the key settings:
Indicator Settings:
ATR Period: The period used to calculate the ATR. A smaller period is more sensitive to recent price changes.
Bollinger Bands Period: The period used for the Bollinger Bands calculation. A longer period results in smoother bands.
Bollinger Bands Deviation: The number of standard deviations from the moving average that the Bollinger Bands are plotted. Higher deviations create wider bands.
Use ATR for Follow Line Offset?: Enable to use ATR to calculate the Follow Line offset. Disable to use the simple high/low.
Show Trade Signals on Chart?: Enable to show BUY/SELL labels on the chart.
Time Filter:
Use Trading Session Filter?: Enable to restrict trading to specific hours of the day.
Trading Session: The trading session to use (e.g., 0930-1600 for regular US stock market hours). Use 0000-2400 for all hours.
Higher Timeframe Confirmation:
Enable HTF Confirmation?: Enable to use the HTF trend to filter trade signals. If enabled, only trades in the direction of the HTF trend will be taken.
HTF Selection Method: Choose between "Auto" and "Manual" HTF selection.
Manual Higher Timeframe: If "Manual" is selected, choose the specific HTF (e.g., 240 for 4 hours, D for daily).
Show HTF Follow Line?: Enable to plot the HTF Follow Line on the chart.
Understanding the Signals:
Buy Signal: The price breaks above the upper Bollinger Band, and the HTF (if enabled) confirms the uptrend.
Sell Signal: The price breaks below the lower Bollinger Band, and the HTF (if enabled) confirms the downtrend.
Exit Long: The trade timeframe trend changes to downtrend or the higher timeframe trend changes to downtrend.
Exit Short: The trade timeframe trend changes to uptrend or the higher timeframe trend changes to uptrend.
Alerts:
The script includes alert conditions for buy and sell signals. To set up alerts, click the "Alerts" button in TradingView and select the desired alert condition from the script. The alert message provides the ticker and interval.
Backtesting and Optimization:
Use TradingView's Strategy Tester to backtest the strategy on different assets and timeframes.
Experiment with different settings to optimize the strategy for your specific trading style and risk tolerance. Pay close attention to the ATR Period, Bollinger Bands settings, and the HTF confirmation options.
Tips and Considerations:
HTF Confirmation: The HTF confirmation can significantly improve the strategy's performance by filtering out false signals. However, it can also reduce the number of trades.
Risk Management: Always use proper risk management techniques, such as stop-loss orders and position sizing, when trading any strategy.
Market Conditions: The strategy may perform differently in different market conditions. It's important to backtest and optimize the strategy for the specific markets you are trading.
Customization: Feel free to modify the script to suit your specific needs. For example, you could add additional filters or entry/exit conditions.
Pyramiding: The pyramiding = 0 setting prevents multiple entries in the same direction, ensuring the strategy doesn't compound losses. You can adjust this value if you prefer to pyramid into winning positions, but be cautious.
Lookahead: The lookahead = barmerge.lookahead_off setting ensures that the HTF data is calculated based on the current bar's closed data, preventing potential future peeking bias.
Trend Determination: The logic for determining the HTF trend and reacting to changes is critical. Carefully review the f_calculateHTFData function and the conditions for exiting positions to ensure you understand how the strategy responds to different market scenarios.
Disclaimer:
This script is for informational and educational purposes only. It is not financial advice, and you should not trade based solely on the signals generated by this script. Always do your own research and consult with a qualified financial advisor before making any trading decisions. The author is not responsible for any losses incurred as a result of using this script.

Scalping 15min: EMA + MACD + RSI + ATR-based SL/TP📈 Strategy: 15-Minute Scalping — EMA + MACD + RSI + ATR-based SL/TP
This scalping strategy is designed for 15-minute charts and combines trend-following and momentum confirmation with dynamic stop loss and take profit levels based on volatility.
🔧 Indicators Used:
EMA 50 — identifies the main trend
MACD Histogram — confirms momentum direction
RSI (14) — filters overbought/oversold conditions
ATR (14) — dynamically sets SL and TP based on market volatility
📊 Entry Conditions:
Long Entry:
Price is above EMA 50
MACD histogram is positive
RSI is above 50 but below 70
Short Entry:
Price is below EMA 50
MACD histogram is negative
RSI is below 50 but above 30
🛑 Risk Management:
Stop Loss: 1×ATR (user-configurable)
Take Profit: 2×ATR (user-configurable)
These values can be adjusted in the script inputs depending on your risk/reward preference or market conditions.
⚠️ Notes:
Strategy is optimized for scalping fast-moving pairs (e.g. crypto, forex).
Works best in trending markets.
Use backtesting and forward testing before live trading.

Z-Score Normalized VIX StrategyThis strategy leverages the concept of the Z-score applied to multiple VIX-based volatility indices, specifically designed to capture market reversals based on the normalization of volatility. The strategy takes advantage of VIX-related indicators to measure extreme levels of market fear or greed and adjusts its position accordingly.
1. Overview of the Z-Score Methodology
The Z-score is a statistical measure that describes the position of a value relative to the mean of a distribution in terms of standard deviations. In this strategy, the Z-score is calculated for various volatility indices to assess how far their values are from their historical averages, thus normalizing volatility levels. The Z-score is calculated as follows:
Z = \frac{X - \mu}{\sigma}
Where:
• X is the current value of the volatility index.
• \mu is the mean of the index over a specified period.
• \sigma is the standard deviation of the index over the same period.
This measure tells us how many standard deviations the current value of the index is away from its average, indicating whether the market is experiencing unusually high or low volatility (fear or calm).
2. VIX Indices Used in the Strategy
The strategy utilizes four commonly referenced volatility indices:
• VIX (CBOE Volatility Index): Measures the market’s expectations of 30-day volatility based on S&P 500 options.
• VIX3M (3-Month VIX): Reflects expectations of volatility over the next three months.
• VIX9D (9-Day VIX): Reflects shorter-term volatility expectations.
• VVIX (VIX of VIX): Measures the volatility of the VIX itself, indicating the level of uncertainty in the volatility index.
These indices provide a comprehensive view of the current volatility landscape across different time horizons.
3. Strategy Logic
The strategy follows a long entry condition and an exit condition based on the combined Z-score of the selected volatility indices:
• Long Entry Condition: The strategy enters a long position when the combined Z-score of the selected VIX indices falls below a user-defined threshold, indicating an abnormally low level of volatility (suggesting a potential market bottom and a bullish reversal). The threshold is set as a negative value (e.g., -1), where a more negative Z-score implies greater deviation below the mean.
• Exit Condition: The strategy exits the long position when the combined Z-score exceeds the threshold (i.e., when the market volatility increases above the threshold, indicating a shift in market sentiment and reduced likelihood of continued upward momentum).
4. User Inputs
• Z-Score Lookback Period: The user can adjust the lookback period for calculating the Z-score (e.g., 6 periods).
• Z-Score Threshold: A customizable threshold value to define when the market has reached an extreme volatility level, triggering entries and exits.
The strategy also allows users to select which VIX indices to use, with checkboxes to enable or disable each index in the calculation of the combined Z-score.
5. Trade Execution Parameters
• Initial Capital: The strategy assumes an initial capital of $20,000.
• Pyramiding: The strategy does not allow pyramiding (multiple positions in the same direction).
• Commission and Slippage: The commission is set at $0.05 per contract, and slippage is set at 1 tick.
6. Statistical Basis of the Z-Score Approach
The Z-score methodology is a standard technique in statistics and finance, commonly used in risk management and for identifying outliers or unusual events. According to Dumas, Fleming, and Whaley (1998), volatility indices like the VIX serve as a useful proxy for market sentiment, particularly during periods of high uncertainty. By calculating the Z-score, we normalize volatility and quantify the degree to which the current volatility deviates from historical norms, allowing for systematic entry and exit based on these deviations.
7. Implications of the Strategy
This strategy aims to exploit market conditions where volatility has deviated significantly from its historical mean. When the Z-score falls below the threshold, it suggests that the market has become excessively calm, potentially indicating an overreaction to past market events. Entering long positions under such conditions could capture market reversals as fear subsides and volatility normalizes. Conversely, when the Z-score rises above the threshold, it signals increased volatility, which could be indicative of a bearish shift in the market, prompting an exit from the position.
By applying this Z-score normalized approach, the strategy seeks to achieve more consistent entry and exit points by reducing reliance on subjective interpretation of market conditions.
8. Scientific Sources
• Dumas, B., Fleming, J., & Whaley, R. (1998). “Implied Volatility Functions: Empirical Tests”. The Journal of Finance, 53(6), 2059-2106. This paper discusses the use of volatility indices and their empirical behavior, providing context for volatility-based strategies.
• Black, F., & Scholes, M. (1973). “The Pricing of Options and Corporate Liabilities”. Journal of Political Economy, 81(3), 637-654. The original Black-Scholes model, which forms the basis for many volatility-related strategies.

Reversal Trading Bot Strategy[BullByte]Overview :
The indicator Reversal Trading Bot Strategy is crafted to capture potential market reversal points by combining momentum, volatility, and trend alignment filters. It uses a blend of technical indicators to identify both bullish and bearish reversal setups, ensuring that multiple market conditions are met before entering a trade.
Core Components :
Technical Indicators Used :
RSI (Relative Strength Index) :
Purpose : Detects divergence conditions by comparing recent lows/highs in price with the RSI.
Parameter : Length of 8.
Bollinger Bands (BB) :
Purpose : Measures volatility and identifies price levels that are statistically extreme.
Parameter : Length of 20 and a 2-standard deviation multiplier.
ADX (Average Directional Index) & DMI (Directional Movement Index) :
Purpose : Quantifies the strength of the trend. The ADX threshold is set at 20, and additional filters check for the alignment of the directional indicators (DI+ and DI–).
ATR (Average True Range) :
Purpose : Provides a volatility measure used to set stop levels and determine risk through trailing stops.
Volume SMA (Simple Moving Average of Volume ):
Purpose : Helps confirm strength by comparing the current volume against a 20-period average, with an optional filter to ensure volume is at least twice the SMA.
User-Defined Toggle Filters :
Volume Filter : Confirms that the volume is above average (or twice the SMA) before taking trades.
ADX Trend Alignment Filter : Checks that the ADX’s directional indicators support the trade direction.
BB Close Confirmation : Optionally refines the entry by requiring price to be beyond the upper or lower Bollinger Band rather than just above or below.
RSI Divergence Exit : Allows the script to close positions if RSI divergence is detected.
BB Mean Reversion Exit : Closes positions if the price reverts to the Bollinger Bands’ middle line.
Risk/Reward Filter : Ensures that the potential reward is at least twice the risk by comparing the distance to the Bollinger Band with the ATR.
Candle Movement Filter : Optional filter to require a minimum percentage move in the candle to confirm momentum.
ADX Trend Exit : Closes positions if the ADX falls below the threshold and the directional indicators reverse.
Entry Conditions :
Bullish Entry :
RSI Divergence : Checks if the current close is lower than a previous low while the RSI is above the previous low, suggesting bullish divergence.
Bollinger Confirmation : Requires that the price is above the lower (or upper if confirmation is toggled) Bollinger Band.
Volume & Trend Filters : Combines volume condition, ADX strength, and an optional candle momentum condition.
Risk/Reward Check : Validates that the trade meets a favorable risk-to-reward ratio.
Bearish Entry :
Uses a mirror logic of the bullish entry by checking for bearish divergence, ensuring the price is below the appropriate Bollinger level, and confirming volume, trend strength, candle pattern, and risk/reward criteria.
Trade Execution and Exit Strateg y:
Trade Execution :
Upon meeting the entry conditions, the strategy initiates a long or short position.
Stop Loss & Trailing Stops :
A stop-loss is dynamically set using the ATR value, and trailing stops are implemented as a percentage of the close price.
Exit Conditions :
Additional exit filters can trigger early closures based on RSI divergence, mean reversion (via the middle Bollinger Band), or a weakening trend as signaled by ADX falling below its threshold.
This multi-layered exit strategy is designed to lock in gains or minimize losses if the market begins to reverse unexpectedly.
How the Strategy Works in Different Market Conditions :
Trending Markets :
The ADX filter ensures that trades are only taken when the trend is strong. When the market is trending, the directional movement indicators help confirm the momentum, making the reversal signal more reliable.
Ranging Markets :
In choppy markets, the Bollinger Bands expand and contract, while the RSI divergence can highlight potential turning points. The optional filters can be adjusted to avoid false signals in low-volume or low-volatility conditions.
Volatility Management :
With ATR-based stop-losses and a risk/reward filter, the strategy adapts to current market volatility, ensuring that risk is managed consistently.
Recommendation on using this Strategy with a Trading Bot :
This strategy is well-suited for high-frequency trading (HFT) due to its ability to quickly identify reversal setups and execute trades dynamically with automated stop-loss and trailing exits. By integrating this script with a TradingView webhook-based bot or an API-driven execution system, traders can automate trade entries and exits in real-time, reducing manual execution delays and capitalizing on fast market movements.
Disclaimer :
This script is provided for educational and informational purposes only. It is not intended as investment advice. Trading involves significant risk, and you should always conduct your own research and analysis before making any trading decisions. The author is not responsible for any losses incurred while using this script.

FUMO GHOST V1.1FUMO GHOST V1.0 is a high-precision trend-following strategy that identifies explosive price continuations using EMA + Supertrend logic, filtered through Heikin Ashi confirmation candles.
This strategy is designed to operate across timeframes — from scalping (1M) to swing trading (1H+) — using adaptive auto-settings for sensitivity.
It’s built to be minimal, efficient, and bold — just like the #FUMO mindset.
🔍 Core Logic:
Supertrend (ATR-based) defines trend direction
EMA is used as a momentum baseline
Heikin Ashi logic filters entries:
Long: price above EMA, trend up, HA candle strong (open == low)
Short: price below EMA, trend down, HA candle weak (open == high)
Exit: triggered automatically on Supertrend reversal
This system is designed to stay in the trend as long as it’s valid — no scalping in/out or rapid re-entries.
⚙ Strategy Settings:
Auto-adjusts EMA & ATR parameters by timeframe (1M to 1D)
Manual override available (use_custom = true)
“Silent Mode” hides all visuals for minimal charting
Uses internal Heikin Ashi logic, regardless of visible candles
🧪 Backtest Notes:
Backtest is powered by TradingView’s built-in strategy() engine
Default risk: 10% equity per trade
For accurate simulation, enable “Use standard OHLC” in strategy settings — this ensures reliable backtest when internal Heikin Ashi logic is used
🔒 Why is the code protected?
This script uses:
A unique combination of Supertrend + EMA + Heikin Ashi filters
Internal timeframe-aware parameter scaling
Logic tuned specifically for explosive trend continuations
While freely available for public use, the source code is closed to protect the inner mechanism and prevent reverse engineering.
FUMO GHOST V1.0 is built for clarity, conviction, and confidence.
Make your next trade bold.
Make Fuck U Money — 24/7.
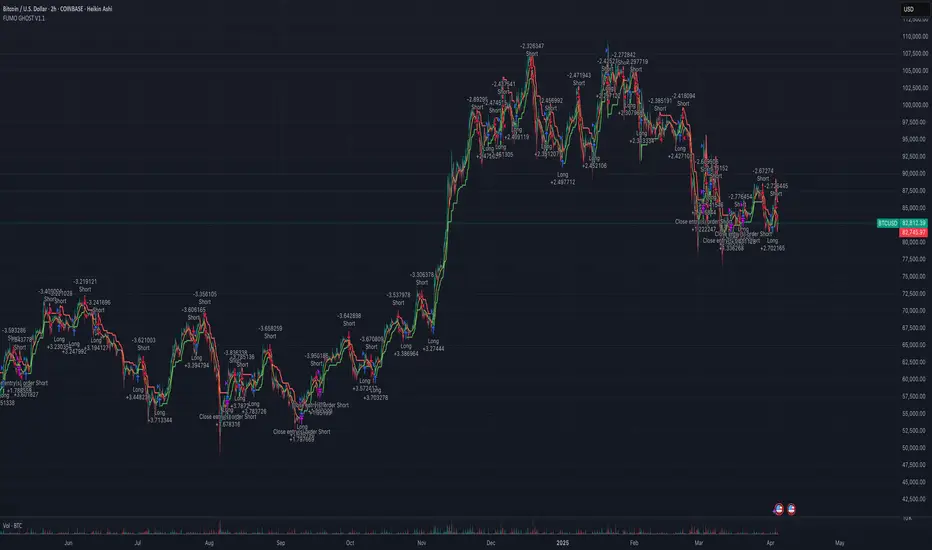
Smart Money Breakout & Order Block StrategySmart Money Breakout & Order Block Strategy
Created by Shubham
This strategy was developed by Shubham, designed to provide traders with a structured approach to smart money trading by combining breakout entries and order block reversals. It focuses on liquidity zones, volatility filters, and ATR-based stop management to adapt to different market conditions.
🔹 Strategy Overview
The Smart Money Breakout & Order Block Strategy is built for traders who want to identify institutional moves while avoiding false breakouts. This non-repainting strategy helps traders detect:
✅ Momentum Breakouts – Price breaking key support & resistance levels.
✅ Order Block Reversals – Institutional buying & selling zones.
✅ Dynamic Stop Management – No fixed SL/TP; uses ATR-based trailing stops.
✅ Volatility Filtering – Avoids choppy market conditions.
🔹 Trading Logic
1️⃣ Breakout Trading (Momentum Entries)
Long Entry: When price breaks above resistance with high volatility.
Short Entry: When price breaks below support with high volatility.
2️⃣ Order Block Reversals (Liquidity Entries)
Bullish Order Block: A strong price rejection after consecutive bearish candles signals smart money accumulation, triggering a long trade.
Bearish Order Block: A strong price rejection after consecutive bullish candles signals smart money distribution, triggering a short trade.
3️⃣ Volatility Filter (False Signal Prevention)
Uses normalized volatility to ensure breakouts are backed by strong momentum.
Helps filter out low-volume, choppy market conditions.
4️⃣ ATR-Based Position Management (Dynamic Stops & Trailing Stop)
No fixed SL/TP → Uses ATR-based stop-loss to adapt to market volatility.
Implements a trailing stop for maximizing potential profits in trending markets.
🔹 Key Features
✔️ Developed by Shubham – Designed for precision trading with institutional techniques.
✔️ Smart Money Concept – Identifies liquidity zones, breakouts, and order blocks.
✔️ Volatility Filter – Prevents false breakouts by analyzing market momentum.
✔️ ATR-Based Dynamic Stops – No fixed SL/TP, making it more adaptive.
✔️ Trailing Stop Functionality – Allows profits to run while reducing risk.
✔️ Fully Automated Execution – Uses TradingView’s strategy functions for automatic trade placement and exits.
✔️ Commission-Adjusted Backtesting – Includes realistic commission settings to ensure accurate results.
📊 Backtesting & Realistic Expectations
✅ Best for Higher Timeframes (1H, 4H, Daily) – Avoids market noise.
✅ Most Effective in Trending & Volatile Markets – Crypto, forex, indices, and commodities.
✅ Performance Varies with Market Conditions – Works best in strong trends.
✅ No Unrealistic Promises – Strategy performance is dependent on market behavior and risk management.
📌 IMPORTANT DISCLAIMER:
This strategy is provided for educational purposes only and should not be considered financial advice. Past performance in backtesting does not guarantee future results. Users should conduct their own research before applying this strategy in live markets.
🚀 Developed by Shubham – Test it yourself and see how it performs! 🚀

Smart Grid Scalping (Pullback) Strategy[BullByte]The Smart Grid Scalping (Pullback) Strategy is a high-frequency trading strategy designed for short-term traders who seek to capitalize on market pullbacks. This strategy utilizes a dynamic ATR-based grid system to define optimal entry points, ensuring precise trade execution. It integrates volatility filtering and an RSI-based confirmation mechanism to enhance signal accuracy and reduce false entries.
This strategy is specifically optimized for scalping by dynamically adjusting trade levels based on current market conditions. The grid-based system helps capture retracement opportunities while maintaining strict trade management through predefined profit targets and trailing stop-loss mechanisms.
Key Features :
1. ATR-Based Grid System :
- Uses a 10-period ATR to dynamically calculate grid levels for entry points.
- Prevents chasing trades by ensuring price has reached key levels before executing entries.
2. No Trade Zone Protection :
- Avoids low-volatility zones where price action is indecisive.
- Ensures only high-momentum trades are executed to improve success rate.
3. RSI-Based Entry Confirmation :
- Long trades are triggered when RSI is below 30 (oversold) and price is in the lower grid zone.
- Short trades are triggered when RSI is above 70 (overbought) and price is in the upper grid zone.
4. Automated Trade Execution :
- Long Entry: Triggered when price drops below the first grid level with sufficient volatility.
- Short Entry: Triggered when price exceeds the highest grid level with sufficient volatility.
5. Take Profit & Trailing Stop :
- Profit target set at a customizable percentage (default 0.2%).
- Adaptive trailing stop mechanism using ATR to lock in profits while minimizing premature exits.
6. Visual Trade Annotations :
- Clearly labeled "LONG" and "SHORT" markers appear at trade entries for better visualization.
- Grid levels are plotted dynamically to aid decision-making.
Strategy Logic :
- The script first calculates the ATR-based grid levels and ensures price action has sufficient volatility before allowing trades.
- An additional RSI filter is used to ensure trades are taken at ideal market conditions.
- Once a trade is executed, the script implements a trailing stop and predefined take profit to maximize gains while reducing risks.
---
Disclaimer :
Risk Warning :
This strategy is provided for educational and informational purposes only. Trading involves significant risk, and past performance is not indicative of future results. Users are advised to conduct their own due diligence and risk management before using this strategy in live trading.
The developer and publisher of this script are not responsible for any financial losses incurred by the use of this strategy. Market conditions, slippage, and execution quality can affect real-world trading outcomes.
Use this script at your own discretion and always trade responsibly.

Profit Trailing BBandsProfit Trailing Trend BBands v4.7.5 with Double Trailing SL
A TradingView Pine Script Strategy
Created by Kevin Bourn and refined with the help of Grok 3 (xAI)
Overview
Welcome to Profit Trailing Trend BBands v4.7.5, a dynamic trading strategy designed to ride trends and lock in profits with a unique double trailing stop-loss mechanism. Built for TradingView’s Pine Script v6, this strategy combines Bollinger Bands for trend detection with a smart trailing system that doubles down on profit protection. Whether you’re trading XRP or any other asset, this tool aims to maximize gains while keeping risk in check—all with a clean, visual interface.
What It Does
Identifies Trends: Uses Bollinger Bands to spot uptrends (price crossing above the upper band) and downtrends (price crossing below the lower band).
Enters Positions: Opens long or short trades based on trend signals, with customizable position sizing and leverage.
Trails Profits: Employs a two-stage trailing stop-loss:
Initial Trailing SL: Acts as a take-profit level, set as a percentage (%) or dollar ($) distance from the entry price.
Tightened Trailing SL: Once the initial profit target is hit, the stop-loss tightens to half the initial distance, locking in gains as the trend continues.
Manages Risk: Includes a margin call feature to exit losing positions before they blow up your account.
Visualizes Everything: Plots Bollinger Bands (blue upper, orange lower) and a red stepped trailing stop-loss line for easy tracking.
Why Built It?
Captures Trends: Bollinger Bands are a proven way to catch momentum, and we tuned them for responsiveness (short length, moderate multiplier).
Secures Profits: Traditional trailing stops often leave money on the table or exit too early. The double trailing SL first takes a chunk of profit, then tightens up to ride the rest of the move.
Stays Flexible: Traders can tweak price sources, stop-loss types (% or $), and position sizing to fit their style.
Looks Good: Clear visuals help you see the strategy in action without cluttering your chart.
Originally refined for XRP, it’s versatile enough for most markets — crypto, forex, stocks, you name it.
How It Works
Core Components
Bollinger Bands:
Calculated using a simple moving average (SMA) and standard deviation.
Default settings: 6-period length, 1.66 multiplier.
Upper Band (blue): SMA + (1.66 × StdDev).
Lower Band (orange): SMA - (1.66 × StdDev).
Trend signals: Price crossing above the upper band triggers a long, below the lower band triggers a short.
Double Trailing Stop-Loss:
Initial SL: Set via "Trailing Stop-Loss Value" (default 6% or $6). Trails the price at this distance and doubles as the first profit target.
Tightened SL: Once price hits the initial SL distance in profit (e.g., +6%), the SL tightens to half (e.g., 3%) and continues trailing, locking in gains.
Visualized as a red stepped line, only visible during active positions.
Position Sizing:
Choose "% of Equity" (default 30%) or "Amount in $" to set trade size.
Leverage (default 10x) amplifies positions, capped by available equity to avoid overexposure.
Margin Call:
Exits positions if drawdown exceeds the "Margin %" (default 10%) to protect your account.
Backtesting Filter:
Starts trading after a user-defined date (default: Jan 1, 2020) for focused historical analysis.
Trade Logic
Long Entry: Price crosses above the upper Bollinger Band → Closes any short position, opens a long.
Short Entry: Price crosses below the lower Bollinger Band → Closes any long position, opens a short.
Exit: Position closes when price hits the trailing stop-loss or triggers a margin call.
How to Use It
Setup
Add to TradingView:
Open TradingView, go to the Pine Editor, paste the script, and click "Add to Chart."
Ensure you’re using Pine Script v6 (the script includes @version=6).
Configure Inputs:
Start Date for Backtesting: Set the date to begin historical testing (default: Jan 1, 2020).
BB Length & Mult: Adjust Bollinger Band sensitivity (default: 6, 1.66).
BB Price Source: Choose the price for BBands (default: Close).
Trend Price Source: Choose the price for trend detection (default: Close).
Trailing Stop-Loss Type: Pick "%" or "$" (default: Trailing SL %).
Trailing Stop-Loss Value: Set the initial SL distance (default: 6).
Margin %: Define the max drawdown before exit (default: 10%).
Order Size Type & Value: Set position size as % of equity (default: 30%) or $ amount.
Leverage: Adjust leverage (default: 10x).
Run It:
Use the Strategy Tester tab to backtest on your chosen asset and timeframe.
Watch the chart for blue/orange Bollinger Bands and the red trailing SL line.
Tips for Traders
Timeframes: Works on any timeframe, but test 1H or 4H for XRP—great balance of signals and noise.
Assets: Optimized for XRP, but tweak slValue and mult for other markets (e.g., tighter SL for low-volatility pairs).
Risk Management: Keep marginPercent low (5-10%) for volatile assets; adjust leverage based on your risk tolerance.
Visuals: The red stepped SL line shows only during trades—zoom in to see its tightening in action.
Visuals on the Chart
Blue Line: Upper Bollinger Band (trend entry for longs).
Orange Line: Lower Bollinger Band (trend entry for shorts).
Red Stepped Line: Trailing Stop-Loss (shifts tighter after the first profit target).
Order Labels: Short tags like "OL" (Open Long), "CS" (Close Short), "LSL" (Long Stop-Loss), etc., mark trades.
Disclaimer
Trading involves risk. This strategy is for educational and experimental use—backtest thoroughly and use at your own risk. Past performance doesn’t guarantee future results. Not financial advice—just a tool from traders, for traders.
