Double SupertrendThis strategy is based on a custom indicator that was created based on the Supertrend indicator. At its core, there are always 2 super trend indicators with different factors to reduce market noise (false signals).
The strategy/indicator has some parameters to improve the signals and filters.
TECHNICAL ANALYSIS
☑ Show Indicators
This option will enable/disable the Supertrend indicators on the chart.
☑ Length
The length will be used on the Supertrend Indicator to calculate its values.
☑ Dev Fast
The fast deviation or factor from one of the super trend indicators. This will be the leading indicator for entry signals, as well as for the exit signals.
☑ Dev Slow
The slow deviation or factor from one of the super trend indicators. This will be the confirmation indicator for entry and exit signals.
☑ Exit Type
It's possible to select from 4 options for the exit signals. Exit signals always take profit target.
☑ ⥹ Reversals
This option will make the strategy/indicator calculate the exit signals based on the difference between the given period's highest and lowest candle value (see Period on this list). It's displayed on the chart with the cross. As it's possible to verify in the image below, there are multiple exit spots for every entry.
☑ ⥹ ATR
Using ATR as a base indicator for exit signals will make the strategy/indicator place limit/stop orders. Candle High + ATR for longs, Candle Low - ATR for shorts. The strategy will show the ATR level for take profit and stick with it until the next signal. This way, the take profit value remains based on the candle of the entry signal.
☑ ⥹ Fast Supertrend
With this option selected, the exit signals will be based on the Fast Supertsignal value, mirrored to make a profit.
☑ ⥹ Slow Supertrend
With this option selected, the exit signals will be based on the Slow Supertsignal value, which is mirrored to take profit.
☑ Period
This will represent the number of candles used on the exit signals when Reversals is selected as Exit Type. It's also used to calculate the gradient used on the Fills and Supertrend signals.
☑ Multiplier
It's used on the take profit when the ATR option is selected on the Exit Type.
STRATEGY
☑ Use The Strategy
This will enable/disable the strategy to show the trades calculations.
☑ Show Use Long/Short Entries
Option to make the strategy show/use Long or Short signals. Available only if Use The Strategy is enabled
☑ Show Use Exit Long/Short
Option to make the strategy show/use Exit Long or Short signals (valid when Reversals option is selected on the Exit Type). Available only if Use The Strategy is enabled
☑ Show Use Add Long/Short
Option to make the strategy show/use Add Long or Short signals. With this option enabled, the strategy will place multiple trades in the same direction, almost the same concept as a pyramiding parameter. It's based on the Fast Supersignal when the candle fails to cross and reverses. Available only if Use The Strategy is enabled
☑ Trades Date Start/End
The date range that the strategy will check the market data and make the trades
HOW TO USE
It's very straightforward. A long signal will appear as a green arrow with a text Long below it. A short signal will appear as a red arrow with a text Short above it. It's ideal to wait for the candle to finish to validate the signal.
The exit signals are optional but give a good idea of the configuration used when backtesting. Each market and timeframe will have its own configuration for the best results. On average, sticking to ATR as an exit signal will have less risk than the other options.
☑ Entry Signals
Follow the arrows with Long/Short texts on them. Wait for the signal candle to close to validate the entry.
☑ Exit Signals
Use them to close your position or to trail stop your orders and maximize profits. Select the exit type suitable for each timeframe and market
☑ Add Entries
It's possible to increase the position following the add margin/contracts based on the Add signals. Not mandatory, but may work as reentries or late entries using the same signal.
☑ What about Stop Loss?
The stop-loss levels were not included as a separated signal because it's already in the chart. There are some possible ideas for the stop loss:
☑⥹ Candle High/Low (2nd recommend option)
When it's a Long signal from the entry signal candle, the stop loss can be the Low value of the same candle. Very tight stop loss in some cases, depending on the candle range
☑⥹ Local Top/Bottom
Selecting the local top/bottom as stop loss will give the strategy more room for false breakouts or reversals, keeping the trade open and minimizing noises. Increases the risk
☑⥹ Fast Supertrend (1st recommend option)
The fast supertrend can be used as stop-loss as well. making it a moving level and working close to trail stop management
☑⥹ Fixed Percentage
It's possible to use a fixed risk percentage for the trades, making the risk easier to control and project. Since the market volatility is not fixed, this may affect the accuracy of the trades
☑⥹ Based on the ATR (3rd recommend option)
When the exit type option ATR is selected, it will display the take profit level for that entry. Just mirror that value and put it as stop-loss, or multiply that amount by 1.5 to have more room for market noise.
EXAMPLE CONFIGURATIONS
Here are some configuration ideas for some markets (all of them are from crypto, especially futures markets)
BTCUSDT 15min - Default configuration
BTCUSDT 1h - Length 10 | Dev Fast 3 | Dev Slow 4 | Exit Type ATR | Period 50 | Multiplier 1
BTCUSDT 4h - Length 10 | Dev Fast 2 | Dev Slow 4 | Exit Type ATR | Period 50 | Multiplier 1
ETHUSDT 15min - Length 20 | Dev Fast 1 | Dev Slow 3 | Exit Type Fast Supertrend | Period 50 | Multiplier 1
IOTAUSDT 15min - Length 10 | Dev Fast 1 | Dev Slow 2 | Exit Type Slow Supertrend | Period 50 | Multiplier 1
OMGUSDT 15min - Length 10 | Dev Fast 1 | Dev Slow 4 | Exit Type Slow Supertrend | Period 50 | Multiplier 1
VETUSDT 15min - Length 10 | Dev Fast 3 | Dev Slow 4 | Exit Type Slow Supertrend | Period 50 | Multiplier 1
HOW TO FIND OTHER CONFIGURATIONS
Here are some steps to find suitable configurations
select a market and time frame
enable the Use This Strategy option on the strategy
open the strategy tester panel and select the performance summary
open the strategy configuration and go to properties
change the balance to the same price of the symbol (example: BTCUSDT 60.000, use 60.000 as balance)
go back to the inputs tab and keep changing the parameters until you see the net profit be positive and bigger than the absolute value of the drawdown
in case you can't find a suitable configuration, try other timeframes
Since the tester reflects what happened in the past candles, it's not guaranteed to give the same results. However, this indicator/Strategy can be used with other indicators as a leading signal or confirmation signal.
Ketidakstabilan

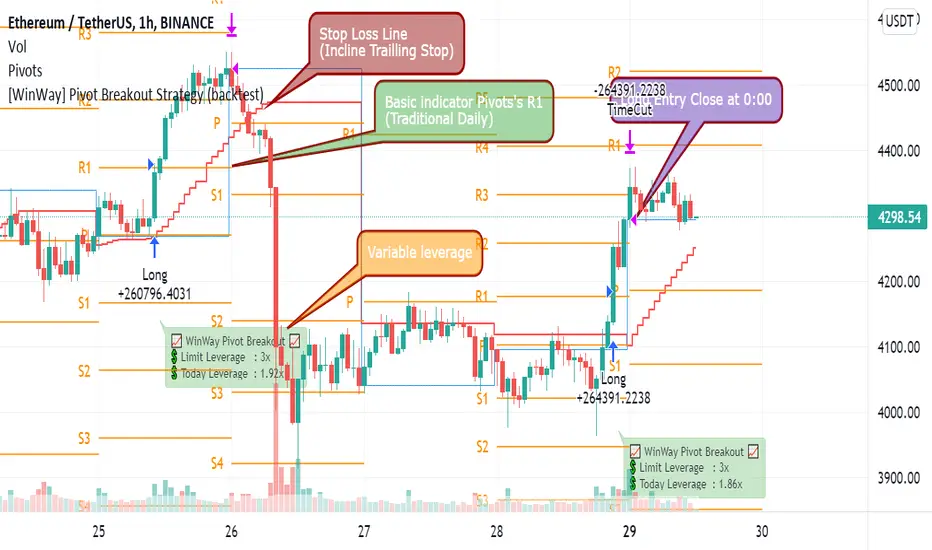
[WinWay] Pivot Breakout Strategy (backtest)This is the Winway's Pivot breaktout,
Using the Pivot point , we made a new volatility breakout strategy.
It's the strategy for ETH / BTC.
Please choose 1H time frame.
No repaint.
"As a long-only day trend strategy, we pursue profits in the downward / transverse / rising market."
- It will be exited based on the closing price of the day as a strategy to take only the day trend.
- It's a long-only strategy without short trade.
- It has high market adaptability in response to market volatility .
"The efficiency has been increased by delicate control of entry volume ."
- Control losses by managing funds in line with market changes.
- Calculate the leverage on the real time automatically.
- It goes in more when it's advantageous and less when it's disadvantageous
- It's a welfare strategy that works against assets
"We further lowered the risk by cutting off in installments."
- If you judge that the trend has declined on the day, you will break off and respond to a sharp drop by using the real time trailing stop.
========================================================================================
윈웨이의 피봇돌파입니다.
피봇 포인트를 이용한 새로운 변동성 돌파 전략입니다.
이더리움과 비트코인을 위한 전략이며
1H 타임프레임으로 선택해주세요
리페인트는 발생하지 않습니다.
롱 온리 당일 추세 전략으로 하락/횡보/상승 장에서 수익을 추구합니다.
- 당일 추세만 취하는 전략으로 일봉 종가 기준 청산됩니다.
- 숏은 없는 롱 온리 전략입니다.
- 시장 변동성에 따라 대응하여 시장 적응력이 높습니다.섬세한 진입 물량 제어로 효율을 높였습니다.
- 시장 변화에 맞춰 자금관리를 하여 손실을 제어합니다.
- 당일 레버리지를 실시간으로 자동 계산합니다.
- 유리할때 더 들어가고, 불리할때 적게 들어갑니다.
- 자산대비로 작동하는 복리 전략입니다.
손절로 리스크를 더욱 낮췄습니다.
- 당일 추세가 꺾였다고 판단하면 손절하여, 실시간 트레일링 스탑을 이용하여 급락에 대응합니다.
01 BB RSI MACD with built-in webhookThis strategy is intended for use as a way of backtesting various parameters available on 3commas.
Using MACD to sell order (original script take profit by scale)
Using RSI to analyze the market conditions.
.
.
// USER INPUTS
Short MA Window - The length of the Short moving average
Long MA Window - The length of the Long moving average
Upper Band Offset - The offset to use for the upper bollinger offset
Lower Band Offset - The offset to use for the lower bollinger offset
Long Stop Loss % - The stop loss percentage to test
Long Take Profit % - The Take profit percentage to test
Initial SO Deviation % - The price deviation percentage required to place to first safety order
Safety Order Vol Step % - The volume scale to test
Input to link with 3comma to automate your bot
3Commas Bot ID -
Bot Email Token - Found in the deal start message for your bot
3Commas Bot Trading Pair - The pair to include for composite bot start deals
when you create alert you need to write {{strategy.order.alert_message}} in the message box.
.
.
Original script:
1. 3Commas Bollinger Strategy by tedwardd
.
.
Suggestion use with trending pair, SAND, MANA and many altcoin in low tf
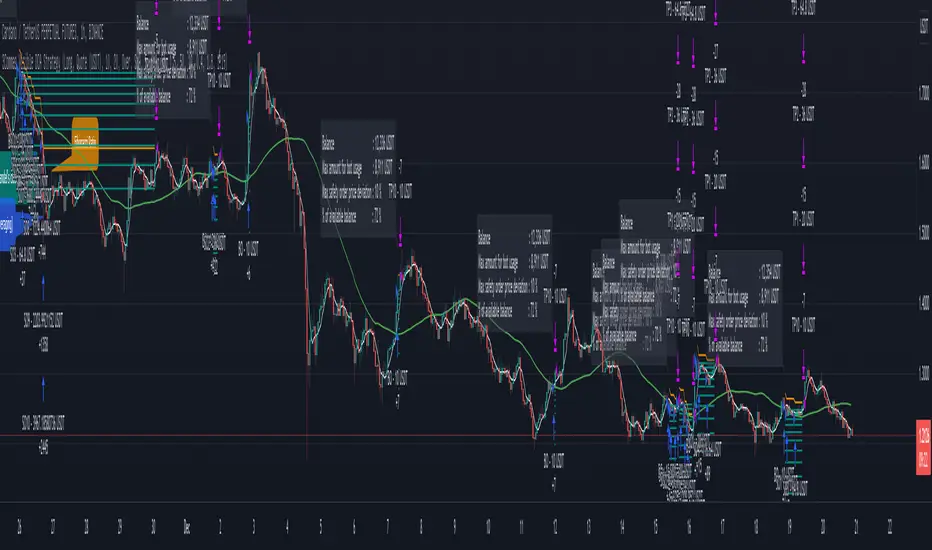
Leonardo Fibonacci DCA StrategyThis strategy consists of the following elements and can all be set by the user.
1. Enter as the price drops.
1) Selection of multi-time frame.
- 30 minutes
- 60 minutes
- 90 minutes
- More than 120 minutes
2) Selection of Order Count
- Order Count == Long entry's qty
3) Selection of First / End indent price gap
It is DCA (Dollar Cost Averaging)
- A DCA strategy is the practice of investing into a currency at preset intervals to reduce the entry price of a position over time and mitigate volatility risk.
For example,
1) Entry Time Frame = 60 minutes
2) Order Count = 10
3) First indent price = 2 %
End indent price = 10 %
=> Starting from a 1% drop in the 60 minutes candle,
10time Long Entry(1%, 2%, 3%, 4%, 5%, 6%, 7%, 8%, 9%, 10%)
thereby getting a better average price for your position and greatly reducing risks from the consequences of volatility .
2. Target Price and Stop Loss
1) Target price : uses the Fibonacci ratio. You can also set the target ratio.
2) Stop Loss : Long entry close when the moving average line cross under the End indent price.
3) Close Deal time : Long entry close after a set period of time has passed since long entry.
You can easily find out what's related by changing the setting value after setting the strategy.
I hope it will help you. Thank you.

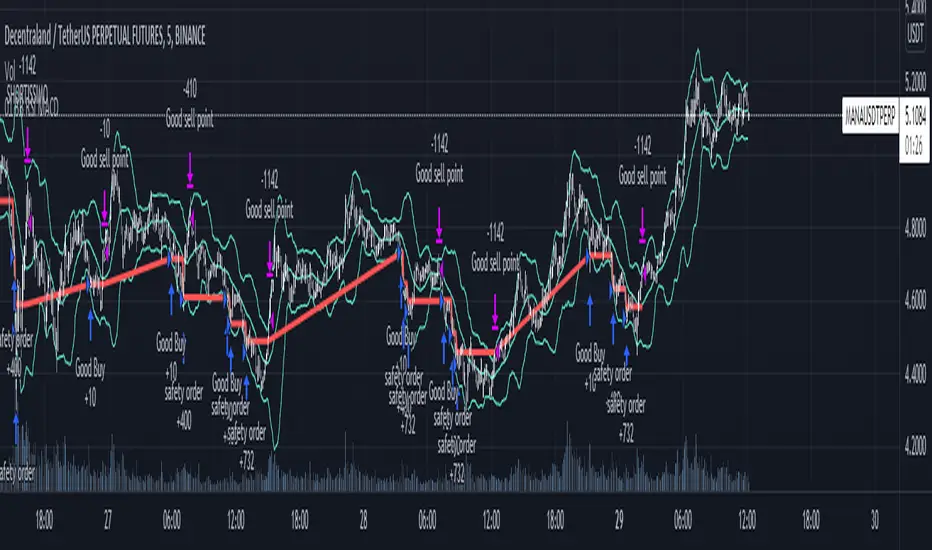
3Commas Visible DCA StrategyThis strategy consists of the following elements and can all be set by the user.
1. Entry by moving average cross.
1) Selection of moving average line.
- SMA(Simple Moving Average)
- EMA(Exponential Moving Average)
- HMA(Hull Moving Average)
2) Selection of Cross over / Cross under
2. Add Entry by DCA(Dollar Cost Averaging)
- A DCA strategy is the practice of investing into a currency at preset intervals to reduce the entry price of a position over time and mitigate volatility risk.
For example,
Base Order = 10 Dollar at Price 100%
Safety Order1 = 20 Dollar at Price 90%
Safety Order2 = 40 Dollar at Price 80%
Average Price => Price 80~90%
thereby getting a better average price for your position and greatly reducing risks from the consequences of volatility.
3. Target Price and Stop Loss.
1) Target Price : Realize profits at % set from the average unit price.
2) Stop Loss : Stop Loss % set from the last safety order.
You can easily find out what's related by changing the setting value after setting the strategy.
This strategy has the following Good characteristics.
1. It informs you of the assets required according to DCA settings.
If you are short of assets, a warning sign will appear.
2. Amount of assets invested in each long entry and long entry close.
3. Visibility of the lowest purchase price line and DCA purchase location according to DCA setting.
easily check the values set in the backtest.
I hope it will help you. Thank you.
NRTH_ Momentum AlgoA NRTH_ Premium Momentum Based Strategy
Comes included with the Premium Package.
Indicator features
Built-In Alerts
Visual Risk Management
Customizable Entry Rules
4 Levels of confirmation
Customizable MA Ribbon
Usage Tips
This strategy is designed for Swing Trading and Intra-Day timeframes (1hr+)
The Algo uses multiple levels of convolution and confirmation before entering a trade, best used in trending markets. utilizing Stochasitc RSI overbought and oversold levels and an 1-3 MAs to identify trends and pullbacks.
Maximize the accuracy of your signals with up to 4 levels of convolution before entering a trade, filtering out the noise as much as possible.
You can set the overbought and oversold levels required for trade entries and set the types of MAs and how many are required to confirm trending momentum
Works for all markets with the ability to customize to your liking.
Backtesting Results Info
Period 23/9/2021-15/11/2021
Entry value at $1000 with 10x leverage
Binance standard taker fee rate (0.04%)
ATR Exits : 1:2.66 RR
-------------------------------------------
Disclaimer
Copyright NRTH_ Indicators 2021.
NRTH_ and all affiliated parties are not registered as financial advisors. The products & services NRTH_ offers are for educational purposes only and should not be construed as financial advice. You must be aware of the risks and be willing to bear any level of risk to invest in financial markets. Past performance is not necessarily indicative of future results. NRTH_ and all individuals associated assume no responsibility for your trading results or investments.
All investments involve risk, and the past performance of a security, industry, sector, market, financial product, trading strategy, or individual’s trading does not guarantee future results or returns. Investors are fully responsible for any investment decisions they make. Such decisions should be based solely on an evaluation of their financial circumstances, investment objectives, risk tolerance, and liquidity needs.

Instrument-Z (3Commas Bot)Instrument-Z is what I am currently using as my 3Commas Bot.
It allows you to customize signals from 3 indicators; Crossing MA's, Stochastic RSI, and WaveTrend.
Better yet, it allows you to setup these signals separately depending on whether the Trend MA is going up or down.
So there are 2 sets of inputs for everything, Uptrend inputs and Downtrend inputs.
I have realized that we can't expect a strategy to work the same way in an uptrend vs downtrend, so the inputs should be separated too.
In my testing, separating increased the net profit by 60% on average.
You can select whether you are trading Long or Short.
You can choose your stop loss and take profit levels as well as trade expiration.
You can choose if you only want to trade with the trend (making the opposing signals irrelevant).
The trend is based on the Trend MA.
This script is specifically for cryptocurrencies.
I've noticed that MA crosses on other asset classes are unreliable because the fluctuations are not strong enough to push the MA's across each other in a meaningful way.
If you want to use this as a 3Commas Bot, then you will have to copy the code of the strategy and paste it into your own personal script.
Then you have to change the alert messages at the bottom of the script.
Make sure to change your alert message from this;
{"message_type": "bot", "bot_id": 0000000, "email_token": "0b000a0a-0aa0-00aa-0aa0-000a00000a0a", "delay_seconds": 0}
To this;
{ \"message_type\": \"bot\", \"bot_id\": 0000000, \"email_token\": \"0a000a0a-0aa0-00aa-0aa0-000a00000a0a\", \"delay_seconds\": 0 }
With after each new line and \ before each quotation.
In the Alert setup, select "alert() function calls only".
This indicator is like a middle ground of complexity between the Juicy Trend indicator and the Instrument-A indicator.
And because it does not feature my neural network project, I have made it open script.
Enjoy!

Bollinger Band Breakout Positional Strategy- BN -15M This strategy consists of following criteria:
Buy:
1. Candle should have RSI is above 60 and Close above Bollinger band upper limit
2. Exit When candle is closed below 20MA
Sell:
1. Candle should have RSI is above 40 and Close below Bollinger band lower limit
2. Exit When candle is closed above 20MA
Checkout results.

Flip a CoinHave you ever wanted a strategy that is completely random? Well here's the Flip-a-Coin strategy that has entirely random and unpredictable trades! With the randomiser to make it a truly unique strategy to you, and the ability to add martingale logic to the risk means you could either be making millions or losing it all in no time! Please do not trade with this! At best it is a good baseline for testing if your own strategy is better or worse than literally flipping a coin. Enjoy!

[Fedra Algotrading Strategy Trailing Stop]Algotrading strategy optimized for cryptocurrencies. Originally conceived to trade automatically through bots (that's how I use it), it also works to get signals and trade manually in any exchange.
It works in spot.
Buy the dip:
Attempts to buy on the dip, finding entries when the price makes abrupt dips that break deviation of the linear regression of the last periods.
Trend Detection:
Determines whether the market is in an uptrend or downtrend by crossing 2 SMAs + super trend in different temporalities. This affects the performance of the strategy. It works as a filter to avoid making entries in a downtrend. It also includes other advanced filters to find the best selling price on losses.
Break Even:
If the market enters a downtrend with an open trade, the Break Even sell is triggered, (configurable, default 1.5%). The intention is to close the trade as soon as possible, but without losses. The value of 1.5% is intended to cover commission costs and a possible spread.
Conditional SL Level: Determines a tolerance level in %, from which it is allowed to sell at a loss, while the price is above this level, the scrip will only sell at a profit.
% Trailing Stop Loss. The Stop Loss is placed a % below the price and accompanies it in the rises to make the most of an uptrend.
It allows you to easily configure the backtest period to optimize the parameters for consistent results.
The strategy calculates by default a commission of 0.1% on each trade to make the backtest more "pessimistic".
Includes advanced features for compatibility with different bots platforms in the market.
Risk management by % of equity or by maximum series of losses.
////////////////SPANISH///////////////////
Estrategia de Algotrading optimizada para criptomonedas. Originalmente concebida para operar de manera automática mediante bots (así la utilizo yo), funciona también para obtener señales y operar manualmente en cualquier exchange.
Funciona en spot.
Buy the dip:
Intenta comprar en el dip, encontrando entradas cuando el precio hace bajadas abruptas que rompen la desviación de la regresión lineal de los últimos periodos
Detección de Trend:
Determina si el mercado tiene una tendencia alcista o bajista mediante el cruce de 2 SMAs + super trend en distintas temporalidades. Esto afecta el funcionamiento de la estrategia. Funciona como filtro para evitar realizar entradas en una tendencia bajista. Incluye también otros filtros avanzados para encontrar el mejor precio de venta en pérdidas.
Break Even:
Si el mercado entra en tendencia bajista con una operación abierta, se activa la venta en Break Even, (configurable, por defecto 1.5%). La intención es cerrar la operación lo antes posible, pero sin pérdidas. El valor de 1.5% está pensado para cubrir los costos de comisiones y un posible spread.
Nivel de SL Condicional: Determina un nivel de tolerancia en %, a partir del cual se permite la venta en pérdidas, mientras el precio esté sobre este nivel, el scripto sólo venderá en ganancias
% Trailing Stop Loss. El Stop Loss se ubica un % debajo del precio y lo acompaña en las subidas para aprovechar al máximo un uptrend.
Permite configurar de manera muy fácil el periodo de backtest para optimizar los parámetros para resultados consistentes.
La estrategia calcula por defecto una comisión de 0.1% en cada operación para que el backtest sea más "pesimista".
Incluye funciones avanzadas para compatibilidad con diferentes plataforma de bots del mercado.
Administración de risego por % del capital o por máxima serie de pérdidas

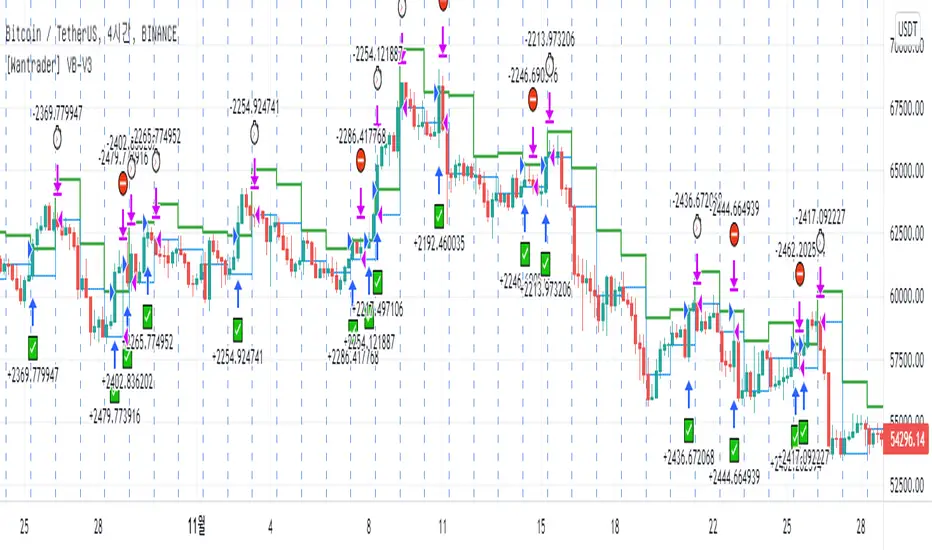
[Wantrader] Volatility Breakout Strategy V3This is the Wantrader's volatility breakthrough version 9,
which developed Larry Williams' volatility breakthrough strategy.
The following elements are included.
- Entry : Enter the market price, calculated by the volatility (TR) * ratio (K) of the previous day.
- Exit : Based on the selected time frame, closing the closing price, closing the market price,
- Stop loss: When it breaks through the entry price and buys, returns to the market price (the previous day's closing price) and changes to bear candle, stop loss.
- Long/short comparison: When short version is selected, it shows the result of short instead of long.
This strategy is a low-level strategy.
When used in practice, it can be stronger and more compliant than expected, but it is not smart.
I recommend you to develop a more hidden edge and use it as a drawing paper to create your own strategy.
Through the option settings,
I'll check if it's right for my first salary or at different times.
It will be an opportunity to think about why there is a difference in profits between Long and Short.
Also, the result shows the big difference between having and not having a loss.
I hope it will be an opportunity to break the relationship in the future.
========================================================================================
래리윌리엄스의 변동성돌파전략을 발전시킨
원트레이더 변동성돌파 버전3 입니다.
아래 요소가 포함되어있습니다.
- 진입 : 전일변동성(TR) * 비율(K) 로 계산한 진입가에, 시장가 진입
- 청산 : 선택한 타임프레임 기준으로 종가에, 시장가 청산
- 손절 : 진입가 돌파하여 매수 후, 당일 시가(전일 종가)로 돌아와서 음봉으로 바뀔때 손절
- 롱/숏 비교 : 숏버전을 선택하면 롱대신 숏으로만 처리한 결과를 보여줌
본 전략은 레벨이 낮은 전략으로
실전에서 사용 시 생각보다 강건하고 준수할 순 있으나 스마트하진 못합니다.
더 숨겨진 엣지를 개발하여 자신만의 전략을 만들기 위한 도화지 처럼 사용하시길 추천드립니다.
옵션 설정을 통해
일봉에서 잘 맞는지 다른 시간대에서 맞는지 등을 확인하고
롱과 숏의 수익의 차이는 왜 나는 것인지 고민해보는 계기가 될 것입니다.
또한 손절이 있는 것과 없는 것의 큰 차이를 결과로 확인하여
앞으로 반드시 손절을 넣게 되는 계기가 되길 기원합니다.
Bollinger Bands Fibonacci Ratios StrategyHello, everyone!
We have just released an innovative strategy for TradingView. It allows you to identify price pivot points and volatility.
This strategy is:
User-friendly
Configurable
Equipped with Bollinger Bands and smoothed ATR to measure volatility
Features
Thanks to the BB Fibo strategy, you can:
Trade stocks and commodities.
Identify price pivot points.
Choose any band for trading Long or Short positions.
Swap upper and lower bands applying Use Reverse Buy/Sell parameters.
Note! The upper bands are for the Long position. The lower bands are for the Short positions.
Parameters
We have equipped our strategy with more than 14 additional parameters. So, you can configure the EA according to your needs!
Inputs:
Length
Source: Open, High, Low, Close, HL2, HLC3, OHLC4
Offset
Fibonacci Ratio 1 — a Fibonacci factor for the 1st upper and lower indicator lines calculating.
Fibonacci Ratio 2 — a Fibonacci factor for the 2nd upper and lower indicator lines calculating.
Fibonacci Ratio 3 — a Fibonacci factor for the 3d upper and lower indicator lines calculating.
Use Reverse Buy — the strategy will use lower Bollinger bands instead of upper ones.
Fibonacci Buy — band selection for opening Long positions conditions.
Use Reverse Sell — the strategy will use upper Bollinger bands instead of lower ones.
Fibonacci Sell — band selection for opening Short positions conditions.
Style:
Basis — baseline color and style settings.
Upper 3 — the 3d upper line color and style.
Upper 2 — the 2nd upper line color and style.
Upper 1 — the 1st upper line color and style.
Lower 1 — the 1st lower line color and style.
Lower 2 — the 2nd lower line color and style.
Lower 3 — the 3d upper line color and style.
Background — the background color within the 3d upper and 3d lower indicator band.
Precision — the number of decimals for BB Fibo values.
Note! Try BB Fibo on your demo account first before going live.

[cache_that_pass] 1m 15m Function - Weighted Standard DeviationTradingview Community,
As I progress through my journey, I have come to the realization that it is time to give back. This script isn't a life changer, but it has the building blocks for a motivated individual to optimize the parameters and have a production script ready to go.
Credit for the indicator is due to @rumpypumpydumpy
I adapted this indicator to a strategy for crypto markets. 15 minute time frame has worked best for me.
It is a standard deviation script that has 3 important user configured parameters. These 3 things are what the end user should tweak for optimum returns. They are....
1) Lookback Length - I have had luck with it set to 20, but any value from 1-1000 it will accept.
2) stopPer - Stop Loss percentage of each trade
3) takePer - Take Profit percentage of each trade
2 and 3 above are where you will see significant changes in returns by altering them and trying different percentages. An experienced pinescript programmer can take this and build on it even more. If you do, I ask that you please share the script with the community in an open-source fashion.
It also already accounts for the commission percentage of 0.075% that Binance.US uses for people who pay fees with BNB.
How it works...
It calculates a weighted standard deviation of the price for the lookback period set (so 20 candles is default). It recalculates each time a new candle is printed. It trades when price lows crossunder the bottom of that deviation channel, and sells when price highs crossover the top of that deviation channel. It works best in mid to long term sideways channels / Wyckoff accumulation periods.

Simple EMA Crossing Strategy TradeMathSimple EMA Crossing strategy, based on crossover Fast exponential moving average = EMA21 and Slow exponential moving average = EMA55.
Default stop loss is 3%, but you can change it.
Default take profit is 9%, it based on stop loss.
Risk to Reward ratio is 1 to 3.
Strategy was tested on BTCUSDT 1H timeframe and works fine with these parameters.

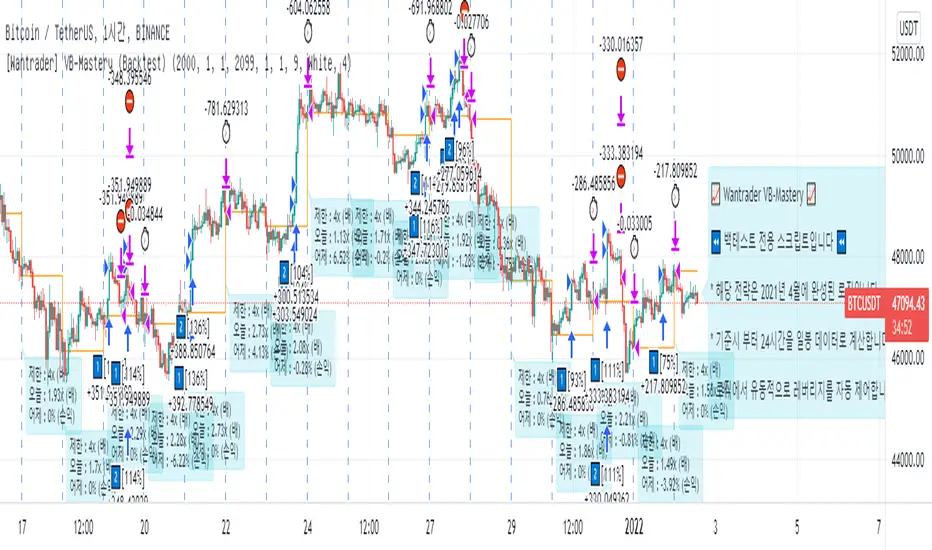
[Wantrader] Volatility Breakout Strategy - Mastery (Backtest)This is the Wantrader's volatility breakthrough version 9,
which developed Larry Williams' volatility breakthrough strategy.
It has been 4 months of development and 8 months of practice.
It's the best strategy for and .
Please choose 1H time frame.
If the date is the future than today, only show you until yesterday.
No repaint.
"As a long-only day trend strategy, we pursue profits in the downward / transverse / rising market."
- It will be exited based on the closing price of the day as a strategy to take only the day trend.
- It's a long-only strategy without short trade.
- It has high market adaptability in response to market volatility.
- We have minimized over-optimization factors so that they can work well in the future.
"The efficiency has been increased by delicate control of entry volume."
- Control losses by managing funds in line with market changes.
- Calculate the leverage on the day automatically.
- It goes in more when it's advantageous and less when it's disadvantageous
- It's a welfare strategy that works against assets
"We further lowered the risk by cutting off and buying in installments."
- If you judge that the trend has declined on the day, you will break off and respond to a sharp drop.
- It was purchased in installments twice, increasing the confidence of entry
========================================================================================
래리윌리엄스의 변동성돌파전략을 발전시킨
원트레이더 변동성돌파 버전9 입니다.
2021년 1월부터 4개월 동안 개발하여
2021년 4월 부터 '8개월 간의 실전테스트 기간을 가졌습니다.'
비트코인, 이더리움 에 가장 잘 맞는 전략이며
1H 타임프레임으로 선택해주세요
백테스트 버전은 전일까지만 확인 가능합니다. (당일 진입 확인 불가)
리페인트는 발생하지 않습니다.
롱 온리 당일 추세 전략으로 하락/횡보/상승 장에서 수익을 추구합니다.
- 당일 추세만 취하는 전략으로 일봉 종가 기준 청산됩니다.
- 숏은 없는 롱 온리 전략입니다.
- 시장 변동성에 따라 대응하여 시장 적응력이 높습니다.
- 과최적화 요소를 최소화 하여 미래에도 잘 작동 할 수 있도록 만들었습니다.
섬세한 진입 물량 제어로 효율을 높였습니다.
- 시장 변화에 맞춰 자금관리를 하여 손실을 제어합니다.
- 당일 레버리지를 매일 자동으로 계산합니다.
- 유리할때 더 들어가고, 불리할때 적게 들어갑니다.
- 자산대비로 작동하는 복리 전략입니다.
손절과 분할매수로 리스크를 더욱 낮췄습니다.
- 당일 추세가 꺾였다고 판단하면 손절하여, 급락에 대응합니다.
- 2회에 걸쳐서 분할매수 하여, 진입 확신도를 높였습니다.
Fractal Breakout Strategy [KL]Fractal Breakout Strategy
This strategy will enter into a Long position when (a) bullish fractal is formed, combined with (b) ATR is relatively low. Trailing stop loss is set based on ATR.
Bullish fractal pattern :
A bullish fractal pattern looks like this:
It is formed when lower-low has reached a local minimum followed by higher-lows.
By default, this script plots the pivot point (the local minimum) using green crosses. This line will extend to the right until the next bullish fractal is formed. The local minimum pivot point is considered as key level of support. For long position entry, entry price must be higher or equal to it.
On the other hand, a bearish fractal pattern looks like the exact opposite. Reversing the logic, it is a local maximum indicated by higher-highs followed by lower-highs. This is shown by red crosses.
Why use ATR to confirm entry :
Two reasons to enter when ATR is low:
1) Since trailing stop loss is based on ATR, entering the market when ATR is low means risking less for potentially high reward.
2) Low ATR often signals price consolidation. There are two favorable scenarios, either: (i) period of accumulation, or (ii) bull flag, ideally followed by breakout.
Determining whether ATR is low :
Relative lows are quantified out by using the method in my other script: Modified ATR Indicator
The method involves applying two-tailed hypothesis testing to assess whether ATR (ie. by default lookback period of 5) has greatly deviated from a larger sample size (ie. lookback period of 50). Assuming ATR is normally distributed and variance is known, then test statistic (z) can be used to determine whether ATR5 is within the critical area under Null Hypothesis: ATR5 == ATR50. If z falls below/above the left/right critical values (ie. 1.645 for a 90% confidence interval), then ATR is determined to the relatively low/high respectively. For the purpose of assessing whether ATR is low, the left-tail is the main focus.
Profit taking :
Profits by default are taken over 3 levels based on risk to reward ratio (ie. 1R, 2R, 3R). When a target is met at each level, strategy will close out one third of current position size. Remainders (ie. already taken once at 1R, but not yet reaching 2R or 3R) will eventually be closed at the trailing stop loss price.

[BTCUSD] Multi Entries Autotrade BinanceCommission = 4 USD per order >>> check in the Performance Summary
Slippage = 2 ticks
- I see from Kodify (tradingview.com/pine-wizards)
Risk: 1% per trade >>> check at the "List of trades"
* Auto trade BINANCE FUTURE by Webhook + Pro, Pro+, Premium Tradingview user.
Binance future quantity setting:
- Fixed Quantity = 0 => Auto quantity (Balance, risk, pips loss)
- Fixed Quantity > 0 (0.001, 0.002, 0.01,...) => send signal with Fixed Quantity
H4 timeframe is main trend: Supertrend indicator.
- Uptrend when closes candle is below the red line
- Downtrend when closes candle is above the green line
H1 timeframe: Keltner Color count & RSI indicator:
- Keltner Color Count input:
- Length = 50
- Multi1 = 1
- Multi2 = 2
- Multi3 = 3
- Source = Close
- Lookback = 25
- RSI input: Length: 14, Source: Close
I. Entry 1: BASIS KELTNER CHANNEL
- BUY when previous OHLC4 candle crossover Basis line AND Supertrend H4 uptrend AND Keltner channels uptrend. Not repaint.
- SELL when previous OHLC4 candle crossunder Basis line AND Supertrend H4 downtrend AND Keltner channels downtrend. Not repaint.
II. Entry 2: UPPER 2/LOWER 1 KELTNER CHANNEL
- BUY when previous OHLC4 candle crossunder Upper 1 AND Supertrend H4 uptrend AND Keltner channels uptrend AND rsi uptrend. Not repaint.
- SELL when previous OHLC4 candle crossover Lower 1 AND Supertrend H4 downtrend AND Keltner channels downtrend AND rsi downtrend. Not repaint.
III. Entry 3: SELL UPPER 2/ BUY LOWER 1 KELTNER CHANNEL
- BUY when previous OHLC4 candle crossover Lower 1 AND Supertrend H4 uptrend AND Keltner channels uptrend AND rsi uptrend. Not repaint.
- SELL when previous OHLC4 candle crossunder Upper 1 AND Supertrend H4 downtrend AND Keltner channels downtrend AND rsi downtrend. Not repaint.
IV. Report all history BTCUSD (H1 timeframe)
- 01/01/2019 - 20/11/2021
- 01/01/2018 - 01/01/2021
- 01/01/2017 - 01/01/2020
- 01/01/2016 - 01/01/2019
- 01/01/2015 - 01/01/2018
- 01/01/2014 - 01/01/2017
- 01/01/2013 - 01/01/2016
- 01/01/2012 - 01/01/2015
ETHUSD Multi Entries Autotrade BinanceCommission = 4 USD per order >>> check in the Performance Summary
Slippage = 2 ticks
- I see from Kodify (tradingview.com/pine-wizards)
Risk: 1% per trade >>> check at the "List of trades"
* Auto trade BINANCE FUTURE by Webhook + Pro, Pro+, Premium Tradingview user.
Binance future quantity setting:
- Fixed Quantity = 0 => Auto quantity (Balance, risk, pips loss)
- Fixed Quantity > 0 (0.001, 0.002, 0.01,...) => send signal with Fixed Quantity
H4 timeframe is main trend: Supertrend indicator.
- Uptrend when closes candle is below the red line
- Downtrend when closes candle is above the green line
H1 timeframe: Keltner Color count (Free): 2 Entries (I. Basis line, II. Upper 1/Lower 1 line)
Keltner Color Count input
- Length = 50
- Multi1 = 1
- Multi2 = 2
- Multi3 = 3
- Source = Close
- Lookback = 25
I. Basis entry rule:
1. Keltner channels:
Long when closes candle crossover the Upper 3 Keltner.
Short when closes candle crossunder the Upper 3 Keltner.
2. Rule of Basis's correction zone before open trades.
- Buy when previous OHLC4 candle crossover the Keltner Basis (Supertrend uptrend & Keltner long). Not repaint.
- Short when previous OHLC4 candle crossunder the Keltner Basis (Supertrend downtrend & Keltner short). Not repaint.
II. 'Upper 1/Lower 1' entry rule:
1. Keltner color count: lookback = 25
2. Keltner channels:
- Long when closes candle crossover the Upper 2 Keltner and Keltner Color count Uptrend.
- Short when closes candle crossunder the Upper 2 Keltner and Keltner Color count Downtrend.
3. RSI down when crossover 70, RSI down when crossunder 30
4. Rule of 'Upper 1/Lower 1' correction zone before open trades.
- Buy when previous OHLC4 candle crossunder the Keltner Upper 1 (Supertrend uptrend & Keltner long & RSI up). Not repaint.
- Short when previous OHLC4 candle crossover the Keltner Lower 1 (Supertrend downtrend & Keltner short & RSI down). Not repaint.
III. Stoploss move: Height of Keltner * 1.3
IV. Report all history ETHUSD (h1 timeframe):
1. Keltner Basis line entries:
- 14/01/2019 - 20/11/2021
- 18/01/2021 - 01/01/2021
- 02/01/2020 - 01/01/2020
- 05/02/2016 - 01/01/2019
- 23/10/2015 - 01/01/2018
- 23/10/2015 - 01/01/2017
2. Keltner 'Upper 2/Lower 1' entries:
- 20/01/2019 - 20/11/2021
- 10/01/2018 - 01/01/2021
- 12/01/2017 - 01/01/2020
- 04/02/2016 - 01/01/2019
- 19/08/2015 - 01/01/2018
- 19/08/2015 - 01/01/2017
3. Combine 2 entries (Basis & 'Upper 1/Lower 1':
01/01/2019 - 20/11/2021
01/01/2018 - 01/01/2021
01/01/2017 - 01/01/2020
01/01/2016 - 01/01/2019
01/01/2015 - 01/01/2018
01/01/2015 - 01/01/2017

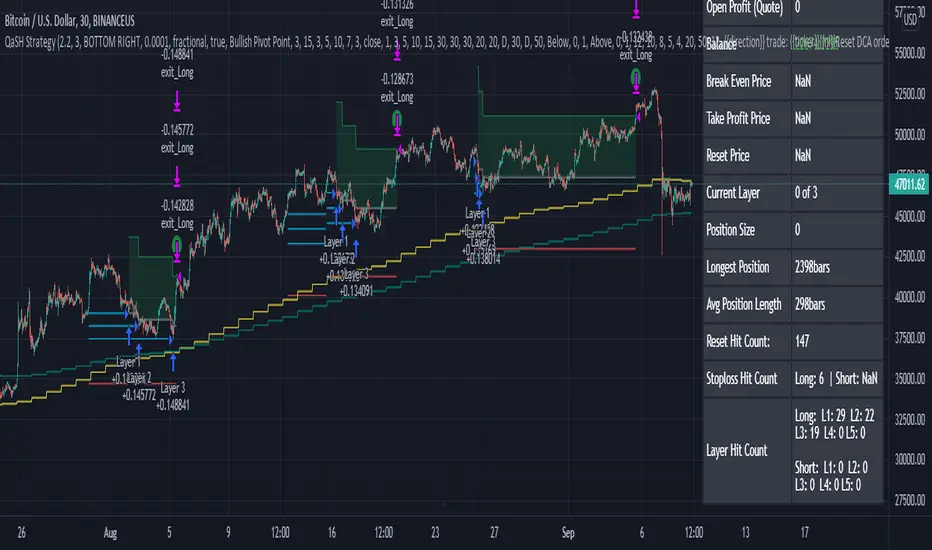
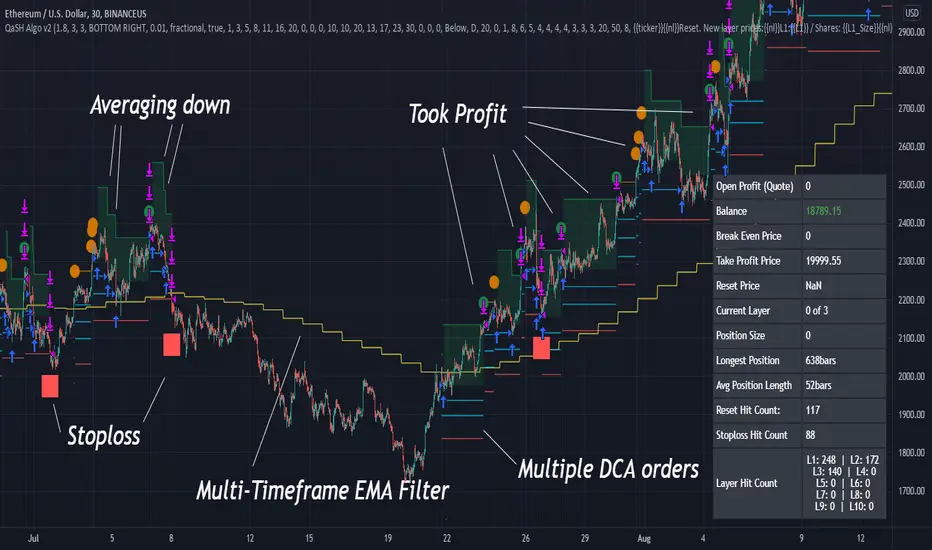
QaSH DCA StrategyThis is a backtesting script that demonstrates the power of incorporating dollar cost averaging into your trading strategies. Catch the bottom of those lightning fast dips buy placing your limit orders ahead of time.
Four entry conditions have been included:
- ASAP mode
- Quickfinger's Luc
- Bullish pivot point
- Bearish pivot point
An EMA-based entry condition filter is included
Placement of all DCA orders is adjustable, and "take profit" % is also variable and can depend on the size of the price dip.
QaSH DCA DaytraderThis script takes advantage of the power of DCA implemented in the QaSH DCA Algorithm script, and it applies it to new entry conditions. A "Quickfingers Luc" mode has been added, which creates new entry orders whenever a level of support has been identified. If price breaks the support level and quickly drops down, the orders will already be in place to catch the dip. This method can even catch the 1-second long, 50% flash dips that occur in some exchanges.
Four entry conditions are included in this initial release : ASAP, Quickfingers Luc, Bullish Pivot point, and Bearish Pivot point
All order placements are customizable
All take profit % values are based on the average entry price
Take profit % values can change based on how big the price dip was
Entry condition filter has been added and it uses a variable timeframe EMA
Stoploss function is available
Order size can be sent in the alerts, which allows for multiple setups to be running simultaneously in one account
All alerts are sent using the new "Any alert() function call" feature, which means this indicator will only take up one alert slot to cover all entry and exit alerts
Settings advice:
- If you think price is inflated, try conservative settings that either use a stoploss and EMA filter, or no stoploss but have some of your orders placed far below the current price with increasing volume. In a bear market this will beat the buy and hold.
- If you think the market is ready for a new bull run, then try experimenting with very aggressive settings to beat the buy and hold. For example: ASAP mode with 3 layers turned on. Orders placed at 0.5%, 3%, and 5%. Volumes at 30%, 30%, and 40% respectively. No stoploss. These settings were tested on ETH and beat the buy and hold during an extreme bull market period.

QaSH DCA Algorithm 2.0This is the strategy version of the QaSH DCA Algorithm indicator. This strategy version of the script includes live trading alert functionality, so it can be considered as a replacement that makes the indicator version obsolete. With this version, features have been added and also you can take advantage of TradingView's native backtesting system for more detailed backtest results.
QaSH DCA Algorithm implements a DCA strategy that takes advantage of price volatility by buying dips to average down, and adjusting price targets as the break-even price gets lower.
How does the DCA strategy work?
When the specified entry condition has occurred, the indicator will set up several limit orders below the current price. If price goes up a specified amount, then the layers will be overwritten at the higher prices. If price goes down and fills the first layer (limit order), then the Take Profit price is plotted and will be sent in an alert. If more layers are filled, then the TP price will move down accordingly as it’s based on the average entry price (alerts on each TP update). This action of lowering the average entry and TP price mitigates your risk, and increases the likelihood of a Take Profit event happening. This script uses a simple "ASAP" mode, where each deal will start exactly 2 bars after the last trade ended. An EMA filter and stoploss function was also added for risk management.
How does this differ from other DCA bots?
1) The layer placements, order volume , and “take profit %” for each layer or “safety order” is much more customizable than what you get from other services. For example, I can choose to have my TP% change, depending on how big the price dip was. Maybe on safety order 1 I want 10% TP, but on safety order 7 might want a 2% TP.
2) The entry condition is adjustable. For example, this script has an ema filter for entries.
3) Settings optimization. You can take advantage of the replay feature and TradingView's backtest system to see how trades would have played out, and how much PnL you would have made
4) You can use this indicator on more than just crypto. You can easily set up alerts for manual trades on stocks, or you can integrate it with your stock broker API of choice and automate your trades.
5) When combining this with an automation service, you will get unmatched execution speed by running it on your dedicated machine.
6) I can offer a lifetime subscription to the indicator upon request.
What kind of market is it best used on?
QaSH DCA Algorithm is best used on assets that are volatile. That means large and frequent swings up and down. Also I recommend running this on many uncorrelated assets at the same time. Better yet, run it with a variety of different settings simultaneously on the same asset.
What settings should I use?
The default settings are decent for most markets, and provide a good balance between profit potential and downside protection, although you can use a wide variety of settings. In a strong bull market its best to either bring up your layers to catch smaller dips, or you can go big on the first few layers (maybe 4 layers, 25% on each layer for example). In a sideways or brearish market you'll want more downside protection, so you'll want the larger orders to be at lower prices, or possibly use the stoploss and EMA filter.
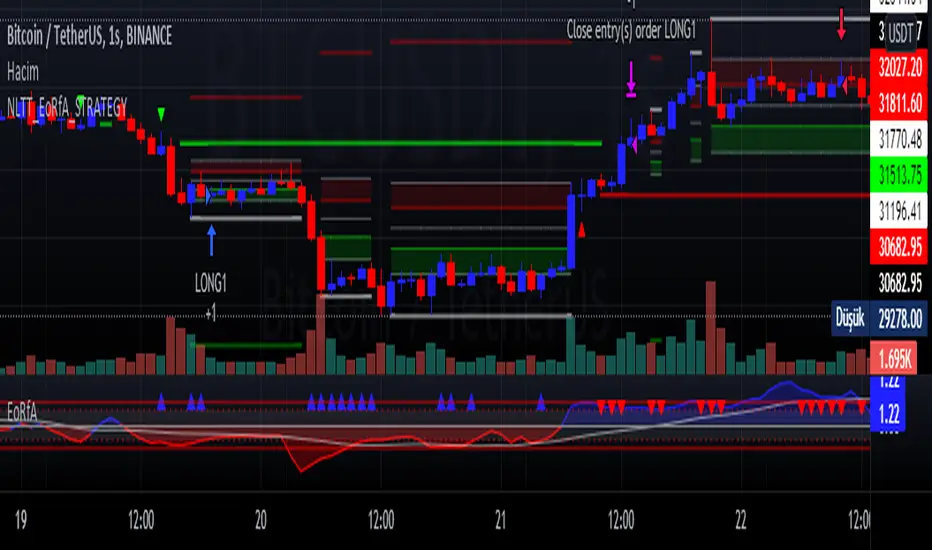
No-lose trading targets (Based on EoRfA) By Mustafa ÖZVERI simulated the NLTTa_EoRfA indicator with the Bitcoin-USD
For details about the indicator, visit my profile on tradingview
For Simulation, with default settings, we order
When on Long setup and price on green area
- open a long position that closes on red area
When on Short setup and price on red area
- open a short position that closes on green area
And we got
- about 15% profit
But only this value can not guarantee good results for trading. BE CAREFUL
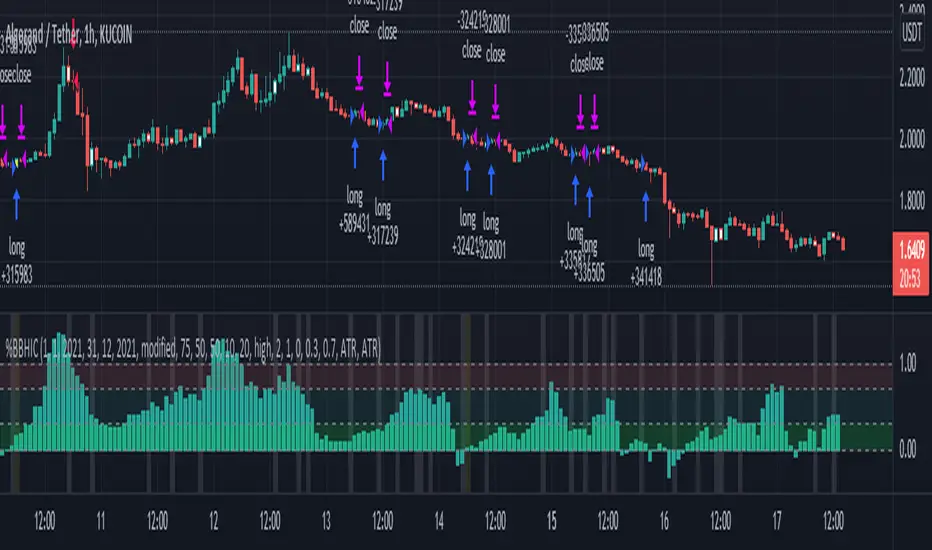
Bollinger Bands %B - Belt Holds & Inner CandlesThis is a simple strategy that uses Bollinger Bands %B represented as a histogram combined with Candle Beltholds and Inside candles for entry signals, and combines this with "buy" and "sell" zones of the %B indicator, to buy and sell based on the zones you set.
How to use:
Long when in the green zone and an inside candle (which is highlighted in white) or a bullish belt hold (which is highlighted in yellow), and sell when inside a red zone and has an inside candle or a bearish belt hold (which is highlighted in purple) or the stop loss or take profit is hit.
Short when in the red zone and an inside candle (which is highlighted in white) or a bearish belt hold (which is highlighted in purple), and sell when inside a green zone and has an inside candle or a bullish belt hold (which is highlighted in yellow) or the stop loss or take profit is hit.
Stop loss / take profit selection:
Choose which performs best for you, ATR based uses the average true range, and % based is based on a set percent of loss or profit.