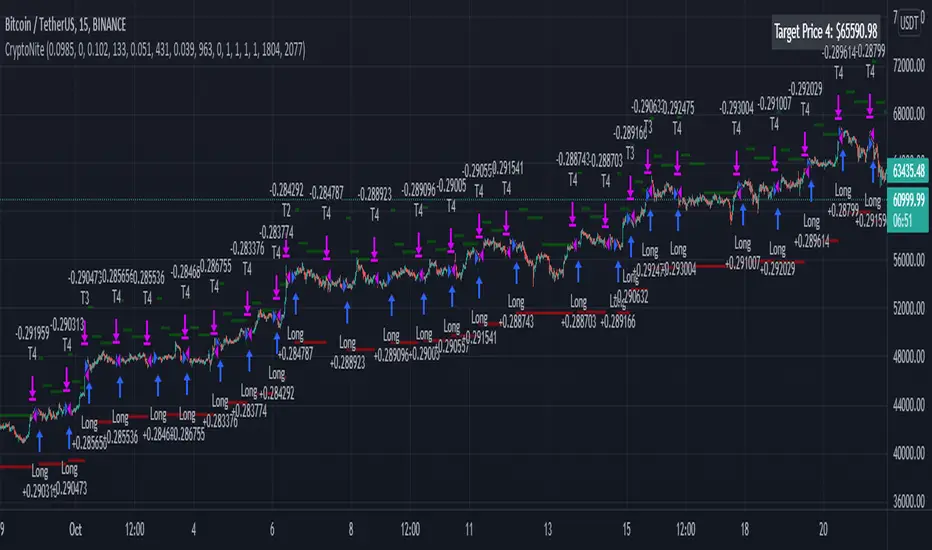
CryptoNite - Machine Learning Strategy (15Min Timeframe)Greeting Traders! I am back with another ML strategy. :D I kept my word with combining my machine learning algorithms from Python and integrating them into Tradingview. Thanks to Tradingview's new release of Pinescript v5 it is now possible. This strategy respects the Sortino Ratio and was created using 2 years of data for 50 different cryptocurrencies. That is a total of 100 years of data and 44,849 trades to create this strategy. Now let me tell you, my computer and I are exhausted. We both been at it non-stop for about two months everyday. I refine the strategy, and the computer runs 24/7 for a few days to spit out the best results into the terminal. It's been a good run so my computer will finally get some sleep tonight.
So let's talk a little about the features of the strategy. In the settings window, you'll see the Stoploss, Take Profit Parameters, and Date Range. You can change the Date Range, but I recommend to leave the SL/TP parameters how they are because the machine learning algo chose those input. If you wish to change them you are always welcome to do so but backtest results will change. For the Take Profit parameters you'll see on the left side you something labeled time duration(displayed in minutes) and on the right side you'll see take profit values. Let's talk a little bit how they work.
TP_values = {
"0": 0.102,
"133": 0.051,
"431": 0.039,
"963": 0
}
In python, the table looks like this but it is quite easy to understand in Tradingview.
From 0-133 minutes, the strategy is looking to the reach target point 1 at 10.2% profit.
From 133-431 minutes, the strategy is looking to the reach target point 2 at 5.1% profit.
From 431-963 minutes, the strategy is looking to the reach target point 3 at 3.9% profit.
From 963+ minutes, the strategy is looking to break even at 0% profit on target point 4.
Through each target point a sell trigger is active. It will look for the best time to sell even if TP has not been reached.
This helps the trade not stay open too long.
The last thing I need to mention is the textbox displayed on the right side of your chart. This textbox displays the current Take Profit value in dollar amount. So when you're in a trade you'll know what TP target has to be reached when the open trade is active. Throughout time, the target price changes depending how long the trade has been open. If you have any questions feel free to comment down below, and enjoy this strategy!
Ketidakstabilan
Scalping Trading System bot Crypto and StocksThis is a trend trading strategy scalping bot that can work with any type of market. However I concluded my tests so far with Crypto, Stocks and Forex, and with optimizations always could be found some profitable settings.
Indicators
SImple Moving Average
Exponential Moving Average
Keltner Channels
MACD Histogram
Stochastics
Rules for entry
long= Close of the candle bigger than both moving averages and close of the candle is between the top and bot levels from Keltner. At the same time the macd histogram is negative and stochastic is below 50.
short= Close of the candle smaller than both moving averages and close of the candle is between the top and bot levels from Keltner. At the same time the macd histogram is positive and stochastic is above 50.
Rules for exit
We exit when we meet an opposite reverse order.
This strategy has no risk management inside, so use it with caution !

Juicy TrendThis script is simple.
It uses EMA and HMA crosses to find entries and exits.
There is an option for sourcing Heikin Ashi based entries/exits.
There is an option for Stop Loss percentage.
It is made for finding Long entries on the 45min chart.
You can optimize the signals by adjusting the moving average lengths.
The default settings are for BTC/USDT 45min.
Suggestion, reduce the Stop Loss percentage for smaller / more volatile assets.

[Fedra Algotrading Strategy]English / Spanish
Algotrading strategy optimized for cryptocurrencies. Originally conceived to trade automatically through bots (that's how I use it), it also works to get signals and trade manually in any exchange.
It works in spot. It does not repaint. Works in 15M, 30M, 1H and 4H (I prefer short periods).
Features:
Buy the dip:
Attempts to buy on the dip, finding entries when the price makes abrupt dips that break the linear regression of the last periods (default 40).
Trailing Take Profit:
Once the percentage established for the take profit is reached, the strategy follows the price if it is rising until it stops rising and only then makes the sale.
Trend Detection:
Determines whether the market is in an uptrend or downtrend by crossing 2 SMAs. This affects the performance of the strategy. This works as a filter to avoid making entries in a downtrend.
Trailing Break Even:
If the market enters a downtrend with an open trade, a Trailing Break Even is triggered, (configurable, default 1.5%). The intention is to close the trade as soon as possible, but without losses. The value of 1.5% is intended to cover commission costs and a possible spread. Like the Take Profit, the Trailing Break Even follows the price as it rises until it stops doing so before closing the trade.
How to use this strategy?
In the properties of the strategy you assign the amount you will trade (default 100), the percentage of the total capital you will use in each trade (default 100%) and the value of the commissions (default 1%).
Select the pair to trade. The strategy is optimized for trading pairs with stable coins. The strategy benefits from volatility so choosing among currencies with a market cap between 50M and 10,000M gives better profits than with top 10 currencies.
In the strategy options, disable the stoploss by setting it to 100% to be able to concentrate on the Take Profit.
With an eye on the "Net Profit" of the strategy, start with the take profit at 3% (for lower percentages there is the Break Even) and increase it 1 by 1 until determining which is the best for our pair (the one that gives us a better net profit).
Once the Take Profit is established, enable the StopLoss starting from 1 and choosing the best parameter looking for the balance that makes us feel comfortable between the Net Profit and the total of closed operations.
Test this same with candles of different periods (I trade with 15M and 30M candles).
Tip:
To trade automatically using a bot, I recommend using pairs in which the strategy has a profitability higher than 80%.
To counteract possible overfitting, when the strategy has given me a 30% profit, I recalculate the optimal parameters.
If you are interested in auromatizing it to trade on Binance, Binance US, AAX, Kucoin, Liquid, Okex, Bitfinex, Bittrex, Coinbase Pro, Gemini, HitBTC, Kraken or Poloniex, I recommend using Quadency bots, they are free and the ones I use.
This will eventually be a paid script, but you can request free access for now.
I am still working on optimizations, improvements, and more features.
DCA version coming soon.
I leave some optimizations of the spares I am trading at the moment (On 15M candles):
PAIR SL TP Bars Profit Profit Rentability
OM 3 4 96 70 2703.41% 88.57%
NU 4 3 96 81 1170.38% 86.42%
ONE 4 4 192 83 756% 91.57%
FTM 8 4 192 80 900.00% 92.50%
LUNA 3 8 192 78 410.98% 83.33%
OMG 6 4 192 72 408.75% 88.89%
FRONT 2 5 96 61 406% 85.25%
SOL 5 10 96 84 381.78% 83.33%
UTK 2 4 192 59 520.00% 88.06%
NMR 2 3 96 76 279% 80.26%
STPT 1 4 96 84 272.34% 79.76%
ROSE 5 4 96 59 478.00% 88.00%
clv 4 5 192 46 216% 78.26%
XTZ 4 6 96 87 216.00% 82.76%
C98 1 6 96 36 184.46% 80.56%
ALGO 7 4 192 61 222.00% 88.52%
ATOM 6 4 96 73 160.40% 86.30%
DOT 3 6 96 75 156.54% 84%
REEF 4 4 96 67 154.90% 85.07%
AUDIO 10 5 192 62 128.48% 83.87%
DYDX 1 10 96 20 120.76% 90%
DOT 4 6 96 77 111.33% 83.12%
KEEP 7 5 96 69 110% 87%
MINA 7 6 96 23 100.29% 86.96%
OPUL 1 5 96 18 95.26% 100%
HBAR 1 3 192 76 91.82% 81.58%
VRA/USDT 7 4 96 81 89.35% 81.48%
XEC 3 14 96 27 89.24% 85.19%
*****************************************************SPANISH*****************************************
Estrategia de Algotrading optimizada para criptomonedas. Originalmente concebida para operar de manera automática mediante bots (así la utilizo yo), funciona también para obtener señales y operar manualmente en cualquier exchange.
Funciona en spot. No repinta. Funciona en 15M, 30M, 1H y 4H (Yo prefiero periodos cortos)
Características:
Buy the dip:
Intenta comprar en el dip, encontrando entradas cuando el precio hace bajadas abruptas que rompen la regresión lineal de los últimos periodos (por defecto 40)
Trailing Take Profit:
Una vez alcanzado el porcentaje establecido para el take profit, la estrategia acompaña al precio si está en ascenso hasta que deja de subir y recién ahí realiza la venta.
Detección de Trend:
Determina si el mercado tiene una tendencia alcista o bajista mediante el cruce de 2 SMAs. Esto afecta el funcionamiento de la estrategia. Esto funciona como filtro para evitar realizar entradas en una tendencia bajista.
Trailing Break Even:
Si el mercado entra en tendencia bajista con una operación abierta, se activa un Trailing Break Even, (configurable, por defecto 1.5%). La intención es cerrar la operación lo antes posible, pero sin pérdidas. El valor de 1.5% está pensado para cubrir los costos de comisiones y un posible spread. Al igual que el Take Profit, El Trailing Break Even acompaña al precio mientras sube hasta que deja de hacerlo antes de cerrar la operación.
Cómo utilizar esta estrategia?
En las propiedades de la estrategia se le asigna el monto con el que va a operar (por defecto 100), el porcentaje del total de capital que utilizará en cada operación (por defecto 100%) y el valor de las comisiones (por defecto 1%)
Seleccionar el par a operar. La estrategia está optimizada para operar en pares con stablecoins. La estrategia se beneficia con la volatilidad por lo que elegir entre las monedas con un market cap de entre 50M y 10.000M da mejores beneficios que con monedas del top 10
En las opciones de la estrategia, deshabilitar el stoploss configurándolo en 100% para poder concentrarnos en el Take Profit.
Con un ojo en el “Beneficio Neto” de la estrategia, comenzar con el take profit en 3% (para porcentajes menores está el Break Even) e ir aumentándolo de 1 en 1 hasta determinar cuál es el mejor para nuestro par (el que nos proporciona un major beneficio neto).
Establecido el Take Profit, habilitar el StopLoss partiendo de 1 y eligiendo el mejor parámetro buscando el equilibrio que nos haga sentir cómodos entre el Beneficio Neto y el total de operaciones cerradas.
Probar esto mismo con velas de diferentes periodos (Yo opero con velas de 15M y 30M)
Consejo:
Para operar de manera automática mediante un bot, recomiendo utilizar pares en los que la estrategia tenga una rentabilidad superior al 80%
Para contrarestar posible overfiting, cuando la estrategia me ha dado un 30% de profit, vuelvo a calcular los parámetros óptimos.
Si te interesa auromatizarla para operar en Binance, Binance US, AAX, Kucoin, Liquid, Okex, Bitfinex, Bittrex, Coinbase Pro, Gemini, HitBTC, Kraken o Poloniex, recomiendo usar los bots de Quadency, son gratiutos y los que yo utilizo.
Este será eventualmente un script pago, pero puedes solicitar acceso gratuito por ahora.
Sigo trabajando en optimizaciones, mejoras, y más funciones.
Próximamente versión DCA.
Dejo algunas optimizaciones de lo spares que yo estoy operando en este momento (En velas de 15M contra BUSD):
PAR SL TP Bars Operaciones Profit Rentabilidad
OM 3 4 96 70 2703.41% 88.57%
NU 4 3 96 81 1170.38% 86.42%
ONE 4 4 192 83 756% 91.57%
FTM 8 4 192 80 900.00% 92.50%
LUNA 3 8 192 78 410.98% 83.33%
OMG 6 4 192 72 408.75% 88.89%
FRONT 2 5 96 61 406% 85.25%
SOL 5 10 96 84 381.78% 83.33%
UTK 2 4 192 59 520.00% 88.06%
NMR 2 3 96 76 279% 80.26%
STPT 1 4 96 84 272.34% 79.76%
ROSE 5 4 96 59 478.00% 88.00%
clv 4 5 192 46 216% 78.26%
XTZ 4 6 96 87 216.00% 82.76%
C98 1 6 96 36 184.46% 80.56%
ALGO 7 4 192 61 222.00% 88.52%
ATOM 6 4 96 73 160.40% 86.30%
DOT 3 6 96 75 156.54% 84%
REEF 4 4 96 67 154.90% 85.07%
AUDIO 10 5 192 62 128.48% 83.87%
DYDX 1 10 96 20 120.76% 90%
DOT 4 6 96 77 111.33% 83.12%
KEEP 7 5 96 69 110% 87%
MINA 7 6 96 23 100.29% 86.96%
OPUL 1 5 96 18 95.26% 100%
HBAR 1 3 192 76 91.82% 81.58%
VRA/USDT 7 4 96 81 89.35% 81.48%
XEC 3 14 96 27 89.24% 85.19%

BBPBΔ(OBV-PVT)BB - Time Series Decomposition & Volume WeightedThis is an indicator that shows 5 different points of information:
#1 The Trendline is uses a time-series decomposition to remove noise and seasonality data to provide a trendline without using moving averages. This is then further processed by a custom VWAP block that weights it based on the time frame you're currently using.
#2 BB%B - This is the blue histogram that's partially transparent. This is used to find when a security is overbought or oversold.
#3 BB%B of the Δ(OBV-PVT). This is the green histogram. We took the OBV and subtracted the PVT from it, then we found the delta of that compared to the previous candle. This output a line, which we wrapped in bollinger bands to find the BB%B of this line. This line is represented as a histogram, for visual clarity.
#4 Long and Short Indicators: Long is represented by a green dot, and short is represented by a red dot.
#5 Zones - there are multiple zones, which are used to identify overbought and oversold zones.
How to use the indicator:
Simple way: Long on green dot, Short on red dot. Use stop losses and take profits.
Slightly More Complex: Same as above, but also close out longs, when the green histogram drops but the blue does not. As this means price action hasn't caught up with volume. Use stop losses and take profits.
Full Usage: Long only when both the green, blue and yellow lines are below 0, and sell when the blue or green histogram rises above 1. Perform the opposite for the shorting. Ignore the dots if you use this method, they are for simple reference points til you get used to this indicator. Use stop losses and take profits.

[Crypto] DinhChienFX [2 orders]1. Supertrend indicator at Daily timeframe:
- Long trend: the close of candle is above the Green line of Supertrend Indicator.
- Short trend: the close of candle is below the Red line of Supertrend Indicator.
2. Keltner Channels:
- Only buy is above Upper Keltner.
- Only sell is below Lower Keltner.
3. ADX indicator:
- BUY when the ADX indicator crosses 46 + Supertrend is GREEN + Candle's close above Upper Keltner.
- SELL when the ADX indicator crosses 46 + Supertrend is RED + Candle's close below Upper Keltner.
4. Order 2: just active when the Order 1 is opening.
- At the fibonacci retracement 63% ~ Risk/reward 1/1.7
5. Not repaint:
6. Stoploss and Take Profit: risk/reward 1/1.05
- Stoploss = The height of Keltner Channels from lower to upper.
- Take profit = The height of Keltner Channels from lower to upper x 1.05
7. Alert for webhook:
* Historical data with 1 Entry.
- 2013 - 2016:
- 2016 - 2019:
- 2019 to 20/10/2021
---------
Every year:
2013-2014:
2014-2015:
2015-2016:
2016-2017:
2017-2018:
2018-2019:
2019-2020:
2020-2021:
2021-20/10/2021:

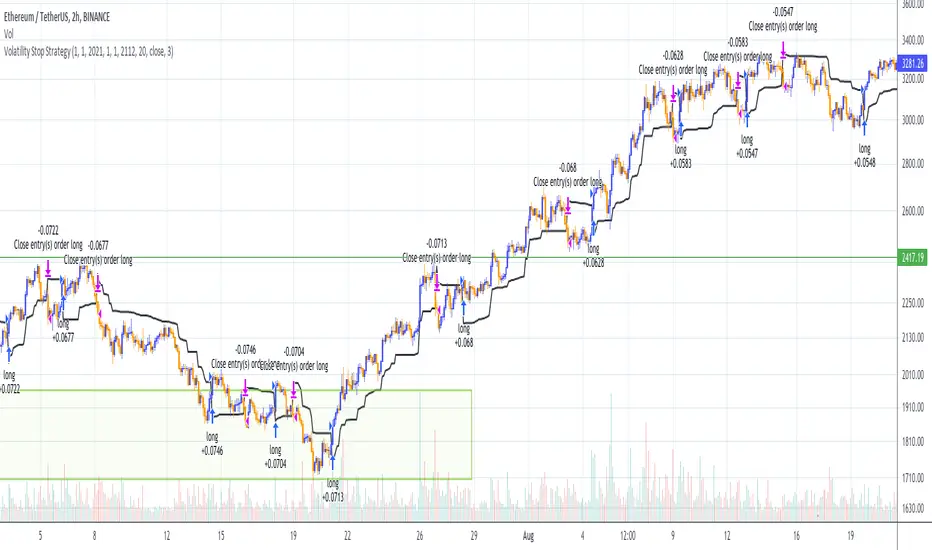
Volatility Stop Strategy (by Coinrule)Traders often use the volatility stop to protect trades dynamically, adjusting the stop price gradually based on the asset's volatility.
Just like the volatility stop is a great way to capture trend reversals on the downside, the opposite applies as well. Therefore, another useful application of the volatility stop is to add it to a trading system to signal potential trend reversals to catch a good buy opportunity.
ENTRY
- When the price crosses above the Volatility Stop
EXIT
- When the price crosses below the Volatility Stop
For this strategy, the Volatility stop's multiplier is set to 3 to allow more flexibility to the trade. The strategy is designed for medium-term trades.
Based on the backtest result from a sample of crypto trading pairs, the most profitable time frame is the 2-hr.
The strategy works well with both crypto-to-crypto and crypto-to-fiat pairs. To make results more realistic, a trading fee of 0.1% is added to the script. The fee is aligned to the base fee applied on Binance.
Bollinger band & Volume based strategy V2this script is upgraded version of previous one the major change is deleted script which find a highest price after entry the last of strategy is same.
If current volume is above daily average volume, and three bollinger band`s Standard Deviation, 1 and 1.5 and 2 if the current lowest price is bigger then 1 stdev and current closed is bigger then 1.5 stdev and the last,highest price is above 2.0 stdev, it defined current market is bullish and had momentum.
and the Short will entered when ma60 and ma120 is undercrossed it work as prevent current price is way lower then entry price.
**this script is working in 15min Only in BTC market or USDT**
** basic equity setting is 500$, set your own**
**if you will use this in real-trade,plz comment the result to me**
Ps: i wanna know why my script is only working well in 15 min tick, anyone who has similar phenomenon or if you had a answer about it, please comment me.

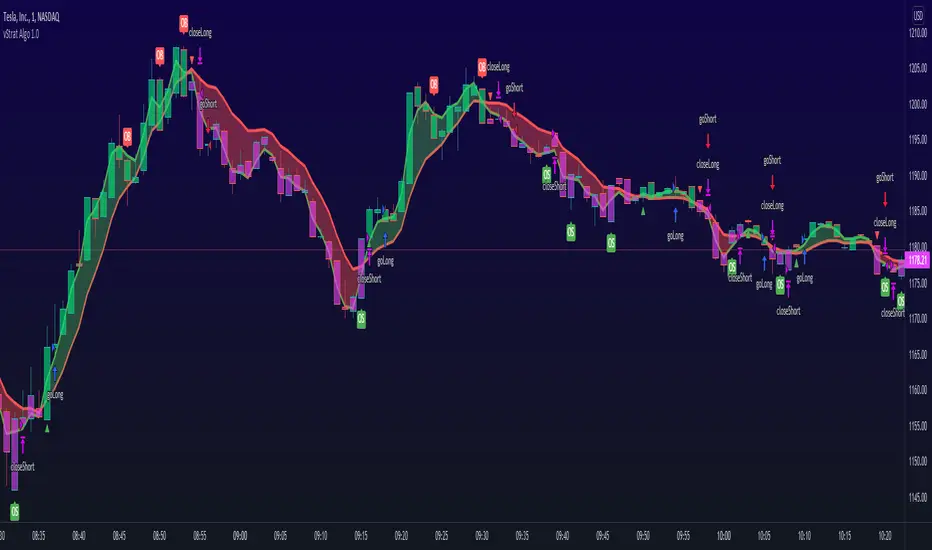
vStrat Algo 1.0 (BETA)vStrat Algo 1.0
The Very First Scalping/Intraday Trading Algo for Options
Note: If you have any favorite indicators that you use regularly and are helpful, feel free to use them in conjunction to this strategy.
Legend:
long = buy call
short = buy put
close entry = sell call/put
BULL = bullish engulfing
BEAR = bearish engulfing
OS = oversold
OB = overbought
Instructions:
1. You can choose to watch the 3 minute or 5 minute chart but be aware of the Pro’s and Con’s. It’s not recommended to use this strategy on the 1 minute chart, but this works on higher timeframes. Keep in mind that the signals will vary on each timeframe.
3 minute 5 minute
i.ibb.co i.ibb.co
2. It’s best to use this strategy right at market open. If a “long” (buy CALLS) or “short” (buy PUTS) signal was given at pre-market, I do not recommend taking it. Only take signals once the market opens. If you really wish to take the signal that was given 1-5 minutes before the market opened, you most definitely can, but its’s just riskier. What I would do is, wait 3-10 minutes after market open and if one Moving Average is respecting the other and holding above or below it, you can enter especially if the blow is bullish, the vStrat Algo 1.0 will also tell you if the candles are bearish or bullish. Use your best judgement.
i.ibb.co [
3. You do not have to wait for the exit signal, everyone's risk management is different so take profits whenever you're green or hold as long as the short-term MA is still trending above or below the long-term MA and is not touching or bouncing off it.
i.ibb.co
4. Avoid taking any signals from 11:30 AM ET - 2:30 PM ET, when stocks are trading sideways since the algo’s stop losses get triggered here due to the low volume.
i.ibb.co
5. Lastly, there is no magic indicator or strategy, this algorithm is designed based on multiple conditions. Each signal gets triggered when ALL the conditions are met. This strategy is based off advanced moving averages, one that reduces lag and responds quicker than the simple and exponential ones, RSI value, S/R, pivot points, and a few others. I’m always looking for ways to improve this scalping algorithm so rest assured any complaints or suggestions will be taken and fixed as timely as possible. For best results, avoid trading with your emotions. If you’re a new user, open a small position, set a stop loss, and let the algorithm decide how you will trade it for that day. Keep doing this until you get more familiar with the script then slowly increase your position sizing, but do not invest money you can’t afford to lose. Play with the settings, change the lengths if you wish, but the script was created to provide the most accurate signals as it is. If you do decide to change these inputs, the signals will also be different. Take profits whenever you see fit, the goal is to have a green day and grow your account slowly but surely. If you make a profit, do not risk giving your money back to the market by overtrading. Always do your own due diligence and use your best judgement. Good luck, Traders!
DISCLAIMER : All information found here, including any ideas, opinions, views, predictions, forecasts, commentaries, suggestions, or stock picks, expressed, or implied herein, are for informational, entertainment or educational purposes only and should not be construed as personal investment advice. While the information provided is believed to be accurate, it may include errors or inaccuracies. Conduct your own due diligence or consult a licensed financial advisor or broker before making any and all investment decisions. Any investments, trades, speculations, or decisions made on the basis of any information found on this site, expressed, or implied herein, are committed at your own risk, financial or otherwise.
[astropark] Trend Skywalker V2 [strategy]Dear Followers,
today I'm glad to present you Trend Skywalker V2 , the evolution of Trend Skywalker V1 indicator that you can see here below:
This indicator works on every timeframe and market, it's quite responsive to market movements, so it's especially good on volatile markets.
In this new version you have 3 trend clouds available :
a short-term one (yellow)
a mid-term one (green)
a long-term one (blue)
You can also enable an option to show all trend clouds as one, the result will be similar to a special bollinger bands tool.
Of course you can edit trend clouds analysis period and color, also you can turn on or off the cloud that you prefer.
The indicator can run 4 different kinds of strategy : one for each trend cloud individually or a mixed one.
Also the indicator tracks for you a peak profit from entry: this tracker is a suggestion for you to take profits while price goes up!
All red-green circles you see in the chart is a reminder that a peak profit label was there in the past: what does this tell you?
if price starts losing the short-term trend and you had a lot of TP suggestions, maybe trend ended and you should start consider closing your trade before you give back all your profit.
On backtesting you can you test long and short setups individually or both, as well as performance in a specific time window.
This is a premium indicator , so send me a private message in order to get access to this script.

Kaufman's Efficiency Ratio Strategy [KL]I recently published an indicator called "Kaufman's Efficiency Ratio Indicator". In the description of that script, I hypothesized about how the Efficiency Ratio could be applied to identify bullish moves in instances where price had already gone up steeply, but rests for a while, allowing for entry in expectation that price will continually rise. I decided to test out this idea with Pinescript.
About Kaufman's Efficiency Ratio ("ER")
ER was developed by a systematic trader by the name of Perry J. Kaufman.
Formula
The formula is:
= A divided by B,
where:
A = Current closing price minus the closing price at the start of the lookback period
B = Sum of differences between closing prices (in absolute terms) of consecutive bars over the lookback period
How this strategy enters a trade (Long):
- code: entry_signal_long = ER > 0 and ER_is_mid
- meaning: when ER is positive, strategy assumes price has risen. Usually ER value begins high (red), and unless it is a false move, then it should stay positive. This strategy will patiently wait until ER drops to medium (yellow), and then place a trade.
- how low/medium/high is dynamically determined: Refer to the description of my other script("Kaufman's Efficiency Ratio Indicator") for details. Trying to keep this as short as possible.
How this strategy exits a trade (Long):
- when price hits stop limit; stop limit is based on low of bars, trails upward based on ATR
- included a feature called "tightening TSL", which tries to reduce the stop-buffer during periods of high volatility implied by ER (very experimental, opening the floor for suggestions on how this can be improved)

VCP pivot buyIt will buy the breakout of the pivot in a bullish trend which is defined by the Mark Minervini stage 2 template
Set the stop loss% and Target% in your favor ( recommend the stoploss% as the low percentile atrp )
It helps indicate the contraction point so that we can have a low-risk entry of a buy point.
It followed the strategy of Mark Minervini.
changing the lookback period input to change the percentile
changing the Pivot Length to decide how many bars you would consider as a pivot
changing the Close range to decide in how much percentage does the close range you would consider as a pivot
The percentile rank is represented in the colour of the background, you can alter how low you want to set to indicate lowering volatility.
The blue line shows the percentage range in ( pivot length) days/bars
The coloured background shows the signal of pivot point forming

Linear SSL ShortThis script consist of two parts: linear SSL and DEMA. The difference between original SSL and current is that it calculated by linear regression. The logic is simple: when SSL "crossunder" and DEMA is above the price - we get short signal. When price became above DEMA and SSL "crossover" - close short.

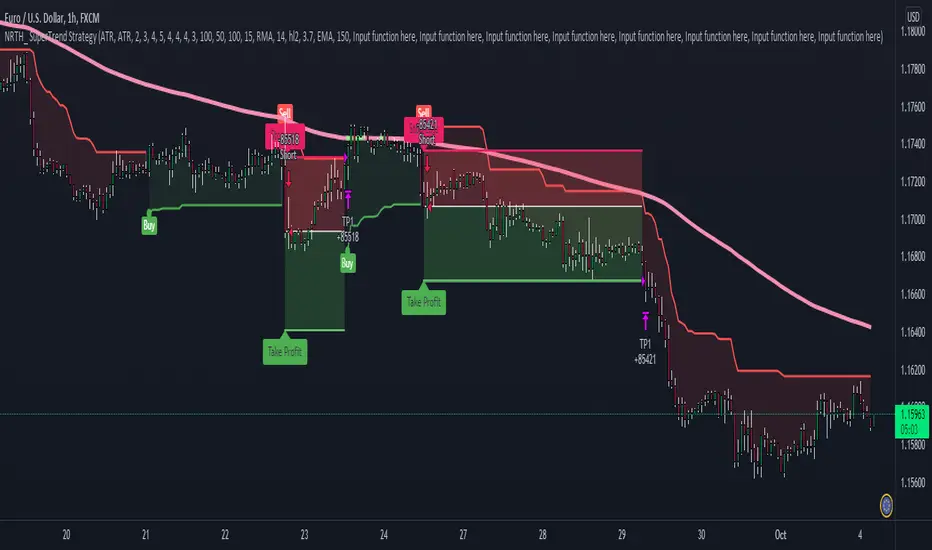
SuperTrend StrategyNRTH_ SuperTrend strategy, packed with alerts, visual backtesting, and ready for automation.
Comes included with the Premium Package.
Indicator features
Built-In Alerts
Visual Risk Management
Customizable Entry Rules
Usage Tips
Works on 15m+ timeframes, tweak sensitivity accordingly
We recommend using higher timeframes with very strict entries
Well known SuperTrend strategy, packed into a NRTH_ strategy package, with visual backtesting, custom risk management, and alerts ready for automation
Works for all markets with the ability to customize to your liking.
Backtesting Results Info
Period 1/1/2021-1/10/2021
Entry value at $1000 with 100x leverage
ATR Exits : 1:1.35 RR
-------------------------------------------
Disclaimer
Copyright NRTH_ Indicators 2021.
NRTH_ and all affiliated parties are not registered as financial advisors. The products & services NRTH_ offers are for educational purposes only and should not be construed as financial advice. You must be aware of the risks and be willing to bear any level of risk to invest in financial markets. Past performance is not necessarily indicative of future results. NRTH_ and all individuals associated assume no responsibility for your trading results or investments.
All investments involve risk, and the past performance of a security, industry, sector, market, financial product, trading strategy, or individual’s trading does not guarantee future results or returns. Investors are fully responsible for any investment decisions they make. Such decisions should be based solely on an evaluation of their financial circumstances, investment objectives, risk tolerance, and liquidity needs.
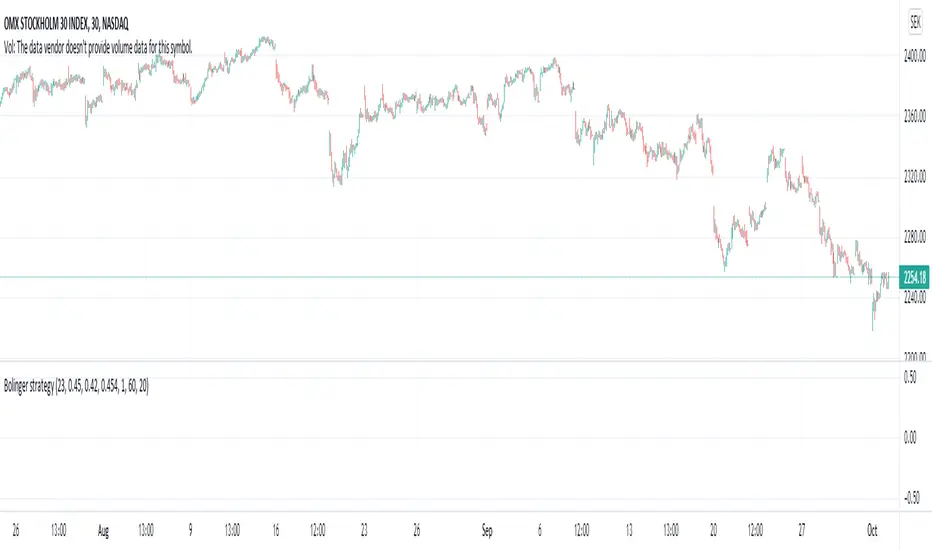
Bolinger strategy v1 openFind lows based on divergence on bollinger bands .
Works great on stocks and index, no success on forex.
Different stock/index requires different values.
Exit is not perfect, often on the safer side.
Example settings: NASDAQ:OMXS30, 30m: 25 0.452 0.42 0.453 2 62 20
Lower bbrower = buys harder dips, too low will cause buy during fall.
Higher bbrhigher = buys on lower dips
One of my first scripts, so code is not pretty
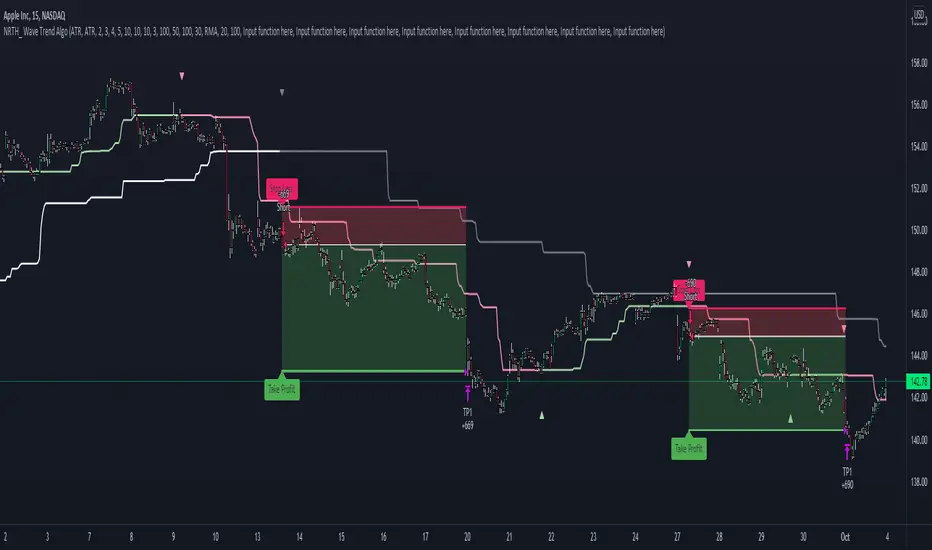
Wave Trend AlgoA NRTH_ Premium Double Trend Confirmation Algo
Comes included with the Premium Package.
Indicator features
Built-In Alerts
Visual Risk Management
Customizable Entry Rules
Usage Tips
This strategy works on timeframes as low as 15m, however not recommended for scalping with high fees.
Best performance with high Risk/Reward Ratios
The double trend confirmation (1 slow, 1 fast) uses lagging trend confirmation to your advantage, Identify confirmed moves and enter trades with high RR for the best results.
Works for all markets with the ability to customize to your liking.
Backtesting Results Info
Period 1/1/2021-1/10/2021
Entry value at $1000 with 100x leverage
ATR Exits : 1:3.3 RR
-------------------------------------------
Disclaimer
Copyright NRTH_ Indicators 2021.
NRTH_ and all affiliated parties are not registered as financial advisors. The products & services NRTH_ offers are for educational purposes only and should not be construed as financial advice. You must be aware of the risks and be willing to bear any level of risk to invest in financial markets. Past performance is not necessarily indicative of future results. NRTH_ and all individuals associated assume no responsibility for your trading results or investments.
All investments involve risk, and the past performance of a security, industry, sector, market, financial product, trading strategy, or individual’s trading does not guarantee future results or returns. Investors are fully responsible for any investment decisions they make. Such decisions should be based solely on an evaluation of their financial circumstances, investment objectives, risk tolerance, and liquidity needs.
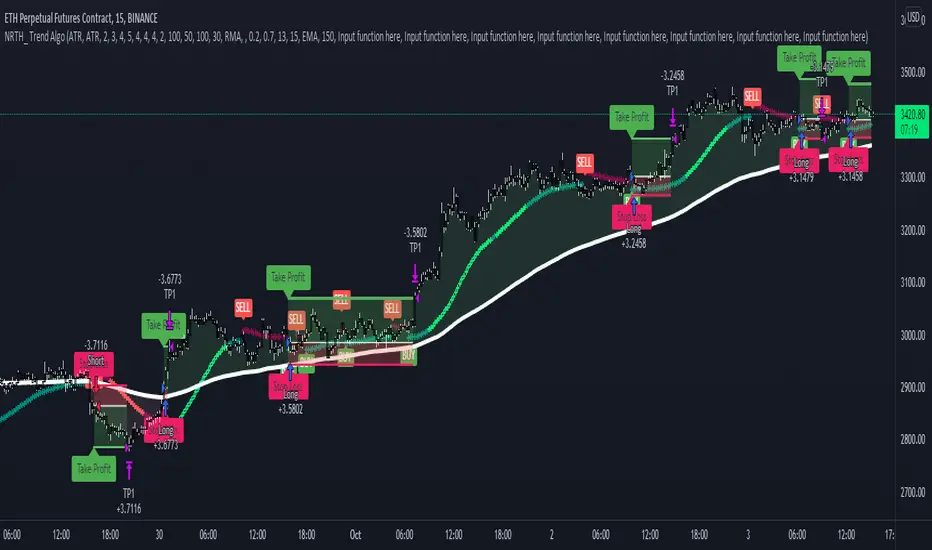
Trend AlgoA NRTH_ Premium Momentum Based Strategy
Comes included with the Premium Package.
Indicator features
Built-In Alerts
Visual Risk Management
Customizable Entry Rules
Usage Tips
This strategy works on timeframes as low as 5m, great for scalping or day trading.
The algo identifies price momentum with strict entry signal settings (can be made more or less sensitive).
Works for all markets with the ability to customize to your liking.
Backtesting Results Info
Period 1/1/2021-1/10/2021
Entry value at $1000 with 10x leverage
Binance standard taker fee rate (0.04%)
ATR Exits : 1:2 RR
-------------------------------------------
Disclaimer
Copyright NRTH_ Indicators 2021.
NRTH_ and all affiliated parties are not registered as financial advisors. The products & services NRTH_ offers are for educational purposes only and should not be construed as financial advice. You must be aware of the risks and be willing to bear any level of risk to invest in financial markets. Past performance is not necessarily indicative of future results. NRTH_ and all individuals associated assume no responsibility for your trading results or investments.
All investments involve risk, and the past performance of a security, industry, sector, market, financial product, trading strategy, or individual’s trading does not guarantee future results or returns. Investors are fully responsible for any investment decisions they make. Such decisions should be based solely on an evaluation of their financial circumstances, investment objectives, risk tolerance, and liquidity needs.
Algo Trading Strategy (Nifty & BankNifty)What is Algo Trading Strategy ( Nifty & Bank Nifty )?
There are many 9 to 5 working professionals who have some spare money to invest each month but they can not do active trading because they are busy with their full time job.
So they wish to have an automated system which could take and close trades for them with a proven back-tested strategy, proper money management, ability to trade within particular timings, pre-defined maximum loss they can bear and so on.
To cater needs of such type of traders, we created from scratch; and published an 'AutoTrading Algo (Nifty & Bank Nifty) in Sep 2021. (The link is given below, please read on).
Many people who want to try this AutoTrading Algo want us to share stats of this algo with them.
In order to fulfil this demand, we have converted that "Algo Trading" Study into a Strategy whose description you are reading right now.
For all other queries related to how our "Algo Trading (Nifty & Bank Nifty)" works, what are its limitations, benefits and other features, please read the description of our main 'Algo Trading (Bank Nifty & Nifty )' study which is available at following link:
Note:
1. in order to test this strategy on longer time period, you must have a Premium TradingView account.
2. If you have premium TradingView account, the stats you generate will exactly match with our stats which we keep sharing in our channel.
3. To Enable Auto-Trading, You will need to connect this Algo with your broker's trading platform through 3rd party platforms. We will guide you on how to do this, when you contact us.

MA&AOThat is quit simple strategy, which combines only two indicators: AO and MA. The logic of trades is also clear, when AO is bullish; slow ma is under the close price; fast ma > slow ma - buy.

Moving Average Band - Taylor V1A Very Simple Strategy From Moving Average
- Price Breakout Upper Band = Long
- Price Breakout Lower Band = Short
Moving Average Type = Able to Change RMA, EMA, SMA, WMA
Moving Average Period = Able to Change
Upper Band & Lower Band Gap = Able to Change
With Stop Lose & Take Profit = Able to Change

Bagheri IG Ether v2In this version, the winning ratio has been decreased, but the Risk to Reward Ratio (RRR) has been set to be better than the previous version.
This is a technical trading strategy for Ethereum ( BINANCE:ETHUSDT ). We built and developed it on MetaEditor and optimized it with MetaTrader optimizer.
The main indicators are Donchian Channel, Oscillator of ROC , Bears Power, Balance of Power , and Simple Moving Average ( SMA ). Default values in the input panel are the best combination of these indicators, but you can change any of them and try it for better results.
Please notice that this strategy has been optimized on the 1-minute chart of Ethereum .
For each position, you can see the Take Profit (TP) and Stop Loss (SL) levels. Also, you can find the values of mentioned TP and SL in points from the input panel of the script.
Attention: The price of Ethereum has 2 decimal places.
Therefore, 3000 points for TP means 30 USDT for trading 1 BINANCE:ETHUSDT .

Take Profit On Trend (by BHD_Trade_Bot)The purpose of strategy is to detect long-term uptrend and short-term downtrend so that you can easy to take profit.
The strategy also using BHD unit to detect how big you win and lose, so that you can use this strategy for all coins without worry about it have different percentage of price change.
ENTRY
The buy order is placed on assets that have long-term uptrend and short-term downtrend:
- Long-term uptrend condition: ema200 is going up (rsi200 greater than 51)
- Short-term downtrend condition: 2 last candles are down price (use candlestick for less delay)
CLOSE
The sell order is placed when take profit or stop loss:
- Take profit: price increase 1 BHD unit
- Stop loss: price decrease 2 BHD units
The strategy use $15 and trading fee is 0.1% for each order. So that, in the real-life, if you are using trade bot, it will need $1500 for trading 100 coins at the same time.
Pro tip : The 1-hour time frame for altcoin/USDT has the best results on average.

3xATR + EMA 260 + TP SL By NussaraStrategy backtest for 3X ATR + EMA 260
Exponential Moving Average
Moving averages smooth the price data to form a trend following indicator. They do not predict price direction, but rather define the current direction, though they lag due to being based on past prices. Despite this, moving averages help smooth price action and filter out the noise.
EMA=Price(t)×k+EMA(y)×(1−k)
where:
t=today
y=yesterday
N=number of days in EMA
k=2÷(N+1)
Average True Range
Average True Range ("ATR") was introduced by J. Welles Wilder in his 1978 book New Concepts In Technical Trading Systems. ATR is a measure of volatility for a stock or index
Calculation
ATR = (Previous ATR * (n - 1) + TR) / n
Where:
ATR = Average True Range
n = number of periods or bars
TR = True Range
The True Range for today is the greatest of the following:
Today's high minus today's low
The absolute value of today's high minus yesterday's close
The absolute value of today's low minus yesterday's close
3X ATR + EMA 260 Formula
1. ATR it indicates the market has a fluctuation. An indicator will check bar (High-Low) > 3 x ATR
2. EMA 260 identify the market uptrend or downtrend
- if condition (1) is true and the price closed above the EMA260 it’s an uptrend. An indicator will enter a long position.
- if condition (1) is true and the price closed below the EMA260 it’s a downtrend. An indicator will enter a short position.
Risk to Reward Ratio = 1:1.5
Stop loss = open price of entry position
This indicator is just a tool for technical analysis . It shouldn't be used as the only indication of trade because it causes you to lose your money. You should use other indicators to analyze together.
