[USDCHF-USDCAD] H1 Predict signal DinhChienFX's [2 orders]Identify trend:
4 EMAS 50-100-150-200:
- Uptrend: ema: 50 > 100 > 150 > 200
- Downtrend: ema: 50 < 100 < 150 < 200
Pivot:
- Left: 15 candles
- Right: 15 candles.
- Uptrend: Higher low - Higher High
- Downtrend: Lower Low - Lower High.
Keltner Channel:
- Uptrend: Candle crosses Upper 2.
- Downtrend: Candlestick crosses the Lower 2 line.
Strong trend according to ADX indicator:
- DI: 9
- Smooth: 9
- ADX: 38
Order entry point:
- Buy: Upper Keltner
- Sell Lower Keltner
Take Profit/Stop Loss: atr (20) x2 = Height of Keltner channel from Lower to Upper line.
Ketidakstabilan

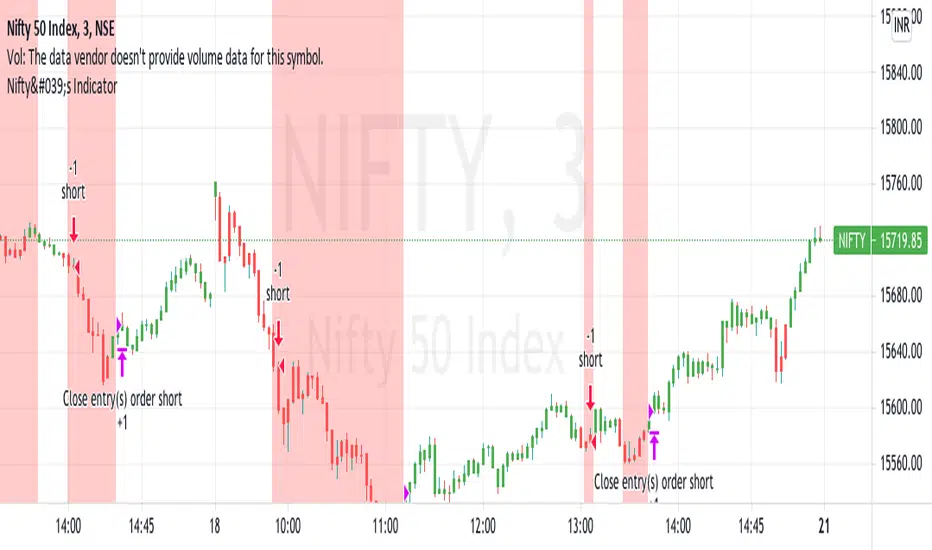
Nifty's IndicatorThis Indicator is only for Indian market and works only on 'Nifty' and 'Banknifty'. Please don't use it in any other stock/indices.
Use it in only in 3m and 1m timeframe. No other timeframe is to be used.
This indicator gives only sell signals on intraday basis.
When you apply this indicator on charts then you will see 2 things ploted there.
1. Barcolor
2. Background color
Barcolor :
We have use unique trend analysing tool in this indicator, which identifies price is in Uptrend or Downtrend. If price is in uptrend
then candle color will become GREEN and it will remain green until price comes in downtrend. In downtrend candle color becomes RED.
Background color :
We have observed that price behaves a certain way when it is in downtrend. So we try to catch that behaviour of Nifty and Banknifty .
And when ever we observe that behaviour, a red color background is formed in background. This red color background indicates user that
price may fall now.
HOW TO USE :
ENTRY => You should trade only on 3m timeframe. When you see a RED COLOR candle inside RED ZONE then take a SELL trade. That means red background
is indicating that price may fall and red color bar also indicating the same. And your entry should be in between 09:15-10:30 and 12:30-14:55.
This is the time slot when price is volatile.
EXIT => You exit when red zone ends or the trading day ends.
BACKTESTING :
Based on these entry and exit conditions , we have backtested this strategy ( taking only 1 share when sell signal comes ). You can see down arrow on
chart when sell signals comes and uparrow when we exit from trade.
Crypto EMA Trend Reversal StrategyThis is an EMA crossover strategy which involves 5 EMAs to trigger trades. The strategy has two take profit settings and uses a stop loss.
TP1 and SL are based on ATR and TP2 is an EMA crossover.
The strategy goes both long and short and the default settings work particularly well as a scalping strategy for ETHUSDT on the 5M time frame.
I have also created another version with tweaked settings for scalping LINKUSDT on the 5M with very similar results.
There is an option to add a volume condition parameter within the script on lines 26-28 which can be added to the end of lines 34-35 in the following format: and vol_cond
I personally don't currently use the volume condition parameter.

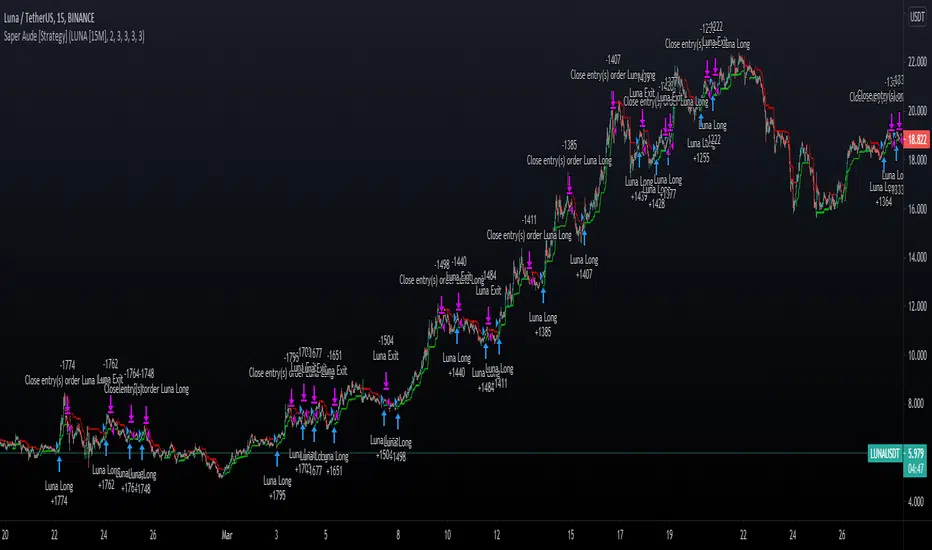
Saper Aude [Strategy]Sapere Aude Strategy
Trend based scalping strategy, to work on lower timeframes (15Minute - 1 Hour)
Calculations on ATR, strategy uses extra conditions to help filter out bad trades.
How to use the strategy?
Simple as when green line shows below, that can be either a good entry point or a signal to start building limit orders on the plot.
I use the ATR as a trailing stop loss for exit.
vica versa for entering shorts. The strategy is only set up to take long positions though.
This is a great scalping strategy for bots in Ranging or up trending markets.
This scripts has 5 variations built within it which are fitted for certain coins & their timeframes
The coins included are
BTC/USDT 1 Hour
ETH/USDT 1 Hour
ADA/USDT 30 Minutes
DOGE/USDT 15 Minutes
LUNA/USDT/15 Minutes
The Strategy backtest results includes Fess and there is NO Repaint! The script is written in Version 4
There is an option in the settings cog to choose from the 5 coins and their timeframes where they have been optimised
There is also an option to change the backtesting range
The stop Losses are also adjustable and listed under the settings
The strategy performs best on the Binance listings
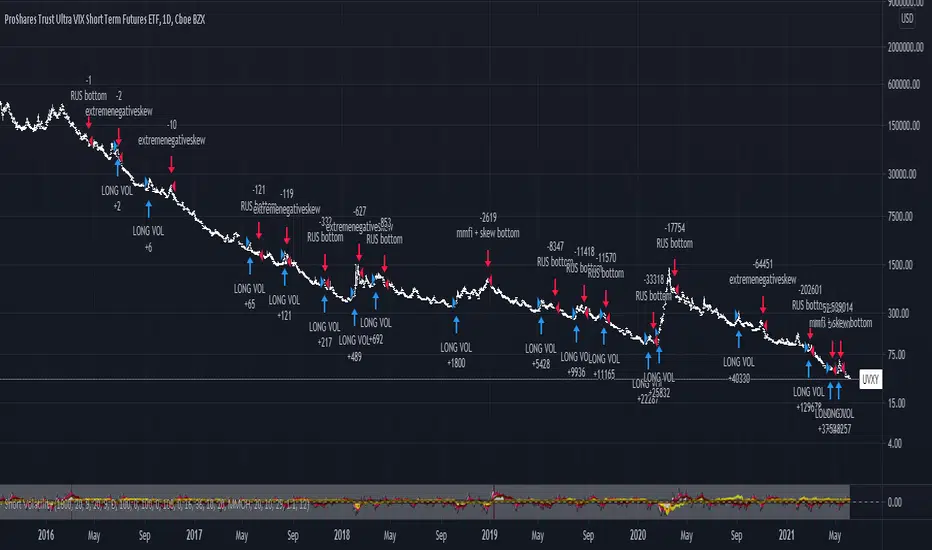
Long/Short Volatility AlgoA modification of my leveraged ETF algorithm. Giving out for free because it's a sloppy algorithm, and I personally use a much more refined algorithm developed by someone much smarter than me.
EMA RSI ATR Hidden Div Strat - 1 MinHey there!
Hereby I present you the EMA RSI Lowest Low Hidden Divergence strategy, which I discovered on a youtube channel.
He has tested the strategy hundreds of times manually, herewith I try to automate the whole thing.
Since I use the strategy with a bot, it can only enter long positions for now. But in the future I will add the possibility to trade short positions.
The strategy was tested with BTC/ USDT in 1m chart (8 days). The values must be adjusted depending on the timeframe and coin.
-----------------------------------------------------------------------------------
How does the strategy work?
First of all, we need a bullish hidden divergence.
Once this is detected, the following parameters are checked:
The 50 EMA must cross the 250 EMA .
Then, the candle must close above the 50 EMA .
The K line of the RSI STOCH indicator need to crosses the D line.
If the next candle closes above the 50 EMA , a long position is opened.
The stop loss is determined with the "lowest low/highest high lookback".
The profit factor is multiplied by the value of the lowest low/highest high lookback.
The results of the strategy are without commissions and levers.
If you have any questions or feedback, please let me know in the comments.
In the future I will add other types of stop loss / take profits. (ATR; %; eg.)
I wish you good luck with the strategy!

Crypto Strategy for Bearish Markets (Binance, FTX, Futures...)BINANCE:BTCUSDTPERP
Even in months like May '21 you can win by going long on Bitcoin. This strategy proves it and is not overwhelmed by Elon's ...
The backtest was carried out during the month of May of this year and, as you can see, all the long operations opened during the fall were successful.
So if we are going to continue to have a bear market for some time, why not take advantage of it while we remain bulls?
This strategy uses Dollar-Cost-Average (DCA) to average the entry price. Thanks to this, it is able to close profitable trades even in times of great volatility and bearish pressure.
It includes alerts that can be configured that will be sent every time the conditions to operate are met. These alerts can also be linked with 3commas for a fully automatic operation.
For Leverage Futures or Margin traders, all you have to do is divide the initial capital by the leverage used.
Enjoy!

HMA_ATR StrategyATR with HMA experimental minimalist bot for ETHBTC .
A strategy for use by Automated Algorithm systems.
Different from normal ATR as it uses HMA for smoothing.
Example settings result shown here on chart include commission 0.5%

[EURUSD60] BB Expansion StrategyOverview
This is a strategy that can be used in the EURUSD 60 time frame.
It is a trend-following method that uses Bollinger Bands Expansions.
The idea of using Bollinger Bands expansion is well known to the general public, but I don’t know any strategy that this idea has been PINE coded.
The three main components of this strategy are as follows.
・Long term BB and Short term BB : When the short term BB expands more than the long term BB, it suggests the occurrence of a trend.
・14EMA of 240 t/f : The direction of 14EMA of the upper time frame is used as the trend direction.
・ATR lines : As a stop-loss line and a take-profit line.
Description
Fig. Long entry pattern
Fig. Short entry pattern
・Description of lines
Gray : Large BB (=Long term BB)
White : Small BB (=Short term BB)
Blue or Red line : Upper t/f EMA(default: 14EMA), blue is up-trend, red is down-trend
Yellow : Stop loss line by ATR(the term is 14)
Purple : Take profit line by ATR(the term is 14)
・Description of strategy
First of all, when the small BB expands more than the large BB, this strategy detects the occurrence of a trend.
Second, When the price crosses over or crosses under small BB basis, this strategy entries long or short to trend direction (by upper time frame 14EMA).
The default stop-loss range is three times ATR value, and the default take-profit target is 1.5 times the stop-loss range (=risk reward ratio is 1.5).

Multi Supertrend with no-repaint HTF option strategyThis is the strategy version of the multi supertrend indicator.
The RoMDD looks good :)
Checked in ETHUSDT 1hour with auto HTF ON.
Have a look :)

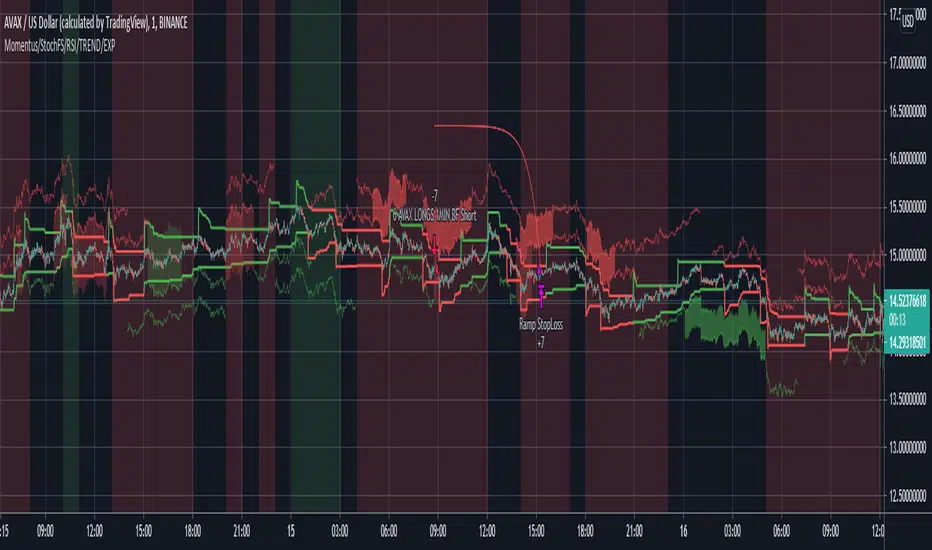
MACD/RVSI/Stoch/RSI/EXP(Drawdown)I have been trying for several months to get a script to work on the 1min and this one gives some good backtest results. This script will also work on higher timeframes however, I've not extensively tested on higher timeframes. My aim was to get results on about 20 crypto coins then run the 1min bots in parallel looking for small frequent profits across all the coins. If you would like me to try and fit backtest results to any coin or pair on any timeframe please do get in touch anytime.
It's based on several indicators which are combined and then a newish way for the stop loss to implement based on an exponential rising which limits the time in each trade unless the price moves in the direction of the trade. The other useful feature is drawdown minimization which previously made all of my 1minute bot attempts non-practical due to differences between backtesting and actually running the bot(s) live.
Its possible at the top to paste in strategy comments which can be used through web-hooks for auto trading bots. Leaving these blank just defaults to the pre-programmed comments that provide some indication of why a trade was exited.
It is possible to select for Short and/or Long trades. Note however, that there are exponential markers on the charts for both long and short trades in any setting. I found that this way the bot worked well with regards to timing.
The next part of the user interface settings gets a bit tricky so try and use the sample parameters provided below. For example, select a crypto coin then try some of the options below until a reasonable backtest result in obtained (or select the best from the parameter groups tested) then move down the settings interface to optimise with the remaining settings.
So 'Use MACD/RVSI', 'RSI clause' and 'Use Stochastic' are set to true for the below sample settings (1min timeframe).
MACD/RVSI Confluence Resolution (1min, 2min, 5min, 10min, 1hour)
Timeframe RSI (1min, 2min, 3min, 15min, 1hour)
FastStoch, SlowStoch (1min, 45min: 5min, 30min: 1min, 1hour: 5min, 1hour)
Eg. for FTX:ETHPERP (MACD/RVSI Confluence Resolution=1hour, Timeframe RSI= 1min, FastStoch = 1min, SlowStoch = 45min)
Setting the timings is tricky - there is a lot going on. Have a look at the chart and select/deselect the options. The MACD/RVSI Confluence Resolution shows red and green vertical regions on the chart background. The Timeframe RSI colors the candle bodies red and green. These go green if the RSI crossed over 31% or red in the RSI crossed under 69%. The MACD/RVSI Confluence Resolution is explained in more detail in one of my other scripts. Then the Slow Stoch colors above and below the price action with red or green lines depending if on an uptrend or downtrend (approximately). Where there is also an up/down trend on the faster timeframe stoch there are vertical shaded fill regions between the slow stop above/below lines.
With all the above conditions selected to represent the data (looking at strategy backtest results whilst adjusting) there is a reasonable approximation to a credible trade.
So once an ok backtest result is obtained by selecting timing settings. Its ontot the Stop Ramp Settings. This is an exponential line which rises rapidly after a period of time thus exiting the trade or going upwards with the trade. It kind of limits the maximum time a trade will stay in position which forms part of the timing aspect of this bot. Look at the chart exponential red lines and adjust the settings, along with the backtest results to select a good timing.
Then its the Drawdown Catcher and the Take Profit Setting. Start with the drawdown catcher disabled i.e. set to zero. Put in a conservative Take Profit, for example if a Take Profit at 6% gives the best backtest results, go for 4% to account for differences between backtest results and actual live bot performance.
Then start to increase the Drawdown Catcher. This shades a lime region where the bot will not enter a trade. I found that with most trades using this bot, if the price action moved in the direction of the trade (long or short) at the onset - this gave most of the good results (high probability of positive trade). Also if a trade entered at the start price and when south, the accumilated drawdown from these failing trades made all previous 1min bot attempt non=profitable in practice (even with good backtest results). The exp timing and also this drawdown reduction strategies seem to be the thing which makes this approach credible.
Try to go for settings that give a very high change of positive trade. For example, an 85% profitable trades will probably provide say 55% positive trades in practice as its always highly possible to just fit the parameters to the exact position/trade timings - and in reality going forwards these don't play out the same. Also a Profit Factor of 2 is about the minimum I would accept - again this provides for example a Profit Factor of 1.2 in practive.
However all being said - I think its possible with this bot on the 1min across lots of coins - with regularly updating settings - to make profits. (Not financial advice)
Please do get in touch if you would like me to fit this bot to anytimeframe to any trade.
MoonFlag PhD
Binance Estimaed Liquidations indicator/strategy
1) Provides ESTIMATED liquidation amount based od difference on volume between binance futures and coinbase spot(by default, you can change this)
2) Provides some strategies based on this numbers

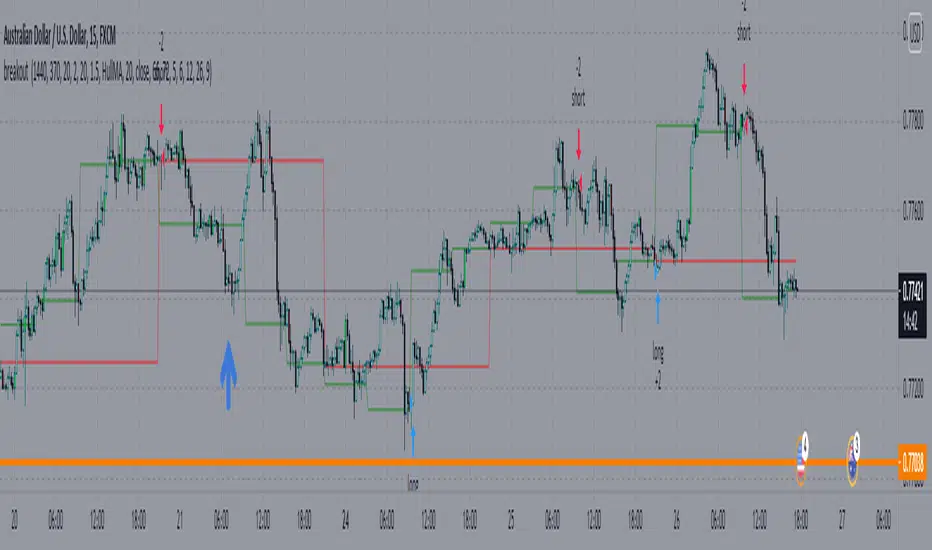
breakout crossover 4H 1DHi, this script is crossover between breakouts of 4H and Day timeframe. It also checks candlestick patterns before opening trades. Red horizontal line acts as support and resistance of Daily timeframe. You can close trades at next signal or at High/Low. Enjoy trading.
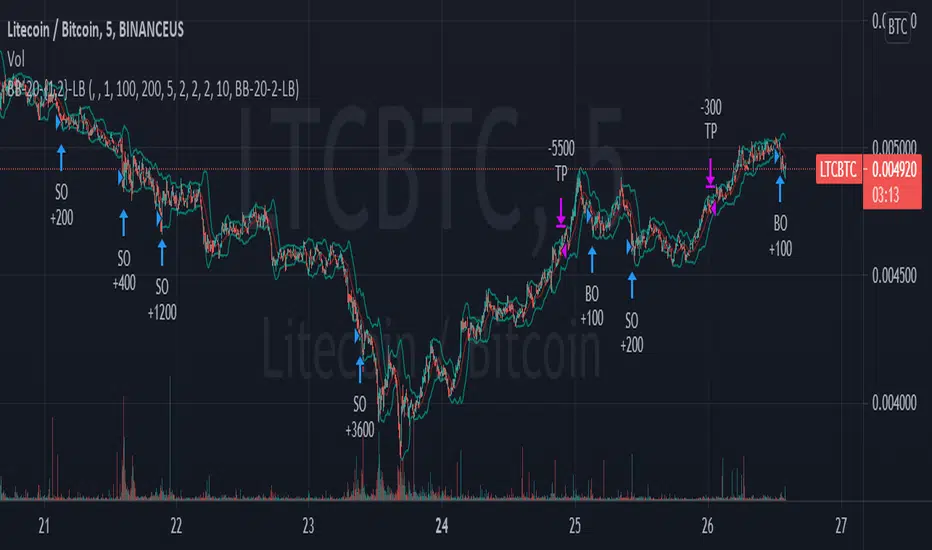
TA Presets - BB-20-1-LBThis is a near identical drop-in replacement for the 3commas TA Presets - BB-20-1-LB signal. Since you can not get this signal unless you are using Binance.com, I needed to produce my own for use with other exchanges. You are free to use this strategy yourself. It will always remain publicly available for free as there are no special tricks here, just your basic Bollinger Band strategy.
Known Issues and Limitations:
Trailing take profits are currently not supported for back testing -- You can still use them on a bot that uses this signal to trigger deal starts, just don't expect the performance of the bot to be the same as what's in the backtest if you do.
Only simple bots supported (no composite bot support yet)
Instructions
The options in the configuration screen are the same as they would be on the bot configuration screen. You can use the back testing screen to get a general idea of how the bot should perform on a given coin pair. Once you have the settings how you want, set the "Bot ID" and "Email Token" fields. to match those used in the deal start message for your bot. Do not include quotes around either of them. Your bot ID should just be a string of numbers and your email token will be a string of letters and numbers separated by hyphens. Once you enter these in to the settings, you can create your alert. Select "BB-20-1-LB" from the dropdown on the alert screen and type {{strategy.order.alert_message}} in the text box (NOTHING ELSE, NO QUOTES, NOTHING). That's it, the script will generate the rest of the deal start message for you automatically.
Important Notes
This may go without saying but make sure that you are using the chart for your exchange when setting this up to control a bot. While it may look like prices are the same across the different exchanges, subtle differences in volatility and trading volume WILL make a difference and your bot WILL NOT perform as shown on the back test.
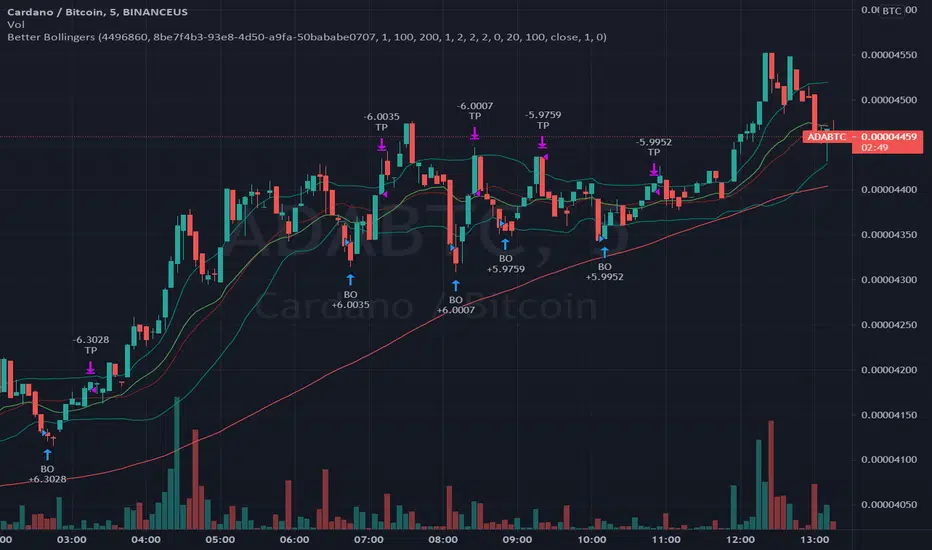
Better BollingersThe Bollinger Band strategy is a powerful and effective tool for automated trading in high volatility markets. The trouble is that, by itself, it is not very profitable. We need a way to know if the volatility we're seeing is part of a larger trend in the direction we want to trade in. Doing this, we can avoid entering long trades during a macro downtrending market meaning we can use tighter stop losses and open trades with more confidence than if we didn't have an idea of the larger market trend.
This script is ideal for, and geared towards, users of the 3commas automated trading platform. It behaves similarly to the familiar TA Presets BB-20- family of strategies but includes other indicators to help weed out some of the noise in a highly volatile market. Additionally, users who are not on Binance.com, but using 3commas for trading, now have access to signals comparable to those provided by the builtin signals for Binance.com.
Momentum Trading Strategy (Weekly Chart)The strategy will open position when there is momentum in the stock
The strategy will ride up your stop loss based on the super trend.
The strategy will close your operation when the market price crossed the stop loss.
The strategy will close operation when the line based on the volatility will crossed

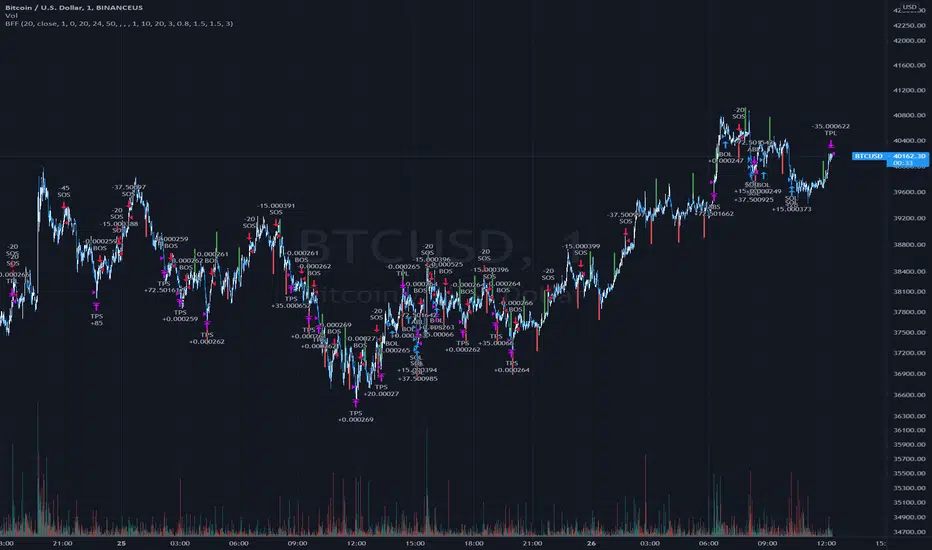
Bollinger Flip Flop StrategyThis strategy combines both long and short Bollinger band strategies with a signal to determine to determine when it's appropriate to use each. Additionally, the strategy has protections in place for market conditions which would normally cause a trade to be stuck due to a long market trend change. Think of it like a stop loss but instead of basing the stop on a percentage from entry, it's based on prevailing market conditions.
This strategy is ideal for controlling trading bots on the 3commas.io platform. To do this, you will need to set up two "simple" bots, one for short trades and one for long trades. Other than their direction, they should be configured identically. Set the parameters for the bot the same as you have them set in the strategy preferences. Once you've done this, set the "Short Bot ID" and "Long Bot ID" fields to the ID numbers for each bot, respectively. Next, set the Email Token parameter (this will be the same for both bots). Once you've done this, you need only configure a single alert per coin pair with the alert message set to {{strategy.order.alert_message}}. Make sure you have all of the strategy settings, including bot IDs and email tokens set correctly before creating the alert . These parameters are saved in the alert and can be safely changed on the active chart once the alert is created without affecting the alert.
Bollinger Band + RSI + ADX + MACD + HeikinashiThis script takes into picture Bollinger Bands, RSI with a comparator value, ADX with a comparator value, and MACD with Heikinashi Direction
THIS IS A LONG-ONLY STRATEGY. SHORT TRADES ARE NOT INCLUDED
Strategy:
The Strategy takes a trade only after ALL the following conditions are met.
Candle low is lower than the Bollinger Lower band
RSI is higher than the comparator value
ADX is higher than the comparator value
MACD value is higher than the Signal value
Stop Loss : Max of (Low of the candle - 0.22% and Close of the candle - 0.32%) - FYI, because its max, it's lower of the 2 and your risk is lesser
Target : Max of (Bollinger Band Upper band and 0.75% of the value of underlying) - FYI, it takes the maximum available

TDI Hedge Strategy
This is the incomplete version but upon multiple requests, I have released it early. All of the strategy and alert functions are yet to be written and I'll get around to it soon.
This indicator aims to be the best TDI indicator on TradingView. It is a strategy or study. It will have all of the filter, entry, and exit conditions for the strategies around the TDI.
What is implemented
MFI or RSI: the MFI is a much better TDI baseline than the RSI, in my opinion, and very effective
EMA or SMA used for the moving averages on fast, slow, and volatility band
Dynamic timeframe: set a factor of current timeframe and indicator will analyse higher timeframe automatically
Manual timeframe: set a higher timeframe to analyse different to currently viewed
Features for later
conditions for TDI filters/entries/exits
Strategy functions to use built-in strategy tester
BTE signal plot for Backtesting & Trading Engine
alerts
Enjoy!

AltTrader BackTester Swing&ScalpDrum Roll!
Major announcement here for the release of the backtesting script!
This script is the backtesting version of AltSignals Alt-Trader Scalp & Swing indicator
This indicator has all the same features but now you can see previous results
Things to note
Make sure the correct take profit % are selected and add up to 100
Make sure you select the correct timeframe to backtest, zoom out on web browser to see more dates
Remember backtesting does not predict the future, the market is an ever changing beast!

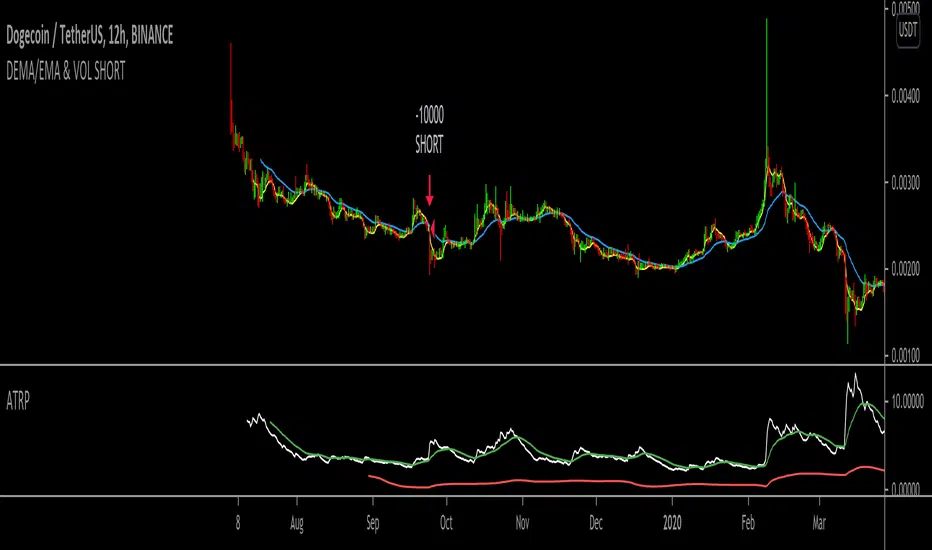
DEMA/EMA & VOL (Short strategy)Hello,
I am trying to build a short momentum strategy that is based off of the DEMA crossing under the EMA, but because many momentum strategies send too many signals, I have also implemented a volatility condition based on the average true range percentage (ATRP). Essentially, as momentum moves downwards + volatility (ATRP) moves upwards, it shorts the security. However, I am having an issue with exiting trades. I think this would be a great strategy if I could simply get the strategy to exit the trades. Does anyone mind looking through the source code and tell me what I might be doing wrong? In return, I would hope that this strategy could be useful to you in same way! Thank you for looking!
3x SuperTrend Strategy (Mel0nTek) V1This is a triple SuperTrend based strategy for lower time frame trades such as day trades and scalping. I have not seen many strategies that combine multiple SuperTrends so I thought I would publish this one since I put it together and have been quite happy with the results. I have found through testing that the best results are on currency exchange markets such as Crypto or Forex on 1-15 min time frames.
The core idea was inspired by a youtube video put out by Trade Pro:
"Trade Pro - HIGHEST PROFIT Triple Supertrend Trading Strategy Proven 100 Trade Results"
I went ahead and set the defaults to the ones he uses in his video for anyone who wants to try a configuration similar to his. They work pretty well in general, however the EMA, SuperTrend ATR multipliers, and P/L ratio can be tuned/optimized to fit the timeframe/market desired. The video is quite good but not a required watch as I will explain below.
The 200EMA is used as a medium-term trend direction indicator.
- Price closing consistently above the 200EMA means that only long positions should be entered.
- Price closing consistently below 200EMA means that only short positions should be entered.
The 3 SuperTrend indicators should be used as direction confirmation for entries. Typically, price above SuperTrend indicates bullish movement, while price below SuperTrend indicates Bearish movement. However by itself, it is not a great indication to enter/exit positions in my experience. By combining 3 of them with slightly longer periods and increased ATR multipliers, we can get much stronger confirmation of trend direction/strength.
The way they are used in this strategy is such that:
- We only want to enter a position if at least 2 out of 3 SuperTrends are on our side.
- 3/3 SuperTrends on our side is the best case, since we are taking trades WITH momentum/price strength.
- The second farthest SuperTrend from entry price is used as a Stop Loss
SuperTrend being on our side is not the only requirement for an entry however. The probability of success is increased with SuperTrend, and a longer EMA on our side, but we want to be sure that we aren't getting in too late/after the movement has already happened.
So we use Stoch RSI to pick our entries where price is oversold/overbought and reversing. That means the Stoch RSI is above 80, or below 20, and our indication to enter the trade is when the 2 lines cross/begin reversing direction.
So with trend direction on our side, we can get really good entries at these oversold/overbought extremes, especially as it's reversing (Stoch RSI K and D are crossing). This allows us to use the SuperTrend as a support/stop loss on our entry since price should be above it.
Then we just target 1.5x our max loss so that even if we only win 50% of the time, we still make a profit.
The explicit rules of this strategy are as follows:
=== Rules ===
long only
- price above EMA200
short only
- price below EMA200
Stop Loss = 2nd SuperTrend line above (short) or below(long) entry candle
Profit = 1.5x SL/risk (Profit Ratio x Max Loss)
=== Entry Setup ===
LONG
- Stoch RSI below 20, cross up
- at least 2 SuperTrend lines below close
SHORT
- Stoch RSI above 80, cross down
- at least 2 SuperTrend lines above close
P.S. Special thanks to Trade Pro for producing so many quality videos, putting strategy claims to the test, and providing me with so many good ideas I apply to my own strategies.
