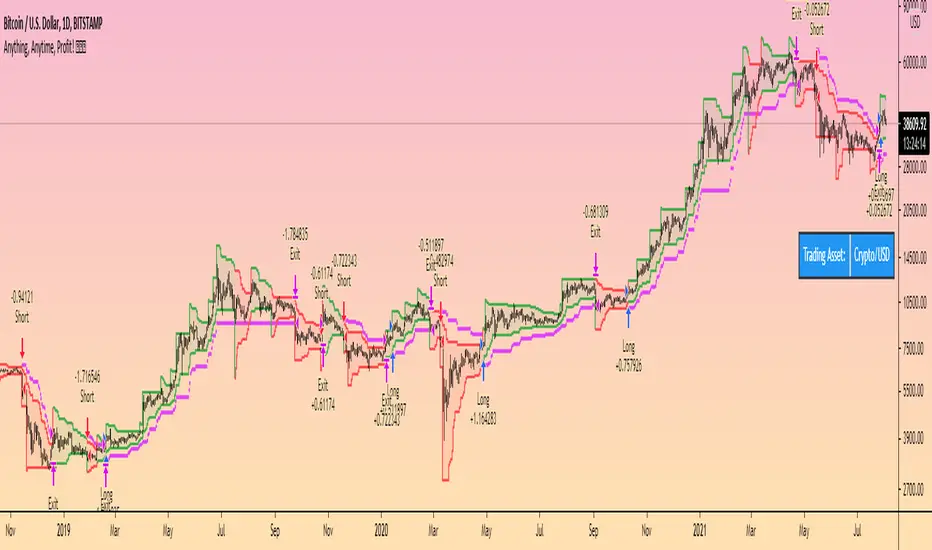
Trend Surfers - Premium Breakout + AlertsTrend Surfers - Premium Breakout Strategy with Alerts
I am happy today to release the first free Trend Surfers complete Breakout Strategy!
The strategy includes:
Entry for Long and Short
Stoploss
Position Size
Exit Signal
Risk Management Feature
How the strategy works
This is a Trend Following strategy. The strategy will have drawdowns, but they will be way smaller than what you would go through with buy and old.
As a Trend Following strategy, we will buy on strength, when a breakout occurs. And sell on weakness.
The strategy includes a FIX Stoploss determined by an ATR multiple and a trailing Stoploss/Takeprofit also determined by an ATR multiple.
You can also manage your risk by entering the maximum % you are willing to risk on every trade. Additionally, there is an option to enter how many pairs you will be trading with the strategy. This will change your position size in order to make sure that you have enough funds to trade all your favorite pairs.
Use the strategy with alerts
This strategy is alert-ready. All you have to do is:
Go on a pair you would like to trade
Create an alert
Select the strategy as a Trigger
Wait for new orders to be sent to you
Every Entry (Long/Short) will include:
Market Entry (Enter position NOW!)
Stoploss price
Position Size
Leverage
* If you do not wish to use leverage, you can multiply the Position Size by the Leverage. But doing that, you might end up with a position greater than your equity. Trading on Futures is better in order to have accurate risk management.
Exit signals:
When you receive an exit signal, you need to close the position ASAP. If you want to keep your results as close as possible to the backtest results, you need to execute quickly and follow what the strategy is telling you.
Do not try to outsmart the strategy
Leave your emotion out of trading! If you trust the strategy, you will have way better returns than if you try to outsmart it. Follow each signal you receive even if it doesn't seem logical at the moment.
Become a machine that executes. Don't look at fundamentals. Follow the trend! Trust the strategy!
I hope you enjoy it!
Ketidakstabilan

Point of possible Reversal (PPR): forex Strategypoint of possible Reversal, PPR :
in this strategy I have tried to find out the possible Reversal points in the forex pairs. It’s the most resisted levels from where the trend takes up a particular direction. These PPR can lead the price in any direction depending upon the time zone its happening in.
In this strategy once the code finds a PPR it then checks for suitable time zone then it checks for the RSI confirmation, it checks for the Parkinson Volatility, it checks for internal Bar Strength (refer below for more information)
The following setting details will help you in the understanding the strategy and indicator used:
This indicator contains the following setting:
1.Fixed trading sessions for Long and Short
i. Fixed trading session for long trades (long position can be taken in that period of time only)
ii. Fixed trading session for short trades (Short position can be taken in that period of time only)
The concept behind restricting the time to go long or short is because in forex the particular pair move in a particular direction depending upon the currency and time zones.
This strategy works on different forex pairs, you need to find the best settings. I will be providing the best settings which works for this strategy and different pairs.
2.Setting for back test selection date range you can check the beck test of a particular time range.
3.You can check Long and Short positions performance separately, by unchecking the “ Go_long ” option it will remove all long positions from back test. Vice versa for “ Go_short "option
4.Internal Bar Strength
IBS is simply an indicator where you buy on weakness and sell on strength, the cornerstone of any mean-reverting strategy.
It oscillates from zero to one and measures the relative position of the closing price relative to the High and Low.
IBS = (Close – Low) / (High – Low)
In the input setting the you can disable enable the IBS option from the strategy.
5. Parkinson volatility
Parkinson volatility is a volatility measure that uses the stock’s high and low price of the day (can be changed in the setting, instead of day it can be set to any bar length)
The main difference between regular volatility and Parkinson volatility is that the latter uses high and low prices for a day, rather than only the closing price.
In the setting you have three option
1. Enter Volatility Threshold
If the Parkinson volatility value is greater than the the threshold value then it lets the trade happen.
2.Set the high/low bar time frame for calculating Parkinson volatility. ( Set 60m by default)
Formula used as below:
high_=security(syminfo.ticker, input("60"), high)
low_=security(syminfo.ticker, input("60"), low)
hourlyRangeSquared = pow((log(high_) - log(low_)), 2)
dailyParkinsonVol = sqrt(sum(hourlyRangeSquared, 24) / (4 * log(2)))
6. "Enter no of contract size"
This setting helps you to set the contract size , by default it is set to 100000.
7.This setting is for the PPR, in this you can change the search of PPR in another time frame, you can add higher timeframe PPR in the chart, by default the PPR is set to search for current time frame PPR.
8.Futrther confirmation of trade is done through the RSI criteria . In this I have provided four kind of RSI confirmation you can test all by selecting any one of the four.
1. filter trade on the basis of BB of RSI (as shown in the image)
2. filter trade on the basis of RSI Levels (RSI>50 for long, vice versa for short)
3. filter trade by rsi>basis of BB of RSI(for long) & rsi<50(for short)
4. filter trade by rsi>50(long) & rsi< basis of BB of RSI(short)
SELECT ONLY ONE OF THE ABOVE IN SETTING.
9.For Exiting the trade I have used the trailing SL you can change it in setting.
You can exit the trade using two targets (two take profit) using different size for editing the trade.
If you want to take only on target then you have to make QANTITY of shares for 1st Exit as 100. Then you will exit all your position in the first target achieved.
A big thanks to kodify.net there articles are very helpful kodify.net
Thanks to stack overflow community for clearing the doubts.
Thanks to Mickey for providing assistance.
Trading view official documentation on V4 of pine script also helped me.

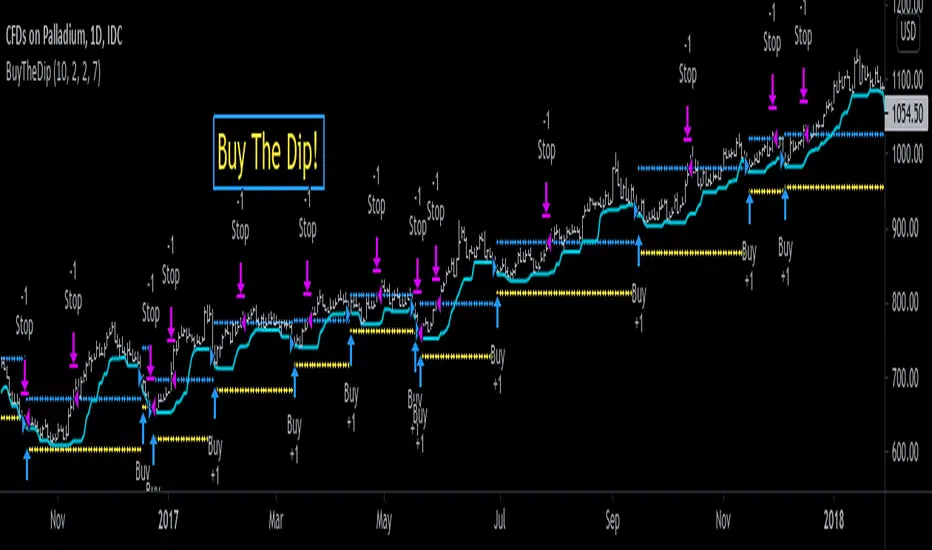
Buying Dip Strategy With Take Profit And Stop Loss [racer8]"Buy low, sell high."
This system buys the dip and takes profit for a high win rate.
It uses an ATR take profit and ATR stop loss.
It buys the dip when the close is below the previous 7 day low.
Daily timeframe is best.
Enjoy ♡
PSAR-Risk Strategy Analysis ToolThis is the strategy version of my PRS indicator, information of how it works and parameters explanation is located there. This generates performance chart and an exportable trading log, but it's incapable of sending alerts (the reason of the fork). Use this tool for backtesting information and the original PRS to generate the alerts, once the optimal input values have been found with this tool.

Fixed price Stop Loss [Takazudo]This strategy is a demo for fixed price stop loss.
This strategy enables you to specify fixed price stop loss. Let's say your deposit is USD. When you trade EURCAD, you need to specify the quantity for trade. Here comes three chances for trade.
A: SL pips: 500
B: SL pips: 200
C: SL pips: 100
In these trade, the risk is different for each. ABC risk ratio is 5:2:1. And, you cannot know how much to lose if the price hits the stop loss. This is a huge problem.
With this strategy, You can specify the fixed risk price for each trade. If you specify 100 USD for the risk, this strategy calculates how much quantity to buy or sell for each entry. In the case above, this strategy guides you how much quantity to buy or sell like below.
A: 2,000 qty (SL: 500pips)
B: 5,000 qty (SL: 200pips)
C: 10,000 qty (SL: 100pips)
If you make entries with those quantity and the price hits the stop loss, You will lose the money like below.
A: 100 USD
B: 100 USD
C: 100 USD
This is what this script does. Fixed price SL.
I tested this caliculation for OANDA's main 28 currency pairs forex listed below.
AUDUSD, EURUSD, GBPUSD, NZDUSD, USDCAD, USDCHF, USDJPY, AUDCAD, AUDCHF, AUDJPY, AUDNZD, CADCHF, CADJPY, CHFJPY, EURAUD, EURCAD, EURCHF, EURGBP, EURJPY, EURNZD, GBPAUD, GBPCAD, GBPCHF, GBPJPY, GBPNZD, NZDCAD, NZDCHF, NZDJPY
I may add more pairs later.
Note: The entry strategy in this script is not intented to win. Check the result. Be careful.

ES Scalper ver.1.0The strategy is scalping around my mathematical defined S/R on m1 timeframe. The secret sauce here is the formula, other parts of the strategy is quite simple. There is a hard SL to eliminate big losses, though it's 100% win rate on ES. There is no soft SL on this script, so use it with your own risk. The strategy trades two contracts per signal and the pyramid is 2. Change it to whatever you want.
The strategy works well on 1-min ES and GBPAUD but it doesn't mean it will on other assets. Trailing points, trailing offset and timeframe are three parts that you can play with. Do notice that the performance of the backtest doesn't represent the performance of live trading. I don't charge for any price on this script, so you could just give me a DM or an Email if you want to use it.

Scalping Dips On Trend (by Coinrule)Coinrule's Community is an excellent source of inspiration for our trading strategies.
In these months of Bull Market, our traders opted mostly on buy-the-dips strategies, which resulted in great returns recently. But there has been an element that turned out to be the cause for deep division among the Community.
Is it advisable or not to use a stop-loss during a Bull Market?
This strategy comes with a large stop-loss to offer a safer alternative for those that are not used to trade with a downside protection.
Entry
The strategy buys only when the price is above the Moving Average 50 , making it less risky to buy the dip, which is set to 2%.
The preferred time frame is 1-hour.
The stop-loss is set to be quite loose to increase the chances of closing the trade in profit, yet protecting from unexpected larger drawdowns that could undermine the allocation's liquidity.
Exit
Stop loss: 10%
Take Profit: 3%
In times of Bull Market, such a trading system has a very high percentage of trades closed in profit (ranging between 70% to 80%), which makes it still overall profitable to have a stop-loss three times larger than the take profit.
Pro tip: use a larger stop-loss only when you expect to close in profit most of the trades!
The strategy assumes each order to trade 30% of the available capital and opens a trade at a time. A trading fee of 0.1% is taken into account.

Break of structure (BOS) forex StrategyPlease read all Details before using this indicator
This strategy is based on taking position after the break of a Previous High/Low swing happens (fixed time frame), the break of structure happens because of the swing happens then we go long or short respectively in this strategy.
I will be discussing the setting details through which you can make it work on different forex pairs.
Does it work on other pairs?
Yes, I have found similar back test results on other USD pairs.
Does it works on smaller time frame?
Yes it does work on smaller time frame , you have to understand the below concepts used and try different settings.
For the user the most important thing is to understand the settings of the indicator so that they can optimize the setting and get the best results:
This indicator contains the following IMPORTANT setting:
i. Fixed trading session for long trades (long position can be taken in that period of time only)
ii. Fixed trading session for short trades (Short position can be taken in that period of time only)
The concept behind restricting the time to go long or short is because in forex the particular pair move in a particular direction depending upon the currency and time zones.
This strategy works on different forex pairs, you need to find the best settings. I will be providing the best settings which works for this strategy and different pairs.
2. Choose Previous High/Low Timeframe
This is the most important option where you have to choose the timeframe for which you want H/L by default it is set to “D”. This timeframe H/L reference will be taken for taking trading decisions.
3.Setting for back test selection date range you can check the beck test of a particular time range.
4.You can check Long and Short positions performance separately, by unchecking the “Go_long” option it will remove all long positions from back test. Vice versa for “Go_short option”
5.Internal Bar Strength
IBS is simply an indicator where you buy on weakness and sell on strength, the cornerstone of any mean-reverting strategy.
It oscillates from zero to one and measures the relative position of the closing price relative to the High and Low.
IBS = (Close – Low) / (High – Low)
In the input setting the you can disable enable the IBS option from the strategy.
6. Parkinson volatility
Parkinson volatility is a volatility measure that uses the stock’s high and low price of the day (can be changed in the setting, instead of day it can be set to any bar length)
The main difference between regular volatility and Parkinson volatility is that the latter uses high and low prices for a day, rather than only the closing price.
In the setting you have three option
i. Enter Volatility Threshold
If the Parkinson volatility value is greater than the the threshold value then it lets the trade happen.
ii.Set the high/low bar time frame for calculating Parkinson volatility. ( Set 60m by default)
Formula used as below:
high_=security(syminfo.ticker, input("60"), high)
low_=security(syminfo.ticker, input("60"), low)
hourlyRangeSquared = pow((log(high_) - log(low_)), 2)
dailyParkinsonVol = sqrt(sum(hourlyRangeSquared, 24) / (4 * log(2)))
7. "Enter no of contract size"
This setting helps you to set the contract size , by default it is set to 100000.
8. “Zigzag Filter Length” this setting is for SWING H/L Lookback. With the help of this I have ploted Swing Support and Resistance.
9.Futrther confirmation of trade is done through the RSI criteria. In this I have provided four kind of RSI confirmation you can test all by selecting any one of the four.
i. filter trade on the basis of BB of RSI (as shown in the image)
ii. filter trade on the basis of RSI Levels (RSI>50 for long, vice versa for short)
iii. filter trade by rsi>basis of BB of RSI(for long) & rsi<50(for short)
iv. filter trade by rsi>50(long) & rsi< basis of BB of RSI(short)
SELECT ONLY ONE OF THE ABOVE IN SETTING.
10.For Exiting the trade I have used the trailing SL you can change it in setting.
You can exit the trade using two targets (two take profit) using different size for exiting the trade.
If you want to take only on target then you have to make QANTITY of shares for 1st Exit as 100. Then you will exit all your position in the first target.
A big thanks to kodify.net there articles are very helpful kodify.net
Thanks to Mickey for providing assistance.
Thanks to stack overflow community for clearing the doubts.
Trading view official documentation on V4 of pine script also helped me.

Predict DinhChienFX's1. Identify the trend
* On the chart:
a. Part of Dow theory: multi-trades active at the impulse waves.
Uptrend trend:
- HH / Higher High: The following peak is higher than the previous one.
- HL / Higher Low: The back bottom is higher than the previous one.
Downtrend:
- LL / Lower Low: The back bottom is lower than the previous one.
- LH / Lower High: The posterior peak is lower than the previous one
b. Keltner price channel:
Uptrend: Go above Upper 2
Bearish trend: Down to Lower 2
* Under Chart:
Stochastic indicator: 21 past candles
- Uptrend: Index K and D surpass 80
- Buy zone: Index D is large 80.
----------------------------
- Downward trend: K and D indexes go down to 20.
- Sell zone: Index D is less than 20.
RSI indicator: 21 past candles
- Uptrend: value exceeds 80.
- Downward trend: value exceeds 20.
ADX indicator: Used to identify a strong trend
- ADX smooth: 9
- DI: 9
2. Entry point:
- Buy: wait to buy on the Upper Keltner channel.
- Sell (sell): wait for sell at the Lower Keltner channel.
3. Take profit, stoploss
ATR indicator (20) (Average true range) * 2

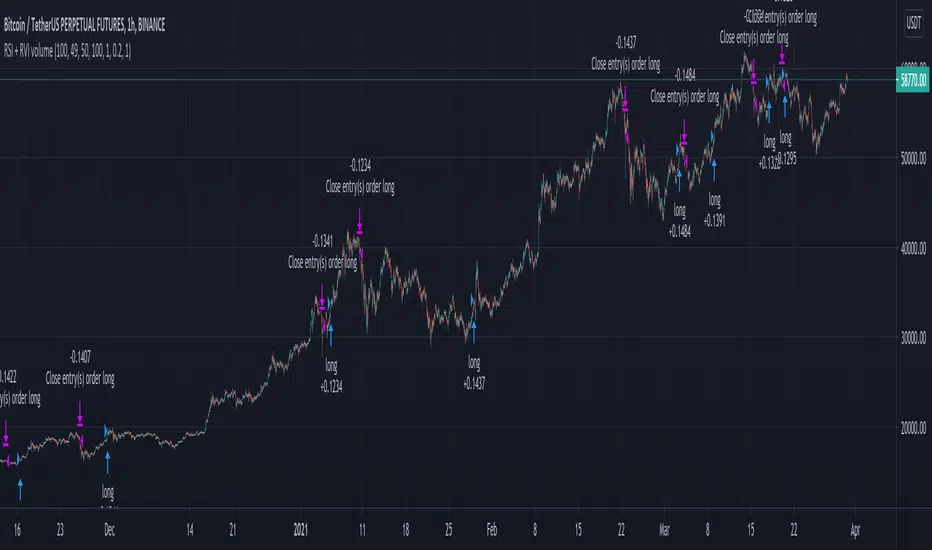
RSI and RVI on volume crypto BTC This strategy combine special version of RSI and RVI , where in this case , I am using the volume , for measuring the speed and change of volume to the price both up and down size together with the volatility spikes.
In this case instead of looking at the volume or volatility, I am combining them into one oscillator.
For best usage, I believe a big length of candles like 100 can get better results, and use it in this way as a lagging indicator.
Since most of the tests I made for futures, I applied a risk management in % of the price movement. For stop loss we have 20% while for TP, 100%. However in both cases, we will exit sooner, and thats going to be when condition from the oscillator says so.
For this we have a middle level, 50, which will act as both overbought and oversold areas.
At the same time I apply the posibility of using leverage into size calculations for more precise tests and try to get min-max out of it.
If you have any questions, please let me know !
Bollinger Bands Trending Reverse StrategyWelcome to yet another script. This script was a lot easier since I was stuck for so long on the Donchian Channels one and learned so much from that one that I could use in this one.
This code should be a lot cleaner compared to the Donchian Channels, but we'll leave that up to the pro's.
This strategy has two entry signals, long = when price hits lower band, while above EMA, previous candle was bearish and current candle is bullish.
Short = when price hits upper band, while below EMA, previous candle was bullish and current candle is bearish.
Take profits are the opposite side's band(lower band for long signals, upper band for short signals). This means our take profit price will change per bar.
Our stop loss doesn't change, it's the difference between entry price and the take profit target divided by the input risk reward.

CRYPTO RVI FUTURE 1HThis is a crypto strategy adapted for the futures pairs, especially the perpusdt ones from binance for 1h time frame.
The main component here is the RVI, which is a modified form of the RSI indicator. The RVI, measures more the general direction of the volatility, and can get the trends far smoother than the RSI.
The logic inside is the same like we would normally do with RSI, we check for overbought and oversold levels, and based of that we have an entry or exit depending if we go long or short.
I have tested this product with all the pairs from PERPUSDT from binance and seems to works with the majority of them, of course on some better than the others.
If there are any questions, please let me know !

3Commas Bollinger StrategyThis strategy is intended for use as a way of backtesting various parameters available on 3commas.io composite bot using a bollinger band type trading strategy. While it's primary intention is to provide users a way of backtesting bot parameters, it can also be used to trigger a deal start by either using the {{strategy.open.alert_message}} field in your alert and providing the bot details in the configuration screen for the strategy or by including the usual deal start message provided by 3commas. You can find more information about how to do this from help.3commas.io
The primary inputs for the strategy are:
// USER INPUTS
Short MA Window - The length of the Short moving average
Long MA Window - The length of the Long moving average
Upper Band Offset - The offset to use for the upper bollinger offset
Lower Band Offset - The offset to use for the lower bollinger offset
Long Stop Loss % - The stop loss percentage to test
Long Take Profit % - The Take profit percentage to test
Initial SO Deviation % - The price deviation percentage required to place to first safety order
Safety Order Vol Step % - The volume scale to test
3Commas Bot ID - (self explanatory)
Bot Email Token - Found in the deal start message for your bot (see link in previous section for details)
3Commas Bot Trading Pair - The pair to include for composite bot start deals (should match format of 3commas, not TradingView IE. USDT_BTC not BTCUSDT)
Start Date, Month, Year and End Date, Month and Year all apply to the backtesting window. By default it will use as much data as it can given the current period select (there is less historical data available for periods below 1H) back as far as 2016 (there appears to be no historical data on Trading view much before this). If you would like to test a different period of time, just change these values accordingly.
Known Issues
Currently there are a couple of issues with this strategy that you should be aware of. I may fix them at some point in the future but they don't really bug me so this is more for informational purposes than a promise that they may one day be fixed.
Does not test trailing take profit
Number of safety orders and Safety Order Step Scale are currently not user configurable (must edit source code)
Using the user configuration to generate deal start message assumes you are triggering a composite bot, not a simple bot.

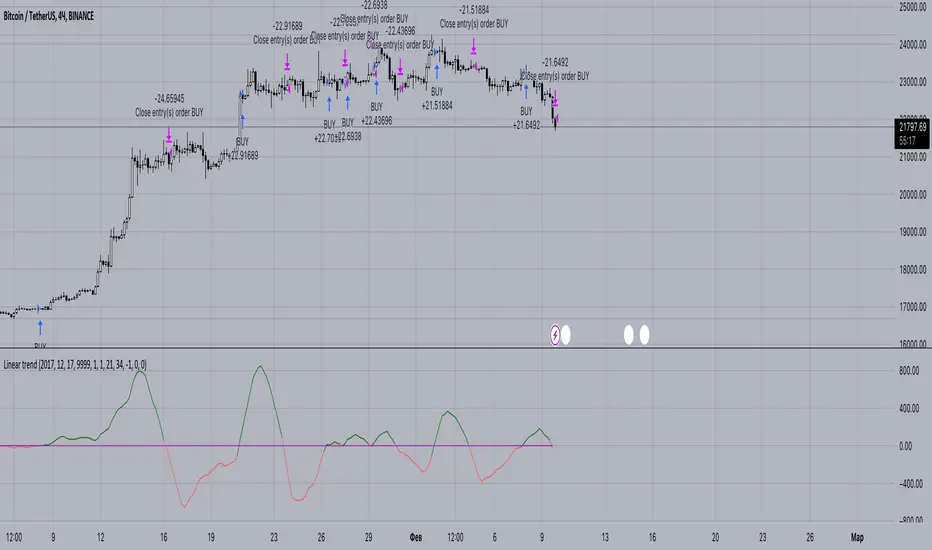
Linear trendThis oscillator based on linear regression . By subtracting the slower LMA from the faster LMA we can get a value, which we will further compare with zero. If the resulting difference is greater than 0, then we can assume that the trend is upward. Also by using offset we could increase the expected profit (focusing on backtest data).
You could get access for this script by the link below.
Donchian Channels Trending Breakout StrategyThis script looks for two entry signals. Long is when the previous breakout of the donchian channels was a low, price is above the input EMA, current price is equal or higher than the upper band and we're not in a position yet. Short is the other way around, so previous breakout of the donchian channels was a high, price is below the input EMA, current price is equal or lower than the lower band.
I haven't found a script that does take the previous highs and lows into consideration. Works for any markets in any conditions because the stop loss and profit targets are based on the upper and lower band of the donchian channels, which means the stop loss and profit targets move with the trend.
For more details see the script itself, I wrote a ton of comments.

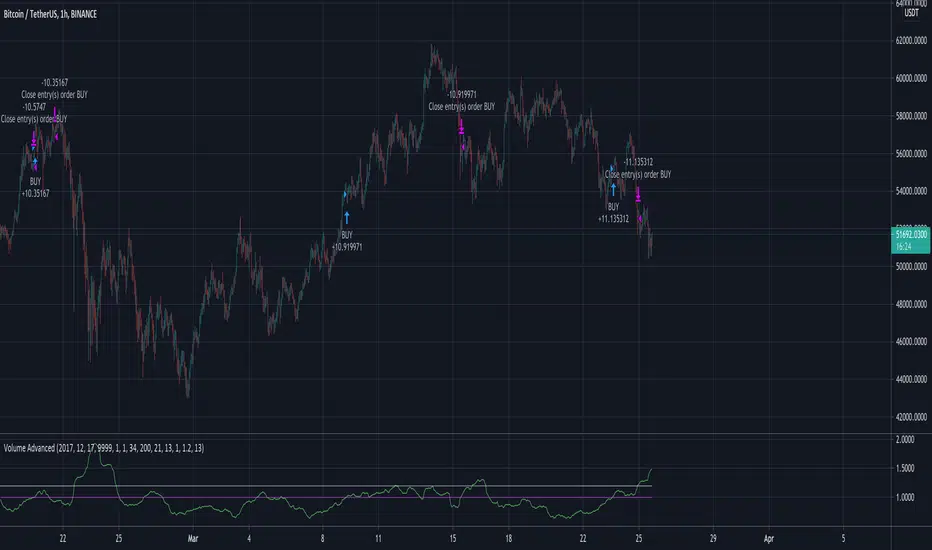
Volume AdvancedI have found out this script some time ago. In fact it is not my code (just have modified a little) and I don't know the author (couldn't find). So now I would like to share with the community, maybe somebody would have some idea how to make it better. The script itself is modified volatility oscillator (like ATR) based on volume, making a deal at the moment of price change. To recognize the current trend I have add simple function just to compare the current price with the N bars before, because sometimes in moments of high volatility there may be wrong signals.
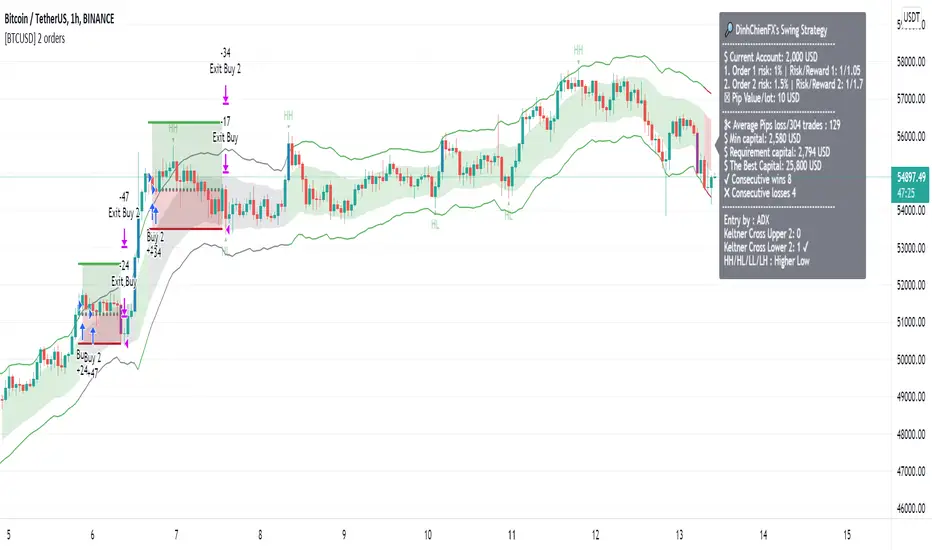
[BTCUSD] DinhChienFX [2 orders]* Historical statistics from 2018:
* Strategy will enter 2 orders, Order 2 will appear only when there is Order 1:
- Percent profitable of 1st order: 64.76%.
- Percent profitable of 2nd order: 49.86%.
- Average percent profitable: 57.31%.
- 14 consecutive wins.
- 4 consecutive losses.
Order 1: risk / reward ratio 1/1 used to determine if this rule is effective or not?
Order 2: Appears when there is order 1, Use take-profit and take-loss level of order 1 at Fibonacci 75%.
. * 1st Order conditions:
- Buy: When the ADX index cuts up to 45, check earlier if the closing price has cut up and is above the Upper 2 line, enter the Buy order.
- Sell: when the ADX indicator cuts up to 45, check before that if the closing price has cut down and is above Lower 2 then enter a Sell order.
* How to enter Order 2: When order 1 appears, there are always Stoploss and Takeprofit levels. Draw Fibonacci from take-profit and take-loss prices, Fibonacci retracement level = 75%
----------------
1. Trend identification:
- Channel Keltner:
... Uptrend: when the closing candlestick cuts up and is above the Keltner channel, the Upper Line 2
... Down trend: when the candle closes and falls above the Keltner Line Lower 2
2. Rules of entry:
- Channel Keltner:
... Buy: Candlestick closing price cuts up and above the Keltner Upper 2.
... Sell: The closing price of the candle cuts down and is lower than the Keltner Below 2.
ADX indicator:
... Buy: The ADX value crossed to 45 and the close of the candle was higher than Keltner Upper 2.
... Sell: ADX value cuts to 45 and the close of the candle is lower than Keltner Below 2.
3. Stoploss and Profit = atr (20) * 2.
Zeta Bank Nifty & Nifty50The Problems of Day Trading
Lot many indicators are made by thousands of traders all over the world, which give good or not so good signals.
Despite good signals, many times we end up in loss because we could not take entry or could not exit at appropriate time-point.
Sometimes even winning position also comes into loss if market takes back whatever you gained till a certain point.
Also, there are professional, office going people who can not take trades on their own during office-hours.
To solve all these problems, you need an automated strategy which could take trades, trail your stop loss up and exit when stop loss gets hit.
Strategy also lets you know how a certain formula performed over a period of time.
How this strategy works?
The strategy generates trades with 02 type of formulas:
1. It seeks price breaking away from support/resistance (up or down) which is calculated with the help of automatically detected pivot points.
2. It seeks reversal based upon RSI and Price Action.
If there are no open positions right now and a Buy/Sell signal comes, 1 lot is bought or sold.
This position is closed when either Stop Loss gets hit or when opposite signal comes.
What are other features of the strategy
1. You can set the session time when you want the strategy to take trades. For example, if you want to take trades only between 10:00 hrs and 14:00 hrs, that can be set in settings.
2. You can set up your own Stop Loss percentage, but the optimum value, as we found fit in backtesting, is set at 0.5%
3. There is a max. daily loss safeguard also which by default is set at 5%. It means if a series of losses happen during the day and your capital loss reaches this maximum loss value set by you, the strategy stops trading for that day.
4. There is an option to close all positions by End of Day. By default, this feature is disabled, but you can enable it if you don't want to carry forward your positions.
5. A label displayed at the last bar gives you cumulative profit or loss and daily profit/loss statistics.

RSI w MA StrategyThis strategy is mostly for cryptocurrencies, it applies a moving average to an rsi and trades based on the crossings. It includes the indicator that it is made from.

HiLo Extension This Strategy is finding high and low breaks of the day and enter into the trader based on RSI value and time value
1) This strategy is created for Indian Index like Nifty, Bank Nifty and so...
2) Trades are initiate only after 10:15 AM and before 3:10PM
3) High and Low of the day break will be check during the above time frame
4) RSI value will be check (RSI 50)
5) and trade will be initiate
6) Stop loss set as vwma 20...
Note: This Script will work fine in Index future chart not index spot chart...
This is just my idea only... Please back test yourselve, before using it..
Your comments are welcome!

MACD Crossover trend strategy, Long and ShortHey everybody,
This is my first strategy and script I wrote mostly myself. There's tons of content out there to learn how to code in Pinescript and it's exactly what I wanted and needed in this time of my life.
In any case, I made a rather simple MACD crossover strategy that only takes trades in the direction of both EMA and SMA (there are inputs to change the length of the moving averages and lots of other stuff too).
If the MACD line crosses upwards on the signal line, while above the zero point of the histogram and the price is above EMA + SMA , it's a long signal.
If the MACD line cosses downards on the signal line, while below zero on the histogram and the price is below EMA + SMA , it's a short signal.
There are a lot of default variables that make no sense, for basically any symbol you're going to be looking at. You're going to have to adjust the EMA , SMA , backtest date, take profit, stop loss and all that good stuff yourself to find decently profitable parameters.
I made this myself because I couldn't really find a strategy out there that allowed for so much customizing and it's an easy way to get started in Pinescript.
If you have any suggestions, tips or you see a flatout mistake in my code, please let me know. I'm still learning, everyday and I'm enjoying every second of it.

Bull Market Trend Following StrategyThis Bull Market Trend Following Strategy is perfect for long or short term Crypto or traditional market trading and investing.
It is based mainly on the ATR indicator and will therefore adapt to any market conditions and volatility.
It has a number of variable options to try and maximise gains, including stop loss and take profit points, and the ability to wait for pullbacks.
Please let me know if you find any optimal settings, and don't hesitate to ask any questions I'm always happy to help.
Thanks a lot.