Simple and efficient PSAR swing strategyThis is a strategy build inside tradingview, which I found it works great with swing/position trading.
It works based on parabolic sar indicator, when indicator is below the candle, is an uptrend and when its its above is a downtrend.
At the same time it's very nice, because it has a sort of stop loss which is dynamic, because it triggers when candle crosses with indicator, so you dont have to worry about stop loss or take profit .
The key here of course, is going to be the risk management, if you want to success with it, never trade more than 2% of you capital, and if you want you can always apply a rule inside the code to close all position if x % amount of equity was going down, although I recommend have patience and let the system do its job.
I recommend this strategy to be used with charts like 1 day or 1 week. If you need and want I can convert it to an indicator that uses alerts (although with strategy as well can be made to send alerts).
PS. When you add this strategy on chart, inside is has different versions, if you use first version(1), it uses the system I explain above. If you use the last one, its based on risk management when the stop loss is the difference between psar and the candle, but it still needs some adjustments to make.
Overall first one is atm much more profitable, but I believe that the version with risk management can be much better, but it need much more adjustments to make which I dont have the time at the moment for it.
Enjoy it .
Ketidakstabilan

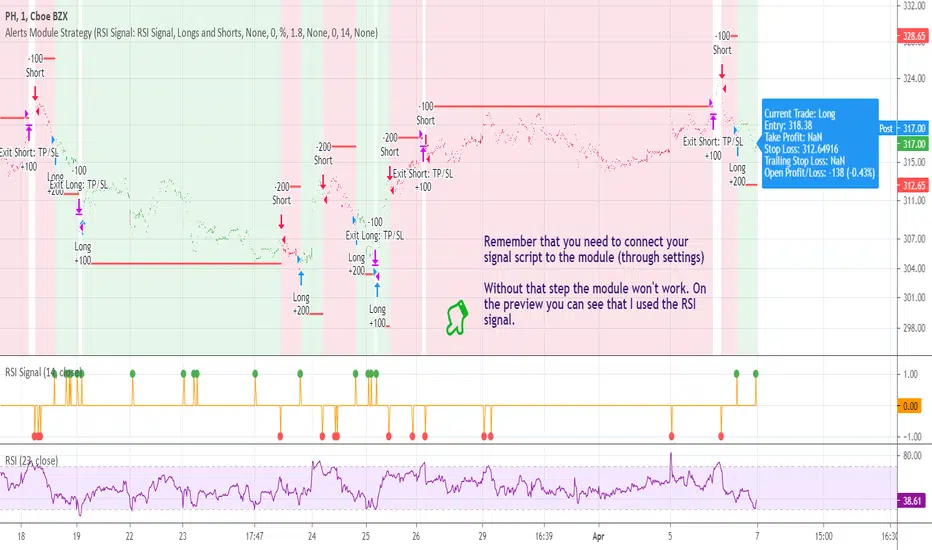
[STRATEGY] Buy/Sell/TP/SL/TSL Alerts ModuleA strategy version of the Buy/Sell/TP/SL/TSL Alerts Module .
It works the same way:
1) You choose a specific indicator and apply it to your chart
2) You create a special signal form of that indicator
3) You connect that form to the module
4) Bob's your uncle
If you have any questions don't hesitate to ask and contact me either via private messages on TradingView or via Telegram.
Thanks!
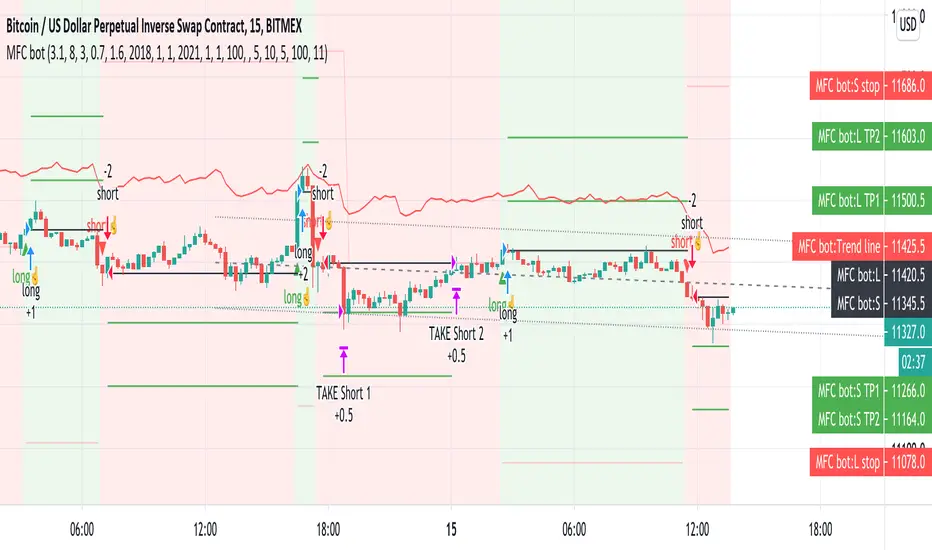
Money Flow Club Bot Strategy 1-15 min ALLENG:
Friends, in this script, there is a function that calls the closing of the candle by Heikin ASHI candles.
You can disable it in the indicator settings.
There is no redrawing of the indicator on regular candlesticks.
The indicator is easy to set up for any trading pairs and any exchanges.
It has an entry point and provides 2 take profit.
It also contains consolidation zones when the price moves for a short time in the range that is visible on the indicator.
In order to try the indicator write in your personal messages.
The strategy does not specify a condition for exiting the position when the first take is taken, the stop is moved to breakeven, so the chart in the strategy turned out to be torn.
RUS:
Друзья, в этом скрипте присутствует функция вызывающая закрытие свечи по свечам Хейкин Аши.
Её можно отключить в настройках индикатора. На обычных свечах перерисовка индикатора отсутствует.
Индикатор легко настроить на любые торговые пары и любые биржи. А нем есть точка входа и предусмотрены 2 тейк профита.
Так же в нем присутствуют зоны консолидации когда цена короткое время движется в диапазоне который виден на индикаторе.
Для того что бы попробовать индикатор напишите в личные сообщения.
В стратегии не прописано условие выхода из позиции когда первый тейк взят, то стоп переносится в безубыток, поэтому график в стратегии получился рваный.
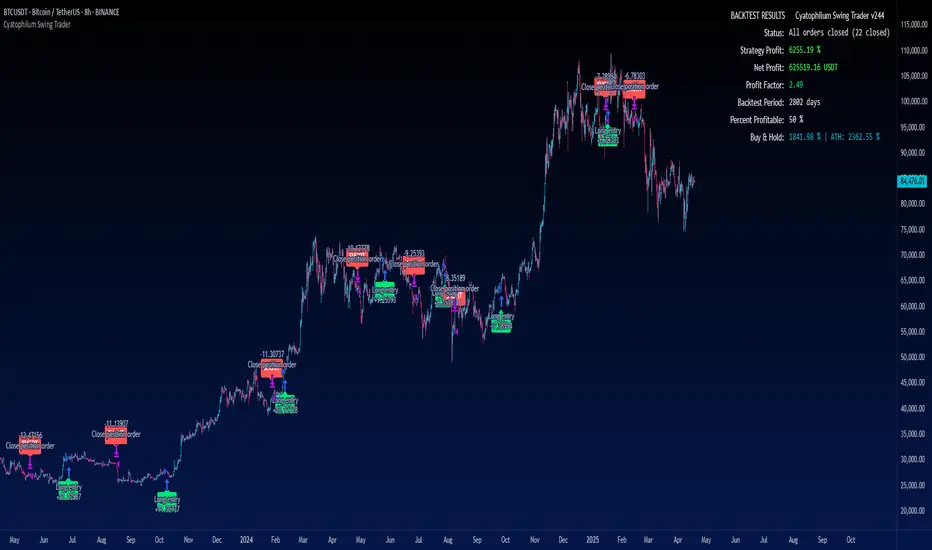
Cyatophilum Swing Trader [BACKTEST]This is an indicator for swing trading which allows you to build your own strategies, backtest and alert. This version is the backtest which allows to use the Strategy Tester. The alert version can be found in my profile scripts page.
The particularity of this indicator is that it contains several indicators, including a custom one, that you can choose in a drop down list, as well as a trailing stop loss and take profit system.
The current indicators are :
CYATO AI: a custom indicator inspired by Donchian Channels that will catch each big trend and important reversal points .
The indicator has two major "bands" or channels and two minor bands. The major bands are bigger and are always displayed.
When price reaches a major band, acting as a support/resistance, it will either bounce on it or break through it. This is how "tops" and "bottoms", and breakouts are caught.
The minor bands are used to catch smaller moves inside the major bands. A combination of volume, momentum and price action is used to calculate the signals.
Advantages of this indicator: it should catch top and bottoms better than other swing trade indicators.
Cons of this indicator: Some minor moves might be ignored. Sometimes the script will catch a fakeout due to the Bands design.
Best timeframes to use it : 2H~4H
Sample:
Other indicators available:
SARMA: A combination of Parabolic Stop and Reverse and Exponential Moving Average (20 and 40) .
SAR: Regular Parabolic Stop and Reverse .
QQE: An indicator based on Quantitative Qualitative Estimation .
SUPERTREND: A reversal indicator based on Average True Range .
CHANNELS: The classic Donchian Channels .
More indicators might be added in the future.
About the signals: each entry (long & short) is calculated at bar close to avoid repainting. Exits (SL & TP) can either be intra-bar or at bar close using the Exit alert type parameter.
STOP LOSS SYSTEM
The base indicators listed above can be used with or without TP/SL.
TP and SL can be both turned on and off and configured for both directions.
The system can be configured with 3 parameters as follows:
Stop Loss Base % Price: Starting Value for LONG/SHORT stop loss
Trailing Stop % Price to Trigger First parameter related to the trailing stop loss. Percentage of price movement in the right direction required to make the stop loss line move.
Trailing Stop % Price Movement: Second parameter related to the trailing stop loss. Percentage for the stop loss trailing movement.
Another option is the "Reverse order on Stop Loss". Use this if you want the strategy to trigger a reverse order when a stop loss is hit.
TAKE PROFIT SYSTEM
The system can be configured with 2 parameters as follows:
Take Profit %: Take profit value in percentage of price.
Trailing Profit Deviation %: Percent deviation for the trailing take profit.
Combining indicators and Take Profit/Stop Loss
One thing to note is that if a reversal signal triggers during a trade, the trade will be closed before SL or TP is reached.
Indeed, the base indicators are reversal indicators, they will trigger long/short signals to follow the trend.
It is possible to use a takeprofit without stop loss, like in this example, knowing that the signal will reverse if the trade goes badly.
The base indicators settings can be changed in the "Advanced Parameters" section.
Configuration used for this snapshot:
BACKTEST SETTINGS
· Initial Capital: 10 000 $
· Order Size: 10% equity (to avoid compounding effect)
· Commission : 0.1% per order (total commission paid: 244.41 €)
· Slippage: 5 ticks
Oldest trade: 2014-04-01
Backtest Period: From 2014-04-01 to 2020-09-04
Use the link below to obtain access to this indicator.
NZDJPY signal [DinhChienFX Corner] Ver 1.0The right screen is never predicting before. Just a the best result at the history for confident to using for Trade.
------------------------
Risk: 1%.
1. The Long signal is calculate by the Close of candle crossing up The Keltner Channel Upper.
2. The Short {Sell] signal is calculate by the Close of candle crossing down The Keltner Channel Lower.
3. Reset the Up/Down confirm at Entry.
4. Don''t entry when occurs the Reversal Candle (over 80% the Heigh of Keltner Channel).
a. Not filter the Candel is over 80%.
b. Filter the Candel is over 80% for Not Entry.
5. Stoploss and Take Profit is calculated by Plus or Minus from the Price Entry.
6. Report the result at Backtest:
a. The Long-term result:
b. The Mid-tern result (every year):
- From 1/1/2017 to 1/1/2018:
- From 1/1/2018 to 1/1/2019:
- From 1/1/2019 to 1/1/2020:
c. The Short-term result:
- From 1/1/2020 to 5 Sep 2020
---------------------------------------
The right screen is never predicting before. Just a the best result at the history for confident to using for Trade.
Thanks for watching .

EURUSD signal [DinhChienFX Corner] Ver 3.0* Signals are tested successfully for 3.5 years with a steady win rate year on year until now.
Risk: 1%.
* Backtest time: 3.5 years / Premium, varies between currency pairs (Cryto default backtest time is shorter since the market is open both Saturday and Sunday: about 2 years).
The price rule of EURUSD in 20,000 past H1 candles past:
- Upterm (Long): Buy
+ When the price crossing up (Crossover) the Upper line gives 1 point.
- Downterm (Short): Sell
+ When the price crossing down (Crossunder) the Lower line gives 1 point.
- 2 or more points (> = 2), the entry conditions are met
- The entry point for the highest winning rate: when the price adjusts to the Upper / Lower line, the order price is at the closing price of the adjustment candle.
- When the above conditions are met, the Indicator shows a Buy / Sell signal according to the trend.
-----------------------------------
- Maximum risk / reward winning ratio: 1 / 1.05
- Stoploss: Calculated from the entry point + - actual fluctuation with the formula ATR (20) * risk ratio (risk).
- Profit: Calculated from the entry point + - actual fluctuation by the formula ATR (20) * reward ratio (reward).
- Profit: So the product has a stable profit of over 30% / year.
- Should backtest 3 Years (long term), every Year (medium term) and quarterly or 6 months (short term). If each year the success rate is always over 50%, it can be used for real trade.

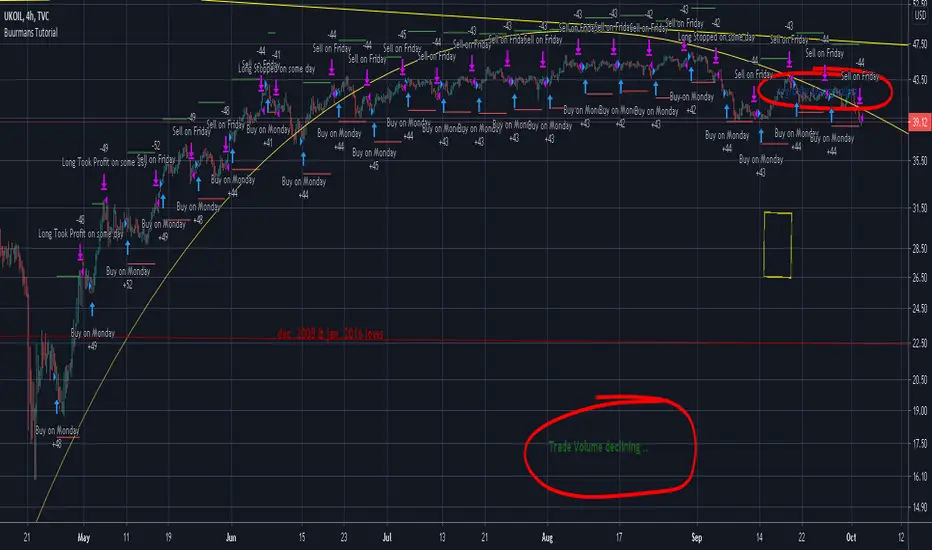
Buurmans TutorialA little Script as part of a Tutorial using Monday as entries and Friday as exits/shorts, with option to Long-Only and a rudimentary Stoploss.
outlined in detail here
can't find a better fitting Category, so bear with me
PpSignal KC + CFB V2This strategy works with Keltner Channel (KC) and CFB (composite fractal behavior).
CFB will show us the trend and KC the volatility.
When CFB is green (the trend is bullish) and the price (price breakout KC) breaks the upper band, it will give us a buy.
When CFB is red (Bearish Trend) and the price (price breakout KC) breaks the lower band, it will sell us.
You should look for the best combination between the KC values and the cfb (optimization) values according to the asset to be traded.

Trend Indicator with BUY SELL signalsThe Script can be used to identify the main trend and take BUY/SELL decisions in the lower time frames.
The tool can be applied as follows
1) Apply the tool your favorite chart
2) Select the main trend.
3) Go to lower time frames to check the BUY/SELL signals. Example: If the selected main trend is 4 hrs then go to time frames below 4 hrs to find the entry and exit positions.
Feel free to reach out to me if you need any further information

ATR STRATEGYHere is ATR strategy
Here you will identifie 2 ATR lines
Here is the Intraday Strategy for Indian stockmarket (NSE)
one is higher timeframe and second is for current timeframe chart
Here is the details of all property
////////////// Resolution /////////////
For higher timeframe ATR to compare with current timeframe ATR
Resolution is for higher timeframe ATR
/////////////// MARKET TRADING TIME ////////////////
for intraday time session here
if you want to trade after 10 am than you can modified that and buy sell will start from that
/////////////// MARKET CLOSE TIME //////////////////
for end of intraday trading time put square off intraday position
here timesession selected for close active position
/////////////// MAX LOSS INTRADAY /////////////////
intraday maximum loss
limit your loss in intraday
/////////////// OPTIONAL --- FOR USE STOP-LOSS IN % ---- ///////////////////////
here if you want to fix stop-loss from active position
here input value calculate in percentage(%)
/////////////// OPTIONAL --- FOR USE TARGET IN % ---- ///////////////////////
here if you want to fix target from active position
here input value calculate in percentage(%)
/////////////// TRAIL LONG LOSS % ---- ///////////////////////
for Active Long position put trailing stop-loss
here input value calculate in percentage(%)
/////////////// TRAIL SHORT LOSS % ---- ///////////////////////
for Active Short position put trailing stop-loss
here input value calculate in percentage(%)
///////////////------ Share Qty ---- ///////////////////////
Here your qty to trade
///////////////------ Book Qty ---- ///////////////////////
Here your trading position size you want to book half or full that you will book
///////////////------ ATR ---- ///////////////////////
Here your intraday ATR value that you can change and set as per your requirement
///////////////------ Start Year ---- ///////////////////////
Here strategy result required year from you can set
///////////////------ End Year ---- ///////////////////////
Here strategy result required End year from you can set
///////////////------ Start Month ---- ///////////////////////
Here strategy result required start month from you can set

Bollinger Bands Breakout StrategyBollinger Bands Breakout Strategy is the strategy version of Bollinger Bands Filter study version, which can be found under my scripts page. The strategy goes long when price closes above the upper band and goes short signal when price closes below the lower band.
Bollinger Bands is a classic indicator that uses a simple moving average of 20 periods, along with plots of upper and lower bands that are 2 standard deviations away from the basis line. These bands help visualize price volatility and trend based on where the price is, in relation to the bands.
The strategy doesn't take into account any other parameters such as Volume / RSI / Fundamentals etc, so user must use discretion based on confirmations from another indicator or based on fundamentals. The strategy results are based on purely long and short trades and doesn't take into account any user defined targets or stop losses.
The strategy works great when the price closes above/below upper/lower bands with continuation on next bar. It is definitely useful to have this strategy or the Bollinger Bands filter along with other indicators to get early glimpse of breach/fail of bands on candle close during BB squeeze or based on volatility .
This can be used on Heikin Ashi candles for spotting trends, but HA candles are not recommended for trade entries as they don't reflect true price of the asset.
The strategy settings default is 55 SMA and 1 standard deviation for Bollinger Bands filter, but these can be changed from settings.
It is definitely worth reading the 22 rules of Bollinger Bands written by John Bollinger if interested in trading Bollinger Bands successfully.

Primus V1 - BybitHey everyone,
The current version its a scalping strategy for Bybit but for those that prefers swing trading algo I can do a different version as well for different exchanges.
This is the first version on my algo Primus, expect updates on the months to come.
BlueFX Strategy GOLD M15We are releasing this separate script file for trading Gold on the M15 time frame using our strategy. This can now run independently from the main file instead of changing parameters and saving as a template - thus making the use of these specific settings even easier for our traders.
You can see the back testing profitability shown below, although you can not use back testing to predict the future, both the volume of trades, net profit, win rate and draw down demonstrate a solid foundation and data to move forward from.
The strategy itself is explained in the 'Blue FX Strategy' but see below too for more info.
Our strategy will help you identify the current trend in the markets and highlight when this is changing. The strategy itself is based upon 4 indicators lining up in total confluence to increase the probability of the trade being a success.
Absolutely no technical analysis is needed to trade this - this is a trading tool and has solid back testing results trading in isolation - although you may also use to support your own trading - the choice is yours.
When a trade is valid - a Buy or Sell label will appear with the Entry price, SL and multiple TP's shown on the chart.
IMPORTANT note, the test results show and confirm that the most profitable exit strategy with these Gold settings is 'FT&SL' this means we enter the trade with a Stop Loss (SL) and simply hold and follow the trend (Follow Trend = FT) until a reverse signal is printed.
In our supporting video (see related ideas) you can see the impact of changing this target between multiple TP's and the net effect on both win rate and overall net profitability.
The Lot size will also be displayed and this is based on the risk parameters you have set personally in the calculation section.
What is a Trading View Script?
A script is like an indicator but better, we can verify the success of our strategy by using Trading Views strategy tester function. As shown below and on the chart - you can see the 'Buy' and 'Close Buy' on the chart, supported by a live trading log showing you the entry, entry price date, volume and closing price.
This is a great function for numerous reasons; firstly, you know you are using a strategy that has provided a positive expectancy in back testing, secondly you can use this as a trading journal to support your trading too. This in itself can help you with your trading psychology - letting winning trades run is a prime example of this. Take confidence in the statistics and performance over time.
Ultimately, we believe we have saved YOU the need to firstly, find an edge and a strategy - and all of the time it takes to BACKTEST a strategy - to then find it may or may not work - and then you start again!
Disclaimer alert; Please remember past performance is exactly that - how our strategy performed over those dates tested, it is not obviously a guarantee of future performance.
Interested in access or more information?
No problem, simply drop us a DM via trading view for access information.
Thank you for reading.
Darren

QuantNomad - Heikin-Ashi PSAR StrategyContinue experimenting with different combinations of strategies.
Here is the PSAR Strategy calculated based on HA candles. HA is already calculated inside the script, do not apply it to HA candles.
Strategy is calculated based on 25% equity invested with 0.1% commission.
####################
Disclaimer
Please remember that past performance may not be indicative of future results.
Due to various factors, including changing market conditions, the strategy may no longer perform as good as in historical backtesting.
This post and the script don’t provide any financial advice.

Varprice4 - Price is the real KingWhen you use any indicators you suffer of lagging and possibile mistakes.
In this case, higher movements of the (daily) prices (long green candle) are a signal that market is appreciating your stock. The variation of a single candle is compared to standard deviation of the stock.
Besides normal money management (on fixed percentages), we have kept the possibily of exiting the position before stop loss adding a multiplier considering that red (or black) candles are normally wider than green (white) ones.

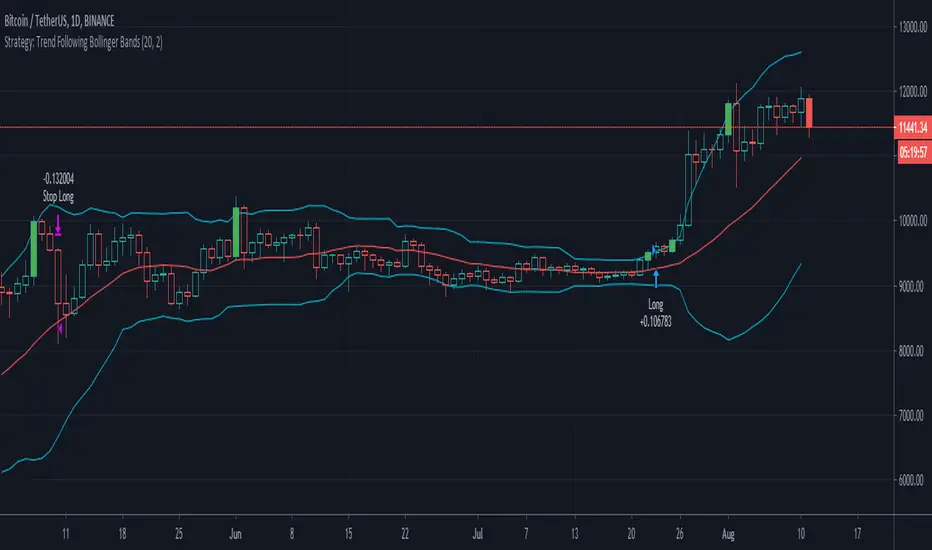
Setup Trend Following Bollinger Bands - ValenteBuy when the candle closes above upper BB
Sell when the candle closes bellow lower BB
Stop always on base line