PRO Investing - Quant AlphaCentauri D |XLF|PRO Investing - Quant AlphaCentauri D |XLF|
1. Summary and Core Concept
This is a quantitative backtesting strategy engineered specifically for the Financial Select Sector SPDR Fund (XLF) on the Daily (1D) timeframe. The name "AlphaCentauri" reflects its goal: to seek alpha by identifying statistically significant opportunities through rigorous time series analysis.
The strategy's core principle is to move beyond conventional technical indicators and instead analyze the underlying structure and character of price data. It is designed to methodically identify conditions that have historically preceded sustained directional trends in the financial sector.
2. The Analytical Process: How It Works
This strategy employs a multi-stage quantitative process to filter for high-probability setups. It is a "mashup" of statistical concepts applied to price action.
Structural Pattern Recognition: The engine's primary function is to analyze the historical price series of XLF to identify specific, recurring structural patterns. It examines price geometry and cyclical behavior to find formations that often act as the foundation for a new, emerging trend.
Signal Execution: A signal to enter a trade is only generated when the findings from both the structural analysis and the validation stages are in agreement. This disciplined, multi-layered approach ensures the strategy remains flat during periods of high uncertainty and only engages when its quantitative criteria are fully met.
3. How to Use This Strategy
Timeframe: This strategy has been designed, tested, and optimized exclusively for the Daily (1D) timeframe on the XLF ticker. Its logic is not intended for other timeframes or assets and may produce unreliable results if used differently.
On-Chart Signals: The strategy's operation is transparent. It plots all historical buy and sell entries, along with their corresponding exits, directly on the chart for easy performance review and analysis.
4. Risk Management: The Strategy's Foundation
This strategy is built upon a foundation of strict, non-negotiable risk management, which is reflected in its code and backtesting parameters. This design complies with TradingView's guidelines for publishing realistic and responsible strategies.
Dynamic Stop-Loss and Position Sizing: A stop-loss is dynamically calculated for each trade based on recent market volatility. The strategy then automatically adjusts the position size for that trade to target a defined risk percentage. In cases of extreme market volatility, the maximum potential loss on a single trade may approach, but is designed not to exceed, 5% of total account equity. Under normal market conditions, the risk for most trades will be below this maximum threshold.
Realistic Backtesting Parameters:
Initial Capital: The backtest defaults to an initial capital of $100,000.
Commission: A realistic fee of $5.00 per order is included to simulate broker costs.
5. Disclaimer
This strategy is an educational tool provided for informational and research purposes. It is not financial advice. All trading carries a high level of risk, and past performance is not a guarantee of future results. You are solely responsible for your own trading decisions and risk management. Always conduct your own due diligence before deploying any trading strategy in a live account.
Ketidakstabilan

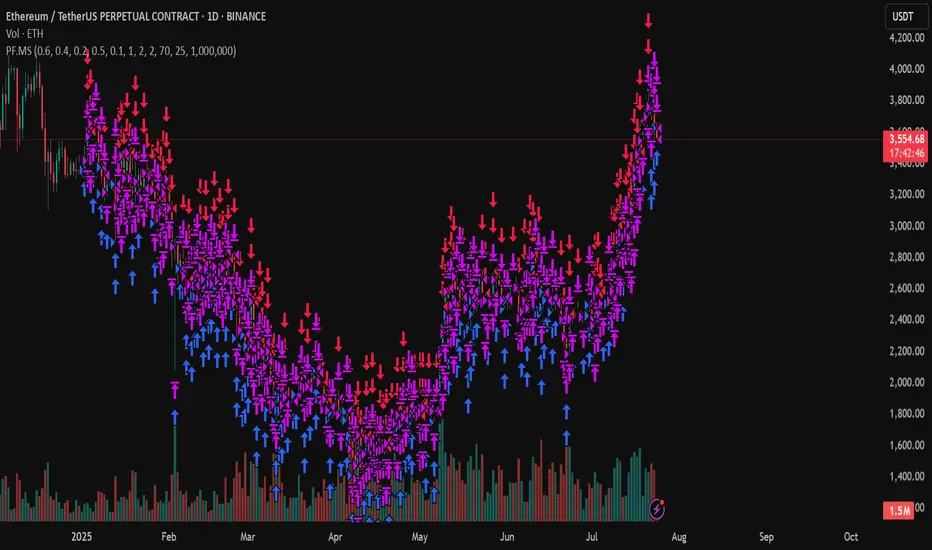
PF.MSThe Pressure & Flow Momentum Strategy (PF.MS) detects market pressure buildup through advanced candlestick analysis and captures momentum flow when conditions align, providing accurate buy and sell signals across cryptocurrencies and stocks—but even sophisticated strategies can be wrong when markets turn brutal without warning. The system reads real-time pressure dynamics (buying vs selling forces, wick patterns, volatility conditions) to identify when smart money is positioning, then captures the resulting momentum flow with precise entry and exit timing. While highly accurate at detecting pressure shifts and momentum changes, the strategy can still face losses during sudden news events or when market sentiment overrides technical patterns. The PF.MS combines intelligent pressure detection with momentum capture, trailing profit protection and strict stop losses
Eliora Gold 1min (Heikin Ashi)Eliora -focused trading strategy designed for anything on the 1-minute timeframe using Heikin Ashi candles. This mode combines advanced market logic with structured risk management to deliver smooth, disciplined trade execution.
Key Features:
✅ Trend Confirmation – Aligns with dominant market direction for higher accuracy.
✅ ATR-Based Volatility Filter – Avoids high-risk conditions and chaotic price action.
✅ Candle Strength Logic – Filters weak setups, focusing on strong momentum.
✅ Balanced Risk/Reward – Calculates stop-loss and take-profit dynamically for consistent results.
✅ Cooldown & Overtrade Protection – Limits frequency to maintain trade quality.
This version of Eliora is built for scalpers and intraday traders seeking high-probability entries with graceful exits.

VoVix DEVMA🌌 VoVix DEVMA: A Deep Dive into Second-Order Volatility Dynamics
Welcome to VoVix+, a sophisticated trading framework that transcends traditional price analysis. This is not merely another indicator; it is a complete system designed to dissect and interpret the very fabric of market volatility. VoVix+ operates on the principle that the most powerful signals are not found in price alone, but in the behavior of volatility itself. It analyzes the rate of change, the momentum, and the structure of market volatility to identify periods of expansion and contraction, providing a unique edge in anticipating major market moves.
This document will serve as your comprehensive guide, breaking down every mathematical component, every user input, and every visual element to empower you with a profound understanding of how to harness its capabilities.
🔬 THEORETICAL FOUNDATION: THE MATHEMATICS OF MARKET DYNAMICS
VoVix+ is built upon a multi-layered mathematical engine designed to measure what we call "second-order volatility." While standard indicators analyze price, and first-order volatility indicators (like ATR) analyze the range of price, VoVix+ analyzes the dynamics of the volatility itself. This provides insight into the market's underlying state of stability or chaos.
1. The VoVix Score: Measuring Volatility Thrust
The core of the system begins with the VoVix Score. This is a normalized measure of volatility acceleration or deceleration.
Mathematical Formula:
VoVix Score = (ATR(fast) - ATR(slow)) / (StDev(ATR(fast)) + ε)
Where:
ATR(fast) is the Average True Range over a short period, representing current, immediate volatility.
ATR(slow) is the Average True Range over a longer period, representing the baseline or established volatility.
StDev(ATR(fast)) is the Standard Deviation of the fast ATR, which measures the "noisiness" or consistency of recent volatility.
ε (epsilon) is a very small number to prevent division by zero.
Market Implementation:
Positive Score (Expansion): When the fast ATR is significantly higher than the slow ATR, it indicates a rapid increase in volatility. The market is "stretching" or expanding.
Negative Score (Contraction): When the fast ATR falls below the slow ATR, it indicates a decrease in volatility. The market is "coiling" or contracting.
Normalization: By dividing by the standard deviation, we normalize the score. This turns it into a standardized measure, allowing us to compare volatility thrust across different market conditions and timeframes. A score of 2.0 in a quiet market means the same, relatively, as a score of 2.0 in a volatile market.
2. Deviation Analysis (DEV): Gauging Volatility's Own Volatility
The script then takes the analysis a step further. It calculates the standard deviation of the VoVix Score itself.
Mathematical Formula:
DEV = StDev(VoVix Score, lookback_period)
Market Implementation:
This DEV value represents the magnitude of chaos or stability in the market's volatility dynamics. A high DEV value means the volatility thrust is erratic and unpredictable. A low DEV value suggests the change in volatility is smooth and directional.
3. The DEVMA Crossover: Identifying Regime Shifts
This is the primary signal generator. We take two moving averages of the DEV value.
Mathematical Formula:
fastDEVMA = SMA(DEV, fast_period)
slowDEVMA = SMA(DEV, slow_period)
The Core Signal:
The strategy triggers on the crossover and crossunder of these two DEVMA lines. This is a profound concept: we are not looking at a moving average of price or even of volatility, but a moving average of the standard deviation of the normalized rate of change of volatility.
Bullish Crossover (fastDEVMA > slowDEVMA): This signals that the short-term measure of volatility's chaos is increasing relative to the long-term measure. This often precedes a significant market expansion and is interpreted as a bullish volatility regime.
Bearish Crossunder (fastDEVMA < slowDEVMA): This signals that the short-term measure of volatility's chaos is decreasing. The market is settling down or contracting, often leading to trending moves or range consolidation.
⚙️ INPUTS MENU: CONFIGURING YOUR ANALYSIS ENGINE
Every input has been meticulously designed to give you full control over the strategy's behavior. Understanding these settings is key to adapting VoVix+ to your specific instrument, timeframe, and trading style.
🌀 VoVix DEVMA Configuration
🧬 Deviation Lookback: This sets the lookback period for calculating the DEV value. It defines the window for measuring the stability of the VoVix Score. A shorter value makes the system highly reactive to recent changes in volatility's character, ideal for scalping. A longer value provides a smoother, more stable reading, better for identifying major, long-term regime shifts.
⚡ Fast VoVix Length: This is the lookback period for the fastDEVMA. It represents the short-term trend of volatility's chaos. A smaller number will result in a faster, more sensitive signal line that reacts quickly to market shifts.
🐌 Slow VoVix Length: This is the lookback period for the slowDEVMA. It represents the long-term, baseline trend of volatility's chaos. A larger number creates a more stable, slower-moving anchor against which the fast line is compared.
How to Optimize: The relationship between the Fast and Slow lengths is crucial. A wider gap (e.g., 20 and 60) will result in fewer, but potentially more significant, signals. A narrower gap (e.g., 25 and 40) will generate more frequent signals, suitable for more active trading styles.
🧠 Adaptive Intelligence
🧠 Enable Adaptive Features: When enabled, this activates the strategy's performance tracking module. The script will analyze the outcome of its last 50 trades to calculate a dynamic win rate.
⏰ Adaptive Time-Based Exit: If Enable Adaptive Features is on, this allows the strategy to adjust its Maximum Bars in Trade setting based on performance. It learns from the average duration of winning trades. If winning trades tend to be short, it may shorten the time exit to lock in profits. If winners tend to run, it will extend the time exit, allowing trades more room to develop. This helps prevent the strategy from cutting winning trades short or holding losing trades for too long.
⚡ Intelligent Execution
📊 Trade Quantity: A straightforward input that defines the number of contracts or shares for each trade. This is a fixed value for consistent position sizing.
🛡️ Smart Stop Loss: Enables the dynamic stop-loss mechanism.
🎯 Stop Loss ATR Multiplier: Determines the distance of the stop loss from the entry price, calculated as a multiple of the current 14-period ATR. A higher multiplier gives the trade more room to breathe but increases risk per trade. A lower multiplier creates a tighter stop, reducing risk but increasing the chance of being stopped out by normal market noise.
💰 Take Profit ATR Multiplier: Sets the take profit target, also as a multiple of the ATR. A common practice is to set this higher than the Stop Loss multiplier (e.g., a 2:1 or 3:1 reward-to-risk ratio).
🏃 Use Trailing Stop: This is a powerful feature for trend-following. When enabled, instead of a fixed stop loss, the stop will trail behind the price as the trade moves into profit, helping to lock in gains while letting winners run.
🎯 Trail Points & 📏 Trail Offset ATR Multipliers: These control the trailing stop's behavior. Trail Points defines how much profit is needed before the trail activates. Trail Offset defines how far the stop will trail behind the current price. Both are based on ATR, making them fully adaptive to market volatility.
⏰ Maximum Bars in Trade: This is a time-based stop. It forces an exit if a trade has been open for a specified number of bars, preventing positions from being held indefinitely in stagnant markets.
⏰ Session Management
These inputs allow you to confine the strategy's trading activity to specific market hours, which is crucial for day trading instruments that have defined high-volume sessions (e.g., stock market open).
🎨 Visual Effects & Dashboard
These toggles give you complete control over the on-chart visuals and the dashboard. You can disable any element to declutter your chart or focus only on the information that matters most to you.
📊 THE DASHBOARD: YOUR AT-A-GLANCE COMMAND CENTER
The dashboard centralizes all critical information into one compact, easy-to-read panel. It provides a real-time summary of the market state and strategy performance.
🎯 VOVIX ANALYSIS
Fast & Slow: Displays the current numerical values of the fastDEVMA and slowDEVMA. The color indicates their direction: green for rising, red for falling. This lets you see the underlying momentum of each line.
Regime: This is your most important environmental cue. It tells you the market's current state based on the DEVMA relationship. 🚀 EXPANSION (Green) signifies a bullish volatility regime where explosive moves are more likely. ⚛️ CONTRACTION (Purple) signifies a bearish volatility regime, where the market may be consolidating or entering a smoother trend.
Quality: Measures the strength of the last signal based on the magnitude of the DEVMA difference. An ELITE or STRONG signal indicates a high-conviction setup where the crossover had significant force.
PERFORMANCE
Win Rate & Trades: Displays the historical win rate of the strategy from the backtest, along with the total number of closed trades. This provides immediate feedback on the strategy's historical effectiveness on the current chart.
EXECUTION
Trade Qty: Shows your configured position size per trade.
Session: Indicates whether trading is currently OPEN (allowed) or CLOSED based on your session management settings.
POSITION
Position & PnL: Displays your current position (LONG, SHORT, or FLAT) and the real-time Profit or Loss of the open trade.
🧠 ADAPTIVE STATUS
Stop/Profit Mult: In this simplified version, these are placeholders. The primary adaptive feature currently modifies the time-based exit, which is reflected in how long trades are held on the chart.
🎨 THE VISUAL UNIVERSE: DECIPHERING MARKET GEOMETRY
The visuals are not mere decorations; they are geometric representations of the underlying mathematical concepts, designed to give you an intuitive feel for the market's state.
The Core Lines:
FastDEVMA (Green/Maroon Line): The primary signal line. Green when rising, indicating an increase in short-term volatility chaos. Maroon when falling.
SlowDEVMA (Aqua/Orange Line): The baseline. Aqua when rising, indicating a long-term increase in volatility chaos. Orange when falling.
🌊 Morphism Flow (Flowing Lines with Circles):
What it represents: This visualizes the momentum and strength of the fastDEVMA. The width and intensity of the "beam" are proportional to the signal strength.
Interpretation: A thick, steep, and vibrant flow indicates powerful, committed momentum in the current volatility regime. The floating '●' particles represent kinetic energy; more particles suggest stronger underlying force.
📐 Homotopy Paths (Layered Transparent Boxes):
What it represents: These layered boxes are centered between the two DEVMA lines. Their height is determined by the DEV value.
Interpretation: This visualizes the overall "volatility of volatility." Wider boxes indicate a chaotic, unpredictable market. Narrower boxes suggest a more stable, predictable environment.
🧠 Consciousness Field (The Grid):
What it represents: This grid provides a historical lookback at the DEV range.
Interpretation: It maps the recent "consciousness" or character of the market's volatility. A consistently wide grid suggests a prolonged period of chaos, while a narrowing grid can signal a transition to a more stable state.
📏 Functorial Levels (Projected Horizontal Lines):
What it represents: These lines extend from the current fastDEVMA and slowDEVMA values into the future.
Interpretation: Think of these as dynamic support and resistance levels for the volatility structure itself. A crossover becomes more significant if it breaks cleanly through a prior established level.
🌊 Flow Boxes (Spaced Out Boxes):
What it represents: These are compact visual footprints of the current regime, colored green for Expansion and red for Contraction.
Interpretation: They provide a quick, at-a-glance confirmation of the dominant volatility flow, reinforcing the background color.
Background Color:
This provides an immediate, unmistakable indication of the current volatility regime. Light Green for Expansion and Light Aqua/Blue for Contraction, allowing you to assess the market environment in a split second.
📊 BACKTESTING PERFORMANCE REVIEW & ANALYSIS
The following is a factual, transparent review of a backtest conducted using the strategy's default settings on a specific instrument and timeframe. This information is presented for educational purposes to demonstrate how the strategy's mechanics performed over a historical period. It is crucial to understand that these results are historical, apply only to the specific conditions of this test, and are not a guarantee or promise of future performance. Market conditions are dynamic and constantly change.
Test Parameters & Conditions
To ensure the backtest reflects a degree of real-world conditions, the following parameters were used. The goal is to provide a transparent baseline, not an over-optimized or unrealistic scenario.
Instrument: CME E-mini Nasdaq 100 Futures (NQ1!)
Timeframe: 5-Minute Chart
Backtesting Range: March 24, 2024, to July 09, 2024
Initial Capital: $100,000
Commission: $0.62 per contract (A realistic cost for futures trading).
Slippage: 3 ticks per trade (A conservative setting to account for potential price discrepancies between order placement and execution).
Trade Size: 1 contract per trade.
Performance Overview (Historical Data)
The test period generated 465 total trades , providing a statistically significant sample size for analysis, which is well above the recommended minimum of 100 trades for a strategy evaluation.
Profit Factor: The historical Profit Factor was 2.663 . This metric represents the gross profit divided by the gross loss. In this test, it indicates that for every dollar lost, $2.663 was gained.
Percent Profitable: Across all 465 trades, the strategy had a historical win rate of 84.09% . While a high figure, this is a historical artifact of this specific data set and settings, and should not be the sole basis for future expectations.
Risk & Trade Characteristics
Beyond the headline numbers, the following metrics provide deeper insight into the strategy's historical behavior.
Sortino Ratio (Downside Risk): The Sortino Ratio was 6.828 . Unlike the Sharpe Ratio, this metric only measures the volatility of negative returns. A higher value, such as this one, suggests that during this test period, the strategy was highly efficient at managing downside volatility and large losing trades relative to the profits it generated.
Average Trade Duration: A critical characteristic to understand is the strategy's holding period. With an average of only 2 bars per trade , this configuration operates as a very short-term, or scalping-style, system. Winning trades averaged 2 bars, while losing trades averaged 4 bars. This indicates the strategy's logic is designed to capture quick, high-probability moves and exit rapidly, either at a profit target or a stop loss.
Conclusion and Final Disclaimer
This backtest demonstrates one specific application of the VoVix+ framework. It highlights the strategy's behavior as a short-term system that, in this historical test on NQ1!, exhibited a high win rate and effective management of downside risk. Users are strongly encouraged to conduct their own backtests on different instruments, timeframes, and date ranges to understand how the strategy adapts to varying market structures. Past performance is not indicative of future results, and all trading involves significant risk.
🔧 THE DEVELOPMENT PHILOSOPHY: FROM VOLATILITY TO CLARITY
The journey to create VoVix+ began with a simple question: "What drives major market moves?" The answer is often not a change in price direction, but a fundamental shift in market volatility. Standard indicators are reactive to price. We wanted to create a system that was predictive of market state. VoVix+ was designed to go one level deeper—to analyze the behavior, character, and momentum of volatility itself.
The challenge was twofold. First, to create a robust mathematical model to quantify these abstract concepts. This led to the multi-layered analysis of ATR differentials and standard deviations. Second, to make this complex data intuitive and actionable. This drove the creation of the "Visual Universe," where abstract mathematical values are translated into geometric shapes, flows, and fields. The adaptive system was intentionally kept simple and transparent, focusing on a single, impactful parameter (time-based exits) to provide performance feedback without becoming an inscrutable "black box." The result is a tool that is both profoundly deep in its analysis and remarkably clear in its presentation.
⚠️ RISK DISCLAIMER AND BEST PRACTICES
VoVix+ is an advanced analytical tool, not a guarantee of future profits. All financial markets carry inherent risk. The backtesting results shown by the strategy are historical and do not guarantee future performance. This strategy incorporates realistic commission and slippage settings by default, but market conditions can vary. Always practice sound risk management, use position sizes appropriate for your account equity, and never risk more than you can afford to lose. It is recommended to use this strategy as part of a comprehensive trading plan. This was developed specifically for Futures
"The prevailing wisdom is that markets are always right. I take the opposite view. I assume that markets are always wrong. Even if my assumption is occasionally wrong, I use it as a working hypothesis."
— George Soros
— Dskyz, Trade with insight. Trade with anticipation.

RSI-Adaptive T3 + Squeeze Momentum Strategy✅ Strategy Guide: RSI-Adaptive T3 + Squeeze Momentum Strategy
📌 Overview
The RSI-Adaptive T3 + Squeeze Momentum Strategy is a dynamic trend-following strategy based on an RSI-responsive T3 moving average and Squeeze Momentum detection .
It adapts in real-time to market volatility to enhance entry precision and optimize risk.
⚠️ This strategy is provided for educational and research purposes only.
Past performance does not guarantee future results.
🎯 Strategy Objectives
The main objective of this strategy is to catch the early phase of a trend and generate consistent entry signals.
Designed to be intuitive and accessible for traders from beginner to advanced levels.
✨ Key Features
RSI-Responsive T3: T3 length dynamically adjusts according to RSI values for adaptive trend detection
Squeeze Momentum: Combines Bollinger Bands and Keltner Channels to identify trend buildup phases
Visual Triggers: Entry signals are generated from T3 crossovers and momentum strength after squeeze release
📊 Trading Rules
Long Entry:
When T3 crosses upward, momentum is positive, and the squeeze has just been released.
Short Entry:
When T3 crosses downward, momentum is negative, and the squeeze has just been released.
Exit (Reversal):
When the opposite condition to the entry is triggered, the position is reversed.
💰 Risk Management Parameters
Pair & Timeframe: BTC/USD (30-minute chart)
Capital (simulated): $30,00
Order size: `$100` per trade (realistic, low-risk sizing)
Commission: 0.02%
Slippage: 2 pips
Risk per Trade: 5%
Number of Trades (backtest period): 181
📊 Performance Overview
Symbol: BTC/USD
Timeframe: 30-minute chart
Date Range: January 1, 2024 – July 3, 2025
Win Rate: 47.8%
Profit Factor: 2.01
Net Profit: 173.16 (units not specified)
Max Drawdown: 5.77% or 24.91 (0.79%)
⚙️ Indicator Parameters
Indicator Name: RSI-Adaptive T3 + Squeeze Momentum
RSI Length: 14
T3 Min Length: 5
T3 Max Length: 50
T3 Volume Factor: 0.7
BB Length: 27 (Multiplier: 2.0)
KC Length: 20 (Multiplier: 1.5, TrueRange enabled)
🖼 Visual Support
T3 slope direction, squeeze status, and momentum bars are visually plotted on the chart,
providing high clarity for quick trend analysis and execution.
🔧 Strategy Improvements & Uniqueness
Inspired by the RSI Adaptive T3 by ChartPrime and Squeeze Momentum Indicator by LazyBear ,
this strategy fuses both into a hybrid trend-reversal and momentum breakout detection system .
Compared to traditional trend-following methods, it excels at capturing early trend signals with greater sensitivity .
✅ Summary
The RSI-Adaptive T3 + Squeeze Momentum Strategy combines momentum detection with volatility-responsive risk management.
With a strong balance between visual clarity and practicality, it serves as a powerful tool for traders seeking high repeatability.
⚠️ This strategy is based on historical data and does not guarantee future profits.
Always use appropriate risk management when applying it.

Options Strategy V1.3📈 Options Strategy V1.3 — EMA Crossover + RSI + ATR + Opening Range
Overview:
This strategy is designed for short-term directional trades on large-cap stocks or ETFs, especially when trading options. It combines classic trend-following signals with momentum confirmation, volatility-based risk management, and session timing filters to help identify high-probability entries with predefined stop-loss and profit targets.
🔍 Strategy Components:
EMA Crossover (Fast/Slow)
Entry signals are triggered by the crossover of a short EMA above or below a long EMA — a traditional trend-following method to detect shifts in momentum.
RSI Filter
RSI confirms the signal by avoiding entries in overbought/oversold zones unless certain momentum conditions are met.
Long entry requires RSI ≥ Long Threshold
Short entry requires RSI ≤ Short Threshold
ATR-Based SL & TP
Stop-loss is set dynamically as a multiple of ATR below (long) or above (short) the entry price.
Take-profit is placed as a ratio (TP/SL) of the stop distance, ensuring consistent reward/risk structure.
Opening Range Filter (Optional)
If enabled, the strategy only triggers trades after price breaks out of the 09:30–09:45 EST range, ensuring participation in directional moves.
Session Filters
No trades from 04:00 to 09:30 and from 16:00 to 20:00 EST, avoiding low-liquidity periods.
All open trades are closed at 15:55 EST, to avoid overnight risk or expiration issues for options.
⚙️ Built-in Presets:
You can choose one of the built-in ticker-specific presets for optimal conditions:
Ticker EMAs RSI (Long/Short) ATR SL×ATR TP/SL
SPY 8/28 56 / 26 14 1.4× 4.0×
TSLA 23/27 56 / 33 13 1.4× 3.6×
AAPL 6/13 61 / 26 23 1.4× 2.1×
MSFT 25/32 54 / 26 14 1.2× 2.2×
META 25/32 53 / 26 17 1.8× 2.3×
AMZN 28/32 55 / 25 16 1.8× 2.3×
You can also choose "Custom" to fully configure all parameters to your own market and strategy preferences.
📌 Best Use Case:
This strategy is especially suited for intraday options trading, where timing and risk control are critical. It works best on liquid tickers with strong trends or clear breakout behavior.

KST Strategy [Skyrexio]Overview
KST Strategy leverages Know Sure Thing (KST) indicator in conjunction with the Williams Alligator and Moving average to obtain the high probability setups. KST is used for for having the high probability to enter in the direction of a current trend when momentum is rising, Alligator is used as a short term trend filter, while Moving average approximates the long term trend and allows trades only in its direction. Also strategy has the additional optional filter on Choppiness Index which does not allow trades if market is choppy, above the user-specified threshold. Strategy has the user specified take profit and stop-loss numbers, but multiplied by Average True Range (ATR) value on the moment when trade is open. The strategy opens only long trades.
Unique Features
ATR based stop-loss and take profit. Instead of fixed take profit and stop-loss percentage strategy utilizes user chosen numbers multiplied by ATR for its calculation.
Configurable Trading Periods. Users can tailor the strategy to specific market windows, adapting to different market conditions.
Optional Choppiness Index filter. Strategy allows to choose if it will use the filter trades with Choppiness Index and set up its threshold.
Methodology
The strategy opens long trade when the following price met the conditions:
Close price is above the Alligator's jaw line
Close price is above the filtering Moving average
KST line of Know Sure Thing indicator shall cross over its signal line (details in justification of methodology)
If the Choppiness Index filter is enabled its value shall be less than user defined threshold
When the long trade is executed algorithm defines the stop-loss level as the low minus user defined number, multiplied by ATR at the trade open candle. Also it defines take profit with close price plus user defined number, multiplied by ATR at the trade open candle. While trade is in progress, if high price on any candle above the calculated take profit level or low price is below the calculated stop loss level, trade is closed.
Strategy settings
In the inputs window user can setup the following strategy settings:
ATR Stop Loss (by default = 1.5, number of ATRs to calculate stop-loss level)
ATR Take Profit (by default = 3.5, number of ATRs to calculate take profit level)
Filter MA Type (by default = Least Squares MA, type of moving average which is used for filter MA)
Filter MA Length (by default = 200, length for filter MA calculation)
Enable Choppiness Index Filter (by default = true, setting to choose the optional filtering using Choppiness index)
Choppiness Index Threshold (by default = 50, Choppiness Index threshold, its value shall be below it to allow trades execution)
Choppiness Index Length (by default = 14, length used in Choppiness index calculation)
KST ROC Length #1 (by default = 10, value used in KST indicator calculation, more information in Justification of Methodology)
KST ROC Length #2 (by default = 15, value used in KST indicator calculation, more information in Justification of Methodology)
KST ROC Length #3 (by default = 20, value used in KST indicator calculation, more information in Justification of Methodology)
KST ROC Length #4 (by default = 30, value used in KST indicator calculation, more information in Justification of Methodology)
KST SMA Length #1 (by default = 10, value used in KST indicator calculation, more information in Justification of Methodology)
KST SMA Length #2 (by default = 10, value used in KST indicator calculation, more information in Justification of Methodology)
KST SMA Length #3 (by default = 10, value used in KST indicator calculation, more information in Justification of Methodology)
KST SMA Length #4 (by default = 15, value used in KST indicator calculation, more information in Justification of Methodology)
KST Signal Line Length (by default = 10, value used in KST indicator calculation, more information in Justification of Methodology)
User can choose the optimal parameters during backtesting on certain price chart.
Justification of Methodology
Before understanding why this particular combination of indicator has been chosen let's briefly explain what is KST, Williams Alligator, Moving Average, ATR and Choppiness Index.
The KST (Know Sure Thing) is a momentum oscillator developed by Martin Pring. It combines multiple Rate of Change (ROC) values, smoothed over different timeframes, to identify trend direction and momentum strength. First of all, what is ROC? ROC (Rate of Change) is a momentum indicator that measures the percentage change in price between the current price and the price a set number of periods ago.
ROC = 100 * (Current Price - Price N Periods Ago) / Price N Periods Ago
In our case N is the KST ROC Length inputs from settings, here we will calculate 4 different ROCs to obtain KST value:
KST = ROC1_smooth × 1 + ROC2_smooth × 2 + ROC3_smooth × 3 + ROC4_smooth × 4
ROC1 = ROC(close, KST ROC Length #1), smoothed by KST SMA Length #1,
ROC2 = ROC(close, KST ROC Length #2), smoothed by KST SMA Length #2,
ROC3 = ROC(close, KST ROC Length #3), smoothed by KST SMA Length #3,
ROC4 = ROC(close, KST ROC Length #4), smoothed by KST SMA Length #4
Also for this indicator the signal line is calculated:
Signal = SMA(KST, KST Signal Line Length)
When the KST line rises, it indicates increasing momentum and suggests that an upward trend may be developing. Conversely, when the KST line declines, it reflects weakening momentum and a potential downward trend. A crossover of the KST line above its signal line is considered a buy signal, while a crossover below the signal line is viewed as a sell signal. If the KST stays above zero, it indicates overall bullish momentum; if it remains below zero, it points to bearish momentum. The KST indicator smooths momentum across multiple timeframes, helping to reduce noise and provide clearer signals for medium- to long-term trends.
Next, let’s discuss the short-term trend filter, which combines the Williams Alligator and Williams Fractals. Williams Alligator
Developed by Bill Williams, the Alligator is a technical indicator that identifies trends and potential market reversals. It consists of three smoothed moving averages:
Jaw (Blue Line): The slowest of the three, based on a 13-period smoothed moving average shifted 8 bars ahead.
Teeth (Red Line): The medium-speed line, derived from an 8-period smoothed moving average shifted 5 bars forward.
Lips (Green Line): The fastest line, calculated using a 5-period smoothed moving average shifted 3 bars forward.
When the lines diverge and align in order, the "Alligator" is "awake," signaling a strong trend. When the lines overlap or intertwine, the "Alligator" is "asleep," indicating a range-bound or sideways market. This indicator helps traders determine when to enter or avoid trades.
The next indicator is Moving Average. It has a lot of different types which can be chosen to filter trades and the Least Squares MA is used by default settings. Let's briefly explain what is it.
The Least Squares Moving Average (LSMA) — also known as Linear Regression Moving Average — is a trend-following indicator that uses the least squares method to fit a straight line to the price data over a given period, then plots the value of that line at the most recent point. It draws the best-fitting straight line through the past N prices (using linear regression), and then takes the endpoint of that line as the value of the moving average for that bar. The LSMA aims to reduce lag and highlight the current trend more accurately than traditional moving averages like SMA or EMA.
Key Features:
It reacts faster to price changes than most moving averages.
It is smoother and less noisy than short-term EMAs.
It can be used to identify trend direction, momentum, and potential reversal points.
ATR (Average True Range) is a volatility indicator that measures how much an asset typically moves during a given period. It was introduced by J. Welles Wilder and is widely used to assess market volatility, not direction.
To calculate it first of all we need to get True Range (TR), this is the greatest value among:
High - Low
abs(High - Previous Close)
abs(Low - Previous Close)
ATR = MA(TR, n) , where n is number of periods for moving average, in our case equals 14.
ATR shows how much an asset moves on average per candle/bar. A higher ATR means more volatility; a lower ATR means a calmer market.
The Choppiness Index is a technical indicator that quantifies whether the market is trending or choppy (sideways). It doesn't indicate trend direction — only the strength or weakness of a trend. Higher Choppiness Index usually approximates the sideways market, while its low value tells us that there is a high probability of a trend.
Choppiness Index = 100 × log10(ΣATR(n) / (MaxHigh(n) - MinLow(n))) / log10(n)
where:
ΣATR(n) = sum of the Average True Range over n periods
MaxHigh(n) = highest high over n periods
MinLow(n) = lowest low over n periods
log10 = base-10 logarithm
Now let's understand how these indicators work in conjunction and why they were chosen for this strategy. KST indicator approximates current momentum, when it is rising and KST line crosses over the signal line there is high probability that short term trend is reversing to the upside and strategy allows to take part in this potential move. Alligator's jaw (blue) line is used as an approximation of a short term trend, taking trades only above it we want to avoid trading against trend to increase probability that long trade is going to be winning.
Almost the same for Moving Average, but it approximates the long term trend, this is just the additional filter. If we trade in the direction of the long term trend we increase probability that higher risk to reward trade will hit the take profit. Choppiness index is the optional filter, but if it turned on it is used for approximating if now market is in sideways or in trend. On the range bounded market the potential moves are restricted. We want to decrease probability opening trades in such condition avoiding trades if this index is above threshold value.
When trade is open script sets the stop loss and take profit targets. ATR approximates the current volatility, so we can make a decision when to exit a trade based on current market condition, it can increase the probability that strategy will avoid the excessive stop loss hits, but anyway user can setup how many ATRs to use as a stop loss and take profit target. As was said in the Methodology stop loss level is obtained by subtracting number of ATRs from trade opening candle low, while take profit by adding to this candle's close.
Backtest Results
Operating window: Date range of backtests is 2023.01.01 - 2025.05.01. It is chosen to let the strategy to close all opened positions.
Commission and Slippage: Includes a standard Binance commission of 0.1% and accounts for possible slippage over 5 ticks.
Initial capital: 10000 USDT
Percent of capital used in every trade: 60%
Maximum Single Position Loss: -5.53%
Maximum Single Profit: +8.35%
Net Profit: +5175.20 USDT (+51.75%)
Total Trades: 120 (56.67% win rate)
Profit Factor: 1.747
Maximum Accumulated Loss: 1039.89 USDT (-9.1%)
Average Profit per Trade: 43.13 USDT (+0.6%)
Average Trade Duration: 27 hours
These results are obtained with realistic parameters representing trading conditions observed at major exchanges such as Binance and with realistic trading portfolio usage parameters.
How to Use
Add the script to favorites for easy access.
Apply to the desired timeframe and chart (optimal performance observed on 1h BTC/USDT).
Configure settings using the dropdown choice list in the built-in menu.
Set up alerts to automate strategy positions through web hook with the text: {{strategy.order.alert_message}}
Disclaimer:
Educational and informational tool reflecting Skyrexio commitment to informed trading. Past performance does not guarantee future results. Test strategies in a simulated environment before live implementation.

Ticker Pulse Meter + Fear EKG StrategyDescription
The Ticker Pulse Meter + Fear EKG Strategy is a technical analysis tool designed to identify potential entry and exit points for long positions based on price action relative to historical ranges. It combines two proprietary indicators: the Ticker Pulse Meter (TPM), which measures price positioning within short- and long-term ranges, and the Fear EKG, a VIX-inspired oscillator that detects extreme market conditions. The strategy is non-repainting, ensuring signals are generated only on confirmed bars to avoid false positives. Visual enhancements, such as optional moving averages and Bollinger Bands, provide additional context but are not core to the strategy's logic. This script is suitable for traders seeking a systematic approach to capturing momentum and mean-reversion opportunities.
How It Works
The strategy evaluates price action using two key metrics:
Ticker Pulse Meter (TPM): Measures the current price's position within short- and long-term price ranges to identify momentum or overextension.
Fear EKG: Detects extreme selling pressure (akin to "irrational selling") by analyzing price behavior relative to historical lows, inspired by volatility-based oscillators.
Entry signals are generated when specific conditions align, indicating potential buying opportunities. Exits are triggered based on predefined thresholds or partial position closures to manage risk. The strategy supports customizable lookback periods, thresholds, and exit percentages, allowing flexibility across different markets and timeframes. Visual cues, such as entry/exit dots and a position table, enhance usability, while optional overlays like moving averages and Bollinger Bands provide additional chart context.
Calculation Overview
Price Range Calculations:
Short-Term Range: Uses the lowest low (min_price_short) and highest high (max_price_short) over a user-defined short lookback period (lookback_short, default 50 bars).
Long-Term Range: Uses the lowest low (min_price_long) and highest high (max_price_long) over a user-defined long lookback period (lookback_long, default 200 bars).
Percentage Metrics:
pct_above_short: Percentage of the current close above the short-term range.
pct_above_long: Percentage of the current close above the long-term range.
Combined metrics (pct_above_long_above_short, pct_below_long_below_short) normalize price action for signal generation.
Signal Generation:
Long Entry (TPM): Triggered when pct_above_long_above_short crosses above a user-defined threshold (entryThresholdhigh, default 20) and pct_below_long_below_short is below a low threshold (entryThresholdlow, default 40).
Long Entry (Fear EKG): Triggered when pct_below_long_below_short crosses under an extreme threshold (orangeEntryThreshold, default 95), indicating potential oversold conditions.
Long Exit: Triggered when pct_above_long_above_short crosses under a profit-taking level (profitTake, default 95). Partial exits are supported via a user-defined percentage (exitAmt, default 50%).
Non-Repainting Logic: Signals are calculated using data from the previous bar ( ) and only plotted on confirmed bars (barstate.isconfirmed), ensuring reliability.
Visual Enhancements:
Optional moving averages (SMA, EMA, WMA, VWMA, or SMMA) and Bollinger Bands can be enabled for trend context.
A position table displays real-time metrics, including open positions, Fear EKG, and Ticker Pulse values.
Background highlights mark periods of high selling pressure.
Entry Rules
Long Entry:
TPM Signal: Occurs when the price shows strength relative to both short- and long-term ranges, as defined by pct_above_long_above_short crossing above entryThresholdhigh and pct_below_long_below_short below entryThresholdlow.
Fear EKG Signal: Triggered by extreme selling pressure, when pct_below_long_below_short crosses under orangeEntryThreshold. This signal is optional and can be toggled via enable_yellow_signals.
Entries are executed only on confirmed bars to prevent repainting.
Exit Rules
Long Exit: Triggered when pct_above_long_above_short crosses under profitTake.
Partial exits are supported, with the strategy closing a user-defined percentage of the position (exitAmt) up to four times per position (exit_count limit).
Exits can be disabled or adjusted via enable_short_signal and exitPercentage settings.
Inputs
Backtest Start Date: Defines the start of the backtesting period (default: Jan 1, 2017).
Lookback Periods: Short (lookback_short, default 50) and long (lookback_long, default 200) periods for range calculations.
Resolution: Timeframe for price data (default: Daily).
Entry/Exit Thresholds:
entryThresholdhigh (default 20): Threshold for TPM entry.
entryThresholdlow (default 40): Secondary condition for TPM entry.
orangeEntryThreshold (default 95): Threshold for Fear EKG entry.
profitTake (default 95): Exit threshold.
exitAmt (default 50%): Percentage of position to exit.
Visual Options: Toggle for moving averages and Bollinger Bands, with customizable types and lengths.
Notes
The strategy is designed to work across various timeframes and assets, with data sourced from user-selected resolutions (i_res).
Alerts are included for long entry and exit signals, facilitating integration with TradingView's alert system.
The script avoids repainting by using confirmed bar data and shifted calculations ( ).
Visual elements (e.g., SMA, Bollinger Bands) are inspired by standard Pine Script practices and are optional, not integral to the core logic.
Usage
Apply the script to a chart, adjust input settings to suit your trading style, and use the visual cues (entry/exit dots, position table) to monitor signals. Enable alerts for real-time notifications.
Designed to work best on Daily timeframe.

Out of the Noise Intraday Strategy with VWAP [YuL]This is my (naive) implementation of "Beat the Market An Effective Intraday Momentum Strategy for S&P500 ETF (SPY)" paper by Carlo Zarattini, Andrew Aziz, Andrea Barbon, so the credit goes to them.
It is supposed to run on SPY on 30-minute timeframe, there may be issues on other timeframes.
I've used settings that were used by the authors in the original paper to keep it close to the publication, but I understand that they are very aggressive and probably shouldn't be used like that.
Results are good, but not as good as they are stated in the paper (unsurprisingly?): returns are smaller and Sharpe is very low (which is actually weird given the returns and drawdown ratio), there are also margin calls if you enable margin check (and you should).
I have my own ideas of improvements which I will probably implement separately to keep this clean.

Bollinger Band Breakout With Volatility StoplossDetailed Explanation of the Bollinger Band Breakout With Volatility Stoploss System
Introduction
The "Bollinger Band Breakout With Volatility Stoploss" system is a trading strategy designed to exploit price volatility in financial markets using the Bollinger Bands indicator, a widely recognized tool developed by John Bollinger. This system adapts the traditional Bollinger Bands framework into a Volatility Breakout strategy, focusing on capturing significant price movements by leveraging customized parameters and precise trading rules. The system operates exclusively on long positions, employs a daily timeframe, and incorporates dynamic risk management techniques to optimize trade outcomes while preserving capital.
System Parameters
The system modifies the standard Bollinger Bands configuration to suit its breakout methodology:
Standard Deviation (SD): Set to 1x, determining the width of the bands relative to the central moving average. This tighter setting enhances sensitivity to price movements, making the system responsive to smaller volatility shifts compared to the conventional 2x SD.
Period: A 30-day (1-month) lookback period is used to calculate the bands, providing a balance between capturing medium-term price trends and avoiding excessive noise from shorter timeframes.
Moving Average Type: The system uses an Exponential Moving Average (EMA) instead of the Simple Moving Average (SMA). The EMA places greater weight on recent price data, making it more responsive to current market conditions and better suited for detecting breakout opportunities in dynamic markets.
Core Concept
The Bollinger Band Breakout system is built on the principle of Volatility Breakout, which seeks to capitalize on significant price movements when the price breaks out of a defined volatility range. The Bollinger Bands, consisting of an EMA as the central line and two bands (Upper and Lower) calculated as the EMA plus or minus 1x SD, define this range. The system operates on a Daily Chart (D) timeframe, making it suitable for traders who prefer analyzing and executing trades based on daily price action. By focusing solely on Long Positions (buying low and selling high), the system avoids short-selling, aligning with strategies that capitalize on upward price momentum.
The core idea is to use the 1x SD multiplier over a 30-day period to establish a dynamic price range that reflects recent market volatility. Breakouts above the Upper Band signal potential buying opportunities, while penetrations below the Lower Band indicate exits, ensuring trades are aligned with significant price movements.
Trading Signals
The system generates clear entry and exit signals based on price interactions with the Bollinger Bands:
Buy Signal: A buy signal is triggered when the closing price of a daily candle exceeds the Upper Bollinger Band (EMA + 1x SD over 30 days). The trade is entered at the opening price of the subsequent candle, ensuring the breakout is confirmed by the close of the prior day. This approach minimizes false signals by waiting for a definitive breach of the volatility threshold.
Sell Signal: A sell signal occurs when the closing price falls below the Lower Bollinger Band (EMA - 1x SD over 30 days). The position is exited at the opening price of the next candle, allowing the trader to lock in profits or limit losses when the price reverses or loses momentum.
Risk Management
Risk management is a cornerstone of the system, ensuring capital preservation and disciplined trade execution:
Initial Stoploss: The stoploss is set at the Lower Bollinger Band of the candle that triggered the buy signal. This level acts as a volatility-based threshold, below which the trade is deemed invalid, prompting an immediate exit to protect capital. Traders have two options for implementing the stoploss:
Pending Stoploss: A predefined stoploss order placed at the Lower Band level.
Conditional Exit: Using the sell signal condition (price closing below the Lower Band) as the exit trigger, effectively aligning the stoploss with the system’s exit rules.
Position Sizing: The system employs Fixed Fractional Position Sizing with a risk per trade capped at 3% of the account balance. The position size is calculated based on the distance between the entry price and the Initial Stoploss, incorporating Volatility Position Sizing. This method adjusts the trade size according to the market’s volatility, ensuring that risk remains consistent across varying market conditions. Two options are available for managing capital:
Gear Up Option: Profits from previous trades are reinvested into the account’s capital, increasing the base for calculating the next position size. This compounding approach can amplify returns but also increases risk exposure.
Fixed Equity Option: Profits from previous trades are withdrawn, and only the remaining capital is used for calculating the next position size. This conservative approach prioritizes capital preservation by not compounding gains.
Trailing Stop: The system uses the Lower Bollinger Band as a dynamic trailing stop, which adjusts with price movements and volatility. This ensures that profits are protected during favorable trends while allowing the trade to remain open as long as the price stays above the Lower Band. The trailing stop aligns with the sell signal condition, maintaining consistency in the system’s exit strategy.
Supporting Indicators
The system incorporates two additional indicators to enhance market analysis and decision-making:
Bollinger Band Width (BBW): BBW measures the distance between the Upper and Lower Bollinger Bands relative to the EMA, serving as a proxy for market volatility.
A high BBW indicates significant price volatility, often associated with strong trends or large price movements, which may confirm the strength of a breakout.
A low BBW suggests low volatility, potentially signaling a period of consolidation or "squeeze" that could precede a breakout. This can help traders anticipate potential trade setups.
The BBW calculation uses the EMA to maintain consistency with the system’s core parameters.
Bollinger Band Ratio (BBR) or %B: BBR measures the price’s position relative to the Bollinger Bands, providing insight into market conditions.
BBR > 1: The price is above the Upper Band, indicating potential overbought conditions or strong upward momentum, which aligns with the system’s buy signal.
BBR < 0: The price is below the Lower Band, suggesting oversold conditions or downward momentum, corresponding to the sell signal or stoploss trigger.
BBR between 0 and 1: The price is within the bands, indicating a neutral state where no immediate action is required.
Like BBW, BBR is calculated using the EMA for consistency.
Backtesting and Implementation
To evaluate the system’s performance, traders can utilize the Backtest Parameter function, which allows for testing the strategy across user-defined time periods. This feature enables traders to assess the system’s effectiveness under various market conditions, optimize parameters, and refine their approach based on historical data.
Conclusion
The Bollinger Band Breakout With Volatility Stoploss system is a robust, volatility-driven trading strategy that combines the predictive power of Bollinger Bands with disciplined risk management. By focusing on long positions, using a 1x SD multiplier, and incorporating EMA-based calculations, the system is designed to capture significant price breakouts while minimizing risk through dynamic stoplosses and volatility-adjusted position sizing. The inclusion of BBW and BBR indicators provides additional context for assessing market conditions, enhancing the trader’s ability to make informed decisions. With its structured approach and backtesting capabilities, this system is well-suited for traders seeking a systematic, data-driven method to trade in volatile markets.

Daily Bias on 5 minutes Reversal StrategyThis strategy combines higher-timeframe bias (daily and 1-hour) with 5-minute reversal signals to identify intraday trades. It aims to capitalize on false breakouts of the previous day's high/low, with strict risk management (Strict position sizing, max risk cap, and R:R enforcement), Avoids Over-Trading (1 trade/day rule prevents chasing), SL buffer adapts to volatility.
#1. This strategy does not utilize indicators. We will use the daily (D) price range and look for breakout attempts and rejections at the extreme points on the lower time frame (1h). If rejection occurs, it establishes our bias (bullish or bearish). For final confirmation, we move to the 5-minute timeframe to observe attempts to retest that daily price range. If significant rejection occurs again, that becomes our entry point.
#2. When rejection occurs, the 1-hour candle may form a new extreme point (low/high). Therefore, we will no longer use the daily price range as our trade exit point but instead the new extreme level established after the breakout attempt and price rejection.
To prevent premature trade exits, we also add an SL buffer using ATR while still capping the maximum acceptable risk per trade (as a percentage). Take profit is calculated using a risk-to-reward ratio, with a default setting of 1.5x.
#3. Key Input Parameters
a. Timeframes :
1. Daily TF ((Anchor for daily high/low (default: D).)
2. 1H Bias TF (Bias confirmation timeframe (default: 60))
3. Execution TF (Entry signal timeframe (default: 5, should match chart).
b. Trade Management
1. SL Buffer ATR Multiplier (Buffer beyond swing low/high (default: 6.0))
2. Min ATR Threshold (Minimum buffer size (default: 1.0))
3. Risk Reward Ratio (TP distance multiplier (default: 1.5))
4. Max Risk Allowed (Max risk % of entry (default: 3.0%))
Lookback Bars for SL Bars for swing low/high (default: 60))
c. Break Thresholds
1. 1H Candle Break Threshold (ATR multiplier for 1H break (default: 0.75))
2. 5M Candle Break Threshold (ATR multiplier for 5M break (default: 0.5))

Anomalous Holonomy Field Theory🌌 Anomalous Holonomy Field Theory (AHFT) - Revolutionary Quantum Market Analysis
Where Theoretical Physics Meets Trading Reality
A Groundbreaking Synthesis of Differential Geometry, Quantum Field Theory, and Market Dynamics
🔬 THEORETICAL FOUNDATION - THE MATHEMATICS OF MARKET REALITY
The Anomalous Holonomy Field Theory represents an unprecedented fusion of advanced mathematical physics with practical market analysis. This isn't merely another indicator repackaging old concepts - it's a fundamentally new lens through which to view and understand market structure .
1. HOLONOMY GROUPS (Differential Geometry)
In differential geometry, holonomy measures how vectors change when parallel transported around closed loops in curved space. Applied to markets:
Mathematical Formula:
H = P exp(∮_C A_μ dx^μ)
Where:
P = Path ordering operator
A_μ = Market connection (price-volume gauge field)
C = Closed price path
Market Implementation:
The holonomy calculation measures how price "remembers" its journey through market space. When price returns to a previous level, the holonomy captures what has changed in the market's internal geometry. This reveals:
Hidden curvature in the market manifold
Topological obstructions to arbitrage
Geometric phase accumulated during price cycles
2. ANOMALY DETECTION (Quantum Field Theory)
Drawing from the Adler-Bell-Jackiw anomaly in quantum field theory:
Mathematical Formula:
∂_μ j^μ = (e²/16π²)F_μν F̃^μν
Where:
j^μ = Market current (order flow)
F_μν = Field strength tensor (volatility structure)
F̃^μν = Dual field strength
Market Application:
Anomalies represent symmetry breaking in market structure - moments when normal patterns fail and extraordinary opportunities arise. The system detects:
Spontaneous symmetry breaking (trend reversals)
Vacuum fluctuations (volatility clusters)
Non-perturbative effects (market crashes/melt-ups)
3. GAUGE THEORY (Theoretical Physics)
Markets exhibit gauge invariance - the fundamental physics remains unchanged under certain transformations:
Mathematical Formula:
A'_μ = A_μ + ∂_μΛ
This ensures our signals are gauge-invariant observables , immune to arbitrary market "coordinate changes" like gaps or reference point shifts.
4. TOPOLOGICAL DATA ANALYSIS
Using persistent homology and Morse theory:
Mathematical Formula:
β_k = dim(H_k(X))
Where β_k are the Betti numbers describing topological features that persist across scales.
🎯 REVOLUTIONARY SIGNAL CONFIGURATION
Signal Sensitivity (0.5-12.0, default 2.5)
Controls the responsiveness of holonomy field calculations to market conditions. This parameter directly affects the threshold for detecting quantum phase transitions in price action.
Optimization by Timeframe:
Scalping (1-5min): 1.5-3.0 for rapid signal generation
Day Trading (15min-1H): 2.5-5.0 for balanced sensitivity
Swing Trading (4H-1D): 5.0-8.0 for high-quality signals only
Score Amplifier (10-200, default 50)
Scales the raw holonomy field strength to produce meaningful signal values. Higher values amplify weak signals in low-volatility environments.
Signal Confirmation Toggle
When enabled, enforces additional technical filters (EMA and RSI alignment) to reduce false positives. Essential for conservative strategies.
Minimum Bars Between Signals (1-20, default 5)
Prevents overtrading by enforcing quantum decoherence time between signals. Higher values reduce whipsaws in choppy markets.
👑 ELITE EXECUTION SYSTEM
Execution Modes:
Conservative Mode:
Stricter signal criteria
Higher quality thresholds
Ideal for stable market conditions
Adaptive Mode:
Self-adjusting parameters
Balances signal frequency with quality
Recommended for most traders
Aggressive Mode:
Maximum signal sensitivity
Captures rapid market moves
Best for experienced traders in volatile conditions
Dynamic Position Sizing:
When enabled, the system scales position size based on:
Holonomy field strength
Current volatility regime
Recent performance metrics
Advanced Exit Management:
Implements trailing stops based on ATR and signal strength, with mode-specific multipliers for optimal profit capture.
🧠 ADAPTIVE INTELLIGENCE ENGINE
Self-Learning System:
The strategy analyzes recent trade outcomes and adjusts:
Risk multipliers based on win/loss ratios
Signal weights according to performance
Market regime detection for environmental adaptation
Learning Speed (0.05-0.3):
Controls adaptation rate. Higher values = faster learning but potentially unstable. Lower values = stable but slower adaptation.
Performance Window (20-100 trades):
Number of recent trades analyzed for adaptation. Longer windows provide stability, shorter windows increase responsiveness.
🎨 REVOLUTIONARY VISUAL SYSTEM
1. Holonomy Field Visualization
What it shows: Multi-layer quantum field bands representing market resonance zones
How to interpret:
Blue/Purple bands = Primary holonomy field (strongest resonance)
Band width = Field strength and volatility
Price within bands = Normal quantum state
Price breaking bands = Quantum phase transition
Trading application: Trade reversals at band extremes, breakouts on band violations with strong signals.
2. Quantum Portals
What they show: Entry signals with recursive depth patterns indicating momentum strength
How to interpret:
Upward triangles with portals = Long entry signals
Downward triangles with portals = Short entry signals
Portal depth = Signal strength and expected momentum
Color intensity = Probability of success
Trading application: Enter on portal appearance, with size proportional to portal depth.
3. Field Resonance Bands
What they show: Fibonacci-based harmonic price zones where quantum resonance occurs
How to interpret:
Dotted circles = Minor resonance levels
Solid circles = Major resonance levels
Color coding = Resonance strength
Trading application: Use as dynamic support/resistance, expect reactions at resonance zones.
4. Anomaly Detection Grid
What it shows: Fractal-based support/resistance with anomaly strength calculations
How to interpret:
Triple-layer lines = Major fractal levels with high anomaly probability
Labels show: Period (H8-H55), Price, and Anomaly strength (φ)
⚡ symbol = Extreme anomaly detected
● symbol = Strong anomaly
○ symbol = Normal conditions
Trading application: Expect major moves when price approaches high anomaly levels. Use for precise entry/exit timing.
5. Phase Space Flow
What it shows: Background heatmap revealing market topology and energy
How to interpret:
Dark background = Low market energy, range-bound
Purple glow = Building energy, trend developing
Bright intensity = High energy, strong directional move
Trading application: Trade aggressively in bright phases, reduce activity in dark phases.
📊 PROFESSIONAL DASHBOARD METRICS
Holonomy Field Strength (-100 to +100)
What it measures: The Wilson loop integral around price paths
>70: Strong positive curvature (bullish vortex)
<-70: Strong negative curvature (bearish collapse)
Near 0: Flat connection (range-bound)
Anomaly Level (0-100%)
What it measures: Quantum vacuum expectation deviation
>70%: Major anomaly (phase transition imminent)
30-70%: Moderate anomaly (elevated volatility)
<30%: Normal quantum fluctuations
Quantum State (-1, 0, +1)
What it measures: Market wave function collapse
+1: Bullish eigenstate |↑⟩
0: Superposition (uncertain)
-1: Bearish eigenstate |↓⟩
Signal Quality Ratings
LEGENDARY: All quantum fields aligned, maximum probability
EXCEPTIONAL: Strong holonomy with anomaly confirmation
STRONG: Good field strength, moderate anomaly
MODERATE: Decent signals, some uncertainty
WEAK: Minimal edge, high quantum noise
Performance Metrics
Win Rate: Rolling performance with emoji indicators
Daily P&L: Real-time profit tracking
Adaptive Risk: Current risk multiplier status
Market Regime: Bull/Bear classification
🏆 WHY THIS CHANGES EVERYTHING
Traditional technical analysis operates on 100-year-old principles - moving averages, support/resistance, and pattern recognition. These work because many traders use them, creating self-fulfilling prophecies.
AHFT transcends this limitation by analyzing markets through the lens of fundamental physics:
Markets have geometry - The holonomy calculations reveal this hidden structure
Price has memory - The geometric phase captures path-dependent effects
Anomalies are predictable - Quantum field theory identifies symmetry breaking
Everything is connected - Gauge theory unifies disparate market phenomena
This isn't just a new indicator - it's a new way of thinking about markets . Just as Einstein's relativity revolutionized physics beyond Newton's mechanics, AHFT revolutionizes technical analysis beyond traditional methods.
🔧 OPTIMAL SETTINGS FOR MNQ 10-MINUTE
For the Micro E-mini Nasdaq-100 on 10-minute timeframe:
Signal Sensitivity: 2.5-3.5
Score Amplifier: 50-70
Execution Mode: Adaptive
Min Bars Between: 3-5
Theme: Quantum Nebula or Dark Matter
💭 THE JOURNEY - FROM IMPOSSIBLE THEORY TO TRADING REALITY
Creating AHFT was a mathematical odyssey that pushed the boundaries of what's possible in Pine Script. The journey began with a seemingly impossible question: Could the profound mathematical structures of theoretical physics be translated into practical trading tools?
The Theoretical Challenge:
Months were spent diving deep into differential geometry textbooks, studying the works of Chern, Simons, and Witten. The mathematics of holonomy groups and gauge theory had never been applied to financial markets. Translating abstract mathematical concepts like parallel transport and fiber bundles into discrete price calculations required novel approaches and countless failed attempts.
The Computational Nightmare:
Pine Script wasn't designed for quantum field theory calculations. Implementing the Wilson loop integral, managing complex array structures for anomaly detection, and maintaining computational efficiency while calculating geometric phases pushed the language to its limits. There were moments when the entire project seemed impossible - the script would timeout, produce nonsensical results, or simply refuse to compile.
The Breakthrough Moments:
After countless sleepless nights and thousands of lines of code, breakthrough came through elegant simplifications. The realization that market anomalies follow patterns similar to quantum vacuum fluctuations led to the revolutionary anomaly detection system. The discovery that price paths exhibit holonomic memory unlocked the geometric phase calculations.
The Visual Revolution:
Creating visualizations that could represent 4-dimensional quantum fields on a 2D chart required innovative approaches. The multi-layer holonomy field, recursive quantum portals, and phase space flow representations went through dozens of iterations before achieving the perfect balance of beauty and functionality.
The Balancing Act:
Perhaps the greatest challenge was maintaining mathematical rigor while ensuring practical trading utility. Every formula had to be both theoretically sound and computationally efficient. Every visual had to be both aesthetically pleasing and information-rich.
The result is more than a strategy - it's a synthesis of pure mathematics and market reality that reveals the hidden order within apparent chaos.
📚 INTEGRATED DOCUMENTATION
Once applied to your chart, AHFT includes comprehensive tooltips on every input parameter. The source code contains detailed explanations of the mathematical theory, practical applications, and optimization guidelines. This published description provides the overview - the indicator itself is a complete educational resource.
⚠️ RISK DISCLAIMER
While AHFT employs advanced mathematical models derived from theoretical physics, markets remain inherently unpredictable. No mathematical model, regardless of sophistication, can guarantee future results. This strategy uses realistic commission ($0.62 per contract) and slippage (1 tick) in all calculations. Past performance does not guarantee future results. Always use appropriate risk management and never risk more than you can afford to lose.
🌟 CONCLUSION
The Anomalous Holonomy Field Theory represents a quantum leap in technical analysis - literally. By applying the profound insights of differential geometry, quantum field theory, and gauge theory to market analysis, AHFT reveals structure and opportunities invisible to traditional methods.
From the holonomy calculations that capture market memory to the anomaly detection that identifies phase transitions, from the adaptive intelligence that learns and evolves to the stunning visualizations that make the invisible visible, every component works in mathematical harmony.
This is more than a trading strategy. It's a new lens through which to view market reality.
Trade with the precision of physics. Trade with the power of mathematics. Trade with AHFT.
I hope this serves as a good replacement for Quantum Edge Pro - Adaptive AI until I'm able to fix it.
— Dskyz, Trade with insight. Trade with anticipation.

Donchian x WMA Crossover (2025 Only, Adjustable TP, Real OHLC)Short Description:
Long-only breakout system that goes long when the Donchian Low crosses up through a Weighted Moving Average, and closes when it crosses back down (with an optional take-profit), restricted to calendar year 2025. All signals use the instrument’s true OHLC data (even on Heikin-Ashi charts), start with 1 000 AUD of capital, and deploy 100 % equity per trade.
Ideal parameters configured for Temple & Webster on ASX 30 minute candles. Adjust parameter to suit however best to download candle interval data and have GPT test the pine script for optimum parameters for your trading symbol.
Detailed Description
1. Strategy Concept
This strategy captures trend-driven breakouts off the bottom of a Donchian channel. By combining the Donchian Low with a WMA filter, it aims to:
Enter when volatility compresses and price breaks above the recent Donchian Low while the longer‐term WMA confirms upward momentum.
Exit when price falls back below that same WMA (i.e. when the Donchian Low crosses back down through WMA), but only if the WMA itself has stopped rising.
Optional Take-Profit: you can specify a profit target in decimal form (e.g. 0.01 = 1 %).
2. Timeframe & Universe
In-sample period: only bars stamped between Jan 1 2025 00:00 UTC and Dec 31 2025 23:59 UTC are considered.
Any resolution (e.g. 30 m, 1 h, D, etc.) is supported—just set your preferred timeframe in the TradingView UI.
3. True-Price Execution
All indicator calculations (Donchian Low, WMA, crossover checks, take-profit) are sourced from the chart’s underlying OHLC via request.security(). This guarantees that:
You can view Heikin-Ashi or other styled candles, but your strategy will execute on the real OHLC bars.
Chart styling never suppresses or distorts your backtest results.
4. Position Sizing & Equity
Initial capital: 1 000 AUD
Size per trade: 100 % of available equity
No pyramiding: one open position at a time
5. Inputs (all exposed in the “Inputs” tab):
Input Default Description
Donchian Length 7 Number of bars to calculate the Donchian channel low
WMA Length 62 Period of the Weighted Moving Average filter
Take Profit (decimal) 0.01 Exit when price ≥ entry × (1 + take_profit_perc)
6. How It Works
Donchian Low: ta.lowest(low, DonchianLength) over the specified look-back.
WMA: ta.wma(close, WMALength) applied to true closes.
Entry: ta.crossover(DonchianLow, WMA) AND barTime ∈ 2025.
Exit:
Cross-down exit: ta.crossunder(DonchianLow, WMA) and WMA is not rising (i.e. momentum has stalled).
Take-profit exit: price ≥ entry × (1 + take_profit_perc).
Calendar exit: barTime falls outside 2025.
7. Usage Notes
After adding to your chart, open the Strategy Tester tab to review performance metrics, list of trades, equity curve, etc.
You can toggle your chart to Heikin-Ashi for visual clarity without affecting execution, thanks to the real-OHLC calls.

System 0530 - Stoch RSI Strategy with ATR filterStrategy Description: System 0530 - Multi-Timeframe Stochastic RSI with ATR Filter
Overview:
This strategy, "System 0530," is designed to identify trading opportunities by leveraging the Stochastic RSI indicator across two different timeframes: a shorter timeframe for initial signal triggers (assumed to be the chart's current timeframe, e.g., 5-minute) and a longer timeframe (15-minute) for signal confirmation. It incorporates an ATR (Average True Range) filter to help ensure trades are taken during periods of adequate market volatility and includes a cooldown mechanism to prevent rapid, successive signals in the same direction. Trade exits are primarily handled by reversing signals.
How It Works:
1. Signal Initiation (e.g., 5-Minute Timeframe):
Long Signal Wait: A potential long entry is considered when the 5-minute Stochastic RSI %K line crosses above its %D line, AND the %K value at the time of the cross is at or below a user-defined oversold level (default: 30).
Short Signal Wait: A potential short entry is considered when the 5-minute Stochastic RSI %K line crosses below its %D line, AND the %K value at the time of the cross is at or above a user-defined overbought level (default: 70). When these conditions are met, the strategy enters a "waiting state" for confirmation from the 15-minute timeframe.
2. Signal Confirmation (15-Minute Timeframe):
Once in a waiting state, the strategy looks for confirmation on the 15-minute Stochastic RSI within a user-defined number of 5-minute bars (wait_window_5min_bars, default: 5 bars).
Long Confirmation:
The 15-minute Stochastic RSI %K must be greater than or equal to its %D line.
The 15-minute Stochastic RSI %K value must be below a user-defined threshold (stoch_15min_long_entry_level, default: 40).
Short Confirmation:
The 15-minute Stochastic RSI %K must be less than or equal to its %D line.
The 15-minute Stochastic RSI %K value must be above a user-defined threshold (stoch_15min_short_entry_level, default: 60).
3. Filters:
ATR Volatility Filter: If enabled, trades are only confirmed if the current ATR value (converted to ticks) is above a user-defined minimum threshold (min_atr_value_ticks). This helps to avoid taking signals during periods of very low market volatility. If the ATR condition is not met, the strategy continues to wait for the condition to be met within the confirmation window, provided other conditions still hold.
Signal Cooldown Filter: If enabled, after a signal is generated, the strategy will wait for a minimum number of bars (min_bars_between_signals) before allowing another signal in the same direction. This aims to reduce overtrading.
4. Entry and Exit Logic:
Entry: A strategy.entry() order is placed when all trigger, confirmation, and filter conditions are met.
Exit: This strategy primarily uses reversing signals for exits. For example, if a long position is open, a confirmed short signal will close the long position and open a new short position. There are no explicit take profit or stop loss orders programmed into this version of the script.
Key User-Adjustable Parameters:
Stochastic RSI Parameters: RSI Length, Stochastic RSI Length, %K Smoothing, %D Smoothing.
Signal Trigger & Confirmation:
5-minute %K trigger levels for long and short.
15-minute %K confirmation thresholds for long and short.
Wait window (in 5-minute bars) for 15-minute confirmation.
Filters:
Enable/disable and configure the Signal Cooldown filter (minimum bars between signals).
Enable/disable and configure the ATR Volatility filter (ATR period, minimum ATR value in ticks).
Strategy Parameters:
Leverage Multiplier (Note: This primarily affects theoretical position sizing for backtesting calculations in TradingView and does not simulate actual leveraged trading risks).
Recommendations for Users:
Thorough Backtesting: Test this strategy extensively on historical data for the instruments and timeframes you intend to trade.
Parameter Optimization: Experiment with different parameter settings to find what works best for your trading style and chosen markets. The default values are starting points and may not be optimal for all conditions.
Understand the Logic: Ensure you understand how each component (Stochastic RSI on different timeframes, ATR filter, cooldown) interacts to generate signals.
Risk Management: Since this version does not include explicit stop-loss orders, ensure you have a clear risk management plan in place if trading this strategy live. You might consider manually adding stop-loss orders through your broker or using TradingView's separate strategy order settings for stop-loss if applicable.
Disclaimer:
This strategy description is for informational purposes only and does not constitute financial advice. Past performance is not indicative of future results. Trading involves significant risk of loss. Always do your own research and understand the risks before trading.

Pin Bar Reversal StrategyStrategy: Pin Bar Reversal with Trend Filter
One effective high-probability setup is a Pin Bar reversal in the direction of the larger trend. A pin bar is a candlestick with a tiny body and a long wick, signaling a sharp rejection of price
By itself, a pin bar often marks a potential reversal, but not all pin bars lead to profitable moves. To boost reliability, this strategy trades pin bars only when they align with the prevailing trend – for example, taking a bullish pin bar while the market is in an uptrend, or a bearish pin bar in a downtrend. The trend bias can be determined by a long-term moving average or higher timeframe analysis.
Why it works: In an uptrend, a bullish pin bar after a pullback often indicates that sellers tried to push price down but failed, and buyers are resuming control. Filtering for pin bars near key support or moving averages further improves odds of success. This aligns the entry with both a strong price pattern and the dominant market direction, yielding a higher win rate. The pin bar’s own structure provides natural levels for stop and target placement, keeping risk management straightforward.
Example Setup:
USDCHF - 4 Hour Chart
Trend SMA 12
Max Body - 34
Min Wick - 66
ATR -15
ATR Stop Loss Multiplier - 2.3
ATR Take Profit Multiplier - 2.9
Minimum ATR to Enter - 0.0025

Algoway V4.2📌 Algoway V4.2 — Multi-layered Strategy Powered by ADX, MACD & PSO
Overview
Algoway V4.2 is a layered algorithmic strategy designed for volatility-rich assets like cryptocurrencies. While some core components (such as PSO, MACD, and ADX oscillators) are adapted from known indicator models, the original logic, state tracking, and Candle Strength Oscillator (CSO) are fully custom-developed.
This strategy is not a simple combination of tools — it implements a conditional entry-exit logic system based on ADX zone transitions, momentum structure, and MACD/PSO signal synchronization, enhanced by custom-built CSO filtering.
🧠 Key Modules and How They Work Together
PSO (Premium Stochastic Oscillator)
Used to confirm local oversold/overbought pressure. Acts as a directional filter.
MACD (Normalized)
Volatility-normalized MACD values allow consistent signal detection even on volatile pairs. It triggers entries when momentum begins shifting.
ADX Zonal Logic
Divides the market into Range / MidRange / Trend Peak zones. Entries are allowed only under specific transitions — e.g., long entries only in yellow (low volatility) zones or in trend climax zones under certain pullbacks.
CSO (Candle Strength Oscillator) — Custom Module
Designed to measure real candle momentum and price structure consistency. It avoids false breakouts and filters trend fatigue.
🔁 How Logic Works
Strategy maintains state variables to track entry type and zone.
Exit conditions depend on the entry origin: entries from "Range" exit in "Peak", while "Peak" entries exit during pullbacks or mid-strength trend reversals.
Additional logic prevents entries when signals are not aligned across modules, minimizing noise.
Optional CSO module acts as a final microstructure confirmation before executing MACD-based midpoint entries.
📊 Example Parameters (for 5M crypto scalping)
Each module is tuned to respond to 5-minute crypto volatility:
Stochastic: fast response, tight thresholds
MACD: shortened EMAs, normalized
ADX: traditional smoothing, custom thresholds for zone switching
CSO: candle-based dynamic filter with visual zone mapping
🧪 Conclusion
Algoway V4.2 is not a script merger — it is a custom logic engine using familiar technical components but governed by a proprietary decision model, with additional filters and dynamic variable tracking.
It’s suitable for scalping or swing setups, and the internal logic is optimized for real trading conditions, not just visual backtests.

MACD + RSI + EMA + BB + ATR Day Trading StrategyEntry Conditions and Signals
The strategy implements a multi-layered filtering approach to entry conditions, requiring alignment across technical indicators, timeframes, and market conditions .
Long Entry Requirements
Trend Filter: Fast EMA (9) must be above Slow EMA (21), price must be above Fast EMA, and higher timeframe must confirm uptrend
MACD Signal: MACD line crosses above signal line, indicating increasing bullish momentum
RSI Condition: RSI below 70 (not overbought) but above 40 (showing momentum)
Volume & Volatility: Current volume exceeds 1.2x 20-period average and ATR shows sufficient market movement
Time Filter: Trading occurs during optimal hours (9:30-11:30 AM ET) when market volatility is typically highest
Exit Strategies
The strategy employs multiple exit mechanisms to adapt to changing market conditions and protect profits :
Stop Loss Management
Initial Stop: Placed at 2.0x ATR from entry price, adapting to current market volatility
Trailing Stop: 1.5x ATR trailing stop that moves up (for longs) or down (for shorts) as price moves favorably
Time-Based Exits: All positions closed by end of trading day (4:00 PM ET) to avoid overnight risk
Best Practices for Implementation
Settings
Chart Setup: 5-minute timeframe for execution with 15-minute chart for trend confirmation
Session Times: Focus on 9:30-11:30 AM ET trading for highest volatility and opportunity

Long Explosive V1The “Long Explosive V1” strategy calculates the percentage change in price from the last closing price of the candlestick, so that if it increases by a certain percentage it goes long, but if it decreases by another percentage it sends an exit order, so that the percentage limits above and below the current price function as inherent stop loss and take profit, with the benefit of taking advantage of the volatility of the bull market.
Entries and exits are always at the market and based on percentage changes in the price. Of course, the default configuration of the strategy considers a position with a 5% risk control, modest initial capital and standard commissions, which helps to obtain realistic results and protect the user from unexpectedly controlled potential losses.
It is again emphasized that it is always advisable to adjust the parameters of the strategy well, so that the risk-reward is well controlled.

RSI SwingRadar🧠 Strategy Overview
This long-only strategy combines RSI/MA crossovers with ATR-based risk management, designed for cleaner entries during potential bounce phases — especially tuned for assets like XMR/USDT.
🔍 Core Logic:
- RSI Crossover: Entry occurs when the 14-period RSI crosses above its 14-period SMA, signaling a potential shift in momentum.
- Oversold Filter: The RSI must have been below a user-defined oversold threshold (default: 35) on the previous candle, filtering for bounce setups after a pullback.
- ATR-Based Stop/Target: Stop-loss is placed below the low by a user-adjustable ATR multiplier (default: 0.5×). Take-profit is calculated with a Risk:Reward multiplier (default: 4×).
These elements work in tandem — RSI crossovers give momentum confirmation, oversold filtering adds context, and ATR-based exits adapt to volatility, creating a compact yet responsive strategy.
📉 Visuals:
- Dynamic Bands: The chart displays the active stop-loss, entry price, and take-profit as colored bands for easy visual tracking.
- Clean Overlay: Designed with simplicity — only confirmed setups are shown, keeping noise low.
✅ Suggested Use:
- Works best on XMR/USDT or similarly trending assets.
- Best suited for pullback entries during broader uptrends.
- Adjustable for different volatility conditions and asset behaviors.
⚠️ Disclaimer
- This strategy is for educational and research purposes only.
- It does not guarantee profitability in any market.
- Always backtest, forward-test, and understand your own risk tolerance before using any
strategy in a live environment.
- Past performance is not indicative of future results.
- This script is not financial advice.

Trend Surge with Pullback FilterTrend Surge with Pullback Filter
Overview
Trend Surge with Pullback Filter is a price action-based strategy designed to enter strong trends not at the breakout, but at the first controlled pullback after a surge. It filters out noise by requiring momentum confirmation and low volatility conditions, aiming for better entry prices and reduced risk exposure.
How It Works
A strong upward trend is identified when the Rate of Change (ROC) exceeds a defined percentage (e.g., 2%).
Instead of jumping into the trend immediately, the strategy waits for a pullback: the price must drop at least 1% below its recent high (over the past 3 candles).
A low volatility environment is also required for entry — measured using ATR being below its 20-period average multiplied by a safety factor.
If all three conditions are met (trend + pullback + quiet volatility), the system enters a long position.
The trade is managed using a dynamic ATR-based stop-loss and a take-profit at 2x ATR.
An automatic exit occurs after 30 bars if neither SL nor TP is hit.
Key Features
- Momentum-triggered trend detection via ROC
- Smart pullback filter avoids overbought entries
- Volatility-based filter to eliminate noise and choppy conditions
- Dynamic risk-reward ratio with ATR-driven exit logic
- Time-limited exposure using bar-based exit
Parameter Explanation
ROC Length (10): Looks for short-term price surges
ROC Threshold (2.0%): Trend is considered valid if price increased more than 2%
Pullback Lookback (3): Checks last 3 candles for price retracement
Minimum Pullback % (1.0%): Entry only if price pulled back at least 1%
ATR Length (14): Measures current volatility
Low Volatility Multiplier (1.2): ATR must be below this multiple of its 20-period average
Risk-Reward (2.0): Target is set at 2x the stop-loss distance
Max Bars (30): Trade is closed automatically after 30 bars
Originality Statement
This strategy doesn’t enter at the trend start, unlike many momentum bots. Instead, it waits for the first market hesitation — a minor pullback under low volatility — before entering. This logic mimics how real traders often wait for a better entry after a breakout, avoiding emotional overbought buys. The combined use of ROC, dynamic pullback detection, and ATR-based environment filters makes it both practical and original for real-world trading.
Disclaimer
This strategy is intended for educational and research purposes. Backtest thoroughly and understand the logic before using with real capital.

Volatility Pulse with Dynamic ExitVolatility Pulse with Dynamic Exit
Overview
This strategy, Volatility Pulse with Dynamic Exit, is designed to capture impulsive price moves following volatility expansions, while ensuring risk is managed dynamically. It avoids trades during low-volatility periods and uses momentum confirmation to enter positions. Additionally, it features a time-based forced exit system to limit overexposure.
How It Works
A position is opened when the current ATR (Average True Range) significantly exceeds its 20-period average, signaling a volatility expansion.
To confirm the move is directional and not random noise, the strategy checks for momentum: the close must be above/below the close of 20 bars ago.
Low volatility zones are filtered out to avoid chop and poor trade entries.
Upon entry, a dynamic stop-loss is set at 1x ATR, while take-profit is set at 2x ATR, offering a 2:1 reward-to-risk ratio.
If the position remains open for more than 42 bars, it is forcefully closed, even if targets are not hit. This prevents long-lasting, stagnant trades.
Key Features
✅ Volatility-based breakout detection
✅ Momentum confirmation filter
✅ Dynamic stop-loss and take-profit based on real-time ATR
✅ Time-based forced exit (42 bars max holding)
✅ Low-volatility environment filter
✅ Realistic settings with 0.05% commission and slippage included
Parameters Explanation
ATR Length (14): Captures recent volatility over ~2 weeks (14 candles).
Momentum Lookback (20): Ensures meaningful price move confirmation.
Volatility Expansion Threshold (0.5x): Strategy activates only when ATR is at least 50% above its average.
Minimum ATR Filter (1.0x): Avoids entries in tight, compressed market ranges.
Max Holding (42 bars): Trades are closed after 42 bars if no exit signal is triggered.
Risk-Reward (2.0x): Aiming for 2x ATR as profit for every 1x ATR risk.
Originality Note
While volatility and momentum have been used separately in many strategies, this script combines both with a time-based dynamic exit system. This exit rule, combined with an ATR-based filter to exclude low-activity periods, gives the system a practical edge in real-world use. It avoids classic rehashes and integrates real trading constraints for better applicability.
Disclaimer
This is a research-focused trading strategy meant for backtesting and educational purposes. Always use proper risk management and perform due diligence before applying to real funds.

SOXL Trend Surge v3.0.2 – Profit-Only RunnerSOXL Trend Surge v3.0.2 – Profit-Only Runner
This is a trend-following strategy built for leveraged ETFs like SOXL, designed to ride high-momentum waves with minimal interference. Unlike most short-term scalping scripts, this model allows trades to develop over multiple days to even several months, capitalizing on the full power of extended directional moves — all without using a stop-loss.
🔍 How It Works
Entry Logic:
Price is above the 200 EMA (long-term trend confirmation)
Supertrend is bullish (momentum confirmation)
ATR is rising (volatility expansion)
Volume is above its 20-bar average (liquidity filter)
Price is outside a small buffer zone from the 200 EMA (to avoid whipsaws)
Trades are restricted to market hours only (9 AM to 2 PM EST)
Cooldown of 15 bars after each exit to prevent overtrading
Exit Strategy:
Takes partial profit at +2× ATR if held for at least 2 bars
Rides the remaining position with a trailing stop at 1.5× ATR
No hard stop-loss — giving space for volatile pullbacks
⚙️ Strategy Settings
Initial Capital: $500
Risk per Trade: 100% of equity (fully allocated per entry)
Commission: 0.1%
Slippage: 1 tick
Recalculate after order is filled
Fill orders on bar close
Timeframe Optimized For: 45-minute chart
These parameters simulate an aggressive, high-volatility trading model meant for forward-testing compounding potential under realistic trading costs.
✅ What Makes This Unique
No stop-loss = fewer premature exits
Partial profit-taking helps lock in early wins
Trailing logic gives room to ride large multi-week moves
Uses strict filters (volume, ATR, EMA bias) to enter only during high-probability windows
Ideal for leveraged ETF swing or position traders looking to hold longer than the typical intraday or 2–3 day strategies
⚠️ Important Note
This is a high-risk, high-reward strategy meant for educational and testing purposes. Without a stop-loss, trades can experience deep drawdowns that may take weeks or even months to recover. Always test thoroughly and adjust position sizing to suit your risk tolerance. Past results do not guarantee future returns. Backtest range: May 8, 2020 – May 23, 2025

Momentum Long + Short Strategy (BTC 3H)Momentum Long + Short Strategy (BTC 3H)
🔍 How It Works, Step by Step
Detect the Trend (📈/📉)
Calculate two moving averages (100-period and 500-period), either EMA or SMA.
For longs, we require MA100 > MA500 (uptrend).
For shorts, we block entries if MA100 exceeds MA500 by more than a set percentage (to avoid fading a powerful uptrend).
Apply Momentum Filters (⚡️)
RSI Filter: Measures recent strength—only allow longs when RSI crosses above its smoothed average, and shorts when RSI dips below the oversold threshold.
ADX Filter: Gauges trend strength—ensures we only enter when a meaningful trend exists (optional).
ATR Filter: Confirms volatility—avoids choppy, low-volatility conditions by requiring ATR to exceed its smoothed value (optional).
Confirm Entry Conditions (✅)
Long Entry:
Price is above both MAs
Trend alignment & optional filters pass ✅
Short Entry:
Price is below both MAs and below the lower Bollinger Band
RSI is sufficiently oversold
Trend-blocker & ATR filter pass ✅
Position Sizing & Risk (💰)
Each trade uses 100 % of account equity by default.
One pyramid addition allowed, so you can scale in if the move continues.
Commission and slippage assumptions built in for realistic backtests.
Stops & Exits (🛑)
Long Stop-Loss: e.g. 3 % below entry.
Long Auto-Exit: If price falls back under the 500-period MA.
Short Stop-Loss: e.g. 3 % above entry.
Short Take-Profit: e.g. 4 % below entry.
🎨 Why It’s Powerful & Customizable
Modular Filters: Turn on/off RSI, ADX, ATR filters to suit different market regimes.
Adjustable Thresholds: Fine-tune stop-loss %, take-profit %, RSI lengths, MA gaps and more.
Multi-Timeframe Potential: Although coded for 3 h BTC, you can adapt it to stocks, forex or other cryptos—just recalibrate!
Backtest Fine-Tuned: Default settings were optimized via backtesting on historical BTC data—but they’re not guarantees of future performance.
⚠️ Warning & Disclaimer
This strategy is for educational purposes only and designed for a toy fund. Crypto markets are highly volatile—you can lose 100 % of your capital. It is not a predictive “holy grail” but a rules-based framework using past data. The parameters have been fine-tuned on historical data and are not valid for future trades without fresh calibration. Always practice with paper-trading first, use proper risk management, and do your own research before risking real money. 🚨🔒
Good luck exploring and experimenting! 🚀📊
