Session Value Ribbon [EXCAVO]Anchored volume-weighted mean with a harmonic value ribbon and HTF confluence
The Session Value Ribbon plots a volume-weighted mean of price and a volatility-scaled sigma envelope, then partitions the space between them into a harmonic value ribbon (0.236, 0.382, 0.5, 0.618, 0.786). Three anchor modes let the wave adapt to any chart: Rolling (a sliding N-bar window, default), Timeframe (classical anchored VWAP that resets each session), and Date (fixed anchor). A second accumulator on a slower reference timeframe runs the same math and plots as an HTF confluence line for multi-scale reads.
This is not a basic VWAP indicator. The ribbon layers, the volatility-regime scaling of the sigma bands, the HTF confluence overlay, and the auto-resolver that picks the anchor from the chart timeframe turn a single-line mean into a full value map of the current session.
━━━━━━━━━━━━━━━━━━━━━━━━━━━━━━━━━━━━━━━
▸ HOW TO USE
Step 1 → Add the indicator. The anchored mean, sigma envelope
and value ribbon draw immediately on whatever anchor
mode is selected (Rolling by default).
Step 2 → Read the mean as fair value for the active anchor.
Price above the mean = participants are bidding higher
than the anchor-window average; price below = lower.
Step 3 → Watch the outer sigma bands. A close beyond them
means price is stretched from fair value; the ribbon
layers below act as pullback shelves.
Step 4 → Use ribbon layers as intraday shelves. The 0.5 layer
is the midpoint between mean and outer band; the 0.236
layer sits close to the mean; the 0.786 layer sits
close to the outer band. Look for stalls and false
breaks at each layer.
Step 5 → Cross-check with the HTF confluence line. When the
primary mean and the HTF mean converge, price is in a
multi-scale value zone; when they diverge, one session
is running ahead of the other.
Step 6 → Read the dashboard for anchor mode, current mean,
distance from mean in sigmas, slope regime and bar
count since the anchor.
━━━━━━━━━━━━━━━━━━━━━━━━━━━━━━━━━━━━━━━
▸ HOW IT CALCULATES
◆ Volume-Weighted Mean
The mean is a running weighted average of the selected price source. Weights come from volume with three modes: Full uses raw volume (classical MIDAS weighting), Root uses the square root of volume (dampens single-bar spikes so one huge candle cannot drag the mean), and None uses equal weight (the mean degenerates to a plain arithmetic average of the source).
◆ Anchor Modes
Rolling accumulates over a sliding N-bar window (default 200 bars), so the wave is always N bars long regardless of chart timeframe. Timeframe resets the accumulator on each boundary of the chosen anchor timeframe (Daily by default), matching the behaviour of a classical anchored VWAP. Date locks the anchor to a specific timestamp and keeps accumulating forever after.
◆ Sigma Envelope
Sigma is computed from the anchor-window weighted variance, E − (E )². The outer bands are drawn at ±sigmaMultiplier × sigma around the mean. Optional Volatility Regime Adjust multiplies sigma by an ATR-relative factor, bounded between 0.7x and 1.4x, so the bands breathe with the current activity state, giving tighter bands in quiet regimes and wider bands in wild ones.
◆ Harmonic Value Ribbon
The space between the mean and each outer band is split into harmonic layers at 0.236, 0.382, 0.5, 0.618 and 0.786 of the sigma distance. The ribbon is rendered as a progressive-opacity fill, not as separate labelled lines, so the eye reads a continuous value gradient instead of a stack of horizontal ledger lines.
◆ HTF Confluence Layer
A second accumulator runs the exact same math on the next slower anchor timeframe (Rolling with a longer window when the primary is Rolling; the next-slower TF step when the primary is Timeframe). The HTF mean plots as a thin coloured line. When the primary mean and the HTF mean align, price is in a multi-scale value zone.
◆ Slope-Based Regime Classifier
The classifier measures the slope of the primary mean over the slope-lookback window and normalises it by ATR. If |slope|/ATR exceeds the slope threshold (default 0.05 xATR), the ribbon and mean tint bull or bear. Below the threshold the regime is flat and the palette stays neutral.
━━━━━━━━━━━━━━━━━━━━━━━━━━━━━━━━━━━━━━━
▸ WHAT MAKES IT DIFFERENT
◆ Chart-Timeframe Auto-Resolver
The anchor timeframe is resolved automatically from the chart timeframe, so the wave shape stays consistent across intraday, swing and position TFs without manual tuning.
◆ Volatility-Regime Scaling
The sigma envelope adapts to activity state instead of being fixed at a static multiplier. Tight regimes contract the bands, wild regimes widen them, with a bounded 0.7x to 1.4x multiplier so the visual stays stable.
◆ Harmonic Ribbon as Progressive Fill
The intra-band space is drawn as a smooth value gradient rather than a stack of horizontal lines. Layer count is user-selectable (Harmonic 3, 5 or 7).
◆ HTF Confluence Overlay
A second anchored mean on the next slower timeframe plots as a companion line so multi-scale value alignment is visible without a second indicator on the chart.
◆ Distance-In-Sigma Readout
A right-edge readout reports the current mean and the current distance from mean in sigmas, so the extreme readings are legible without measuring.
◆ EXCAVO Overlay Visual
Chart-anchored overlay only, with no pane oscillator and no floating badges. The wave, ribbon and HTF line share a single tonal palette that stays out of the way of price action.
━━━━━━━━━━━━━━━━━━━━━━━━━━━━━━━━━━━━━━━
▸ DASHBOARD
Real-time panel (top right by default) with all key metrics:
Anchor - active anchor mode with its parameter (Rolling N, Timeframe TF, or Date)
Mean - current value of the anchored mean
Distance - price distance from mean in sigmas, signed
Regime - Up / Down / Flat classification from the slope-based regime engine
Bars in Anchor - bar count since the anchor started accumulating
Legend table (bottom left) explains every glyph and colour used on the chart. Toggle in Dashboard settings.
━━━━━━━━━━━━━━━━━━━━━━━━━━━━━━━━━━━━━━━
▸ SETTINGS
Anchor
Anchor Mode - Rolling (default), Timeframe, or Date
Rolling Length (bars) - 200 (window used in Rolling mode)
Anchor Timeframe - D (used in Timeframe mode)
Anchor Date - 01 Jan 2025 (used in Date mode)
Source
Price Source - (H+L+C)/3 (typical price)
Volume Weight - Full (raw volume) - Root (square root of volume) - None (equal weight)
Sigma Bands
Sigma Multiplier - 2.0 (band distance in sigmas)
Volatility Regime Adjust - OFF (ATR-scaled sigma with 0.7x-1.4x bounds)
Value Ribbon
Show Value Ribbon - ON
Ribbon Set - Harmonic 5 (0.236 / 0.382 / 0.5 / 0.618 / 0.786)
Ribbon Opacity Base - 80
Show Zone Fill - ON
Zone Fill Opacity - 88
HTF Confluence
Enable HTF Confluence - ON (draws a second mean from the next slower anchor)
Regime Coloring
Slope Regime Coloring - ON
Slope Lookback - 20 bars
Slope Threshold (xATR) - 0.05
Visualization
Bull Color - deep blue
Bear Color - red
Flat Color - neutral grey
HTF Confluence Color - amber
Show Right-Edge Readout - ON
Dashboard
Show Dashboard - ON
Dashboard Position - Top Right
Show Legend - ON
━━━━━━━━━━━━━━━━━━━━━━━━━━━━━━━━━━━━━━━
▸ ALERTS
Directional alerts only.
Price Crossed Above Anchored Mean - close crosses over the primary anchored mean
Price Crossed Below Anchored Mean - close crosses under the primary anchored mean
━━━━━━━━━━━━━━━━━━━━━━━━━━━━━━━━━━━━━━━
Built on MIDAS anchored VWAP (Paul Levine, 1990s), extended with three anchor modes (Rolling / Timeframe / Date), selectable volume weighting, volatility-regime scaling of the sigma bands, a harmonic ribbon rendered as a progressive-opacity fill, an HTF confluence layer, a slope-based regime classifier, and a right-edge distance-in-sigma readout.
Best regards,
EXCAVO
Disclaimer
Trading involves significant risk. This indicator is a technical analysis tool
and does not constitute financial advice, investment recommendations, or a
guarantee of future results. Past indicator behavior does not guarantee future
performance. Always use proper risk management and your own judgment.
Penunjuk

VWAP Control Shift Map [AGPro Series]VWAP Control Shift Map
🧠 Core Idea
Has VWAP control shifted from mean reversion to directional acceptance?
📌 Overview / What it does
VWAP Control Shift Map is a VWAP control and acceptance visualization tool built to identify when price is balanced around value, accepted above control, accepted below control, or rejected back into the VWAP band.
The script builds a rolling volume-weighted control line, maps a VWAP control band, labels acceptance and rejection events, and summarizes the current VWAP state in a compact AG Pro panel.
This script does not predict future price direction, automate trades, or provide guaranteed buy/sell signals. It is a structured decision-support map for VWAP control, acceptance quality, mean-reversion risk, and shift context.
🎯 Purpose & Design Philosophy
VWAP is one of the most watched value references across intraday and swing trading contexts.
The problem is that price can cross VWAP many times without meaningful control transfer. This script was built to separate casual VWAP interaction from stronger acceptance, rejection, and reversion behavior.
The design philosophy is to make VWAP context visually readable: where control sits, which side is accepted, whether reversion risk is rising, and whether the shift has quality.
⚡ Why This Script Is Different
Most VWAP tools plot a line, add bands, and leave interpretation entirely to the user.
This script does NOT simply mark every VWAP touch as important and does NOT treat every cross as a trend signal.
Instead, it frames VWAP as a control zone: acceptance above, acceptance below, rejection back into value, and mean-reversion risk are all organized into one visual map.
⚙️ Methodology
1. VWAP Control Detection
The script calculates a rolling volume-weighted control line using price and volume over the selected control window.
2. Control Band Mapping
It builds a volatility-adjusted band around VWAP to represent the current value-control area.
3. Acceptance Evaluation
Consecutive closes outside the band are used to identify directional acceptance.
4. Rejection Evaluation
If price returns into the band after a shift, the script marks VWAP rejection behavior.
5. Visual Output
The chart displays the VWAP control line, bordered control zone, centered band label, event labels, right-side state tags, and AG Pro panel.
🗺️ How to Read the Chart
The VWAP control line represents the rolling volume-weighted value reference.
The control band represents the active VWAP acceptance area.
Labels mark acceptance, rejection, and mean-reversion events.
Right-side tags show the current control state and shift quality.
The panel summarizes VWAP control, acceptance state, control side, reversion risk, shift quality, control band, and next context.
🚦 Signals & States
• VWAP BALANCE → price has not established a clear accepted side
• ACCEPT ABOVE → price has accepted above the VWAP control band
• ACCEPT BELOW → price has accepted below the VWAP control band
• VWAP REJECTION → a control shift returned back into the band
• REVERSION RISK → price is back inside the band after a directional control state
🔔 Alerts Logic
VWAP Control Shift Up alert triggers when price accepts above the VWAP control band.
VWAP Control Shift Down alert triggers when price accepts below the VWAP control band.
VWAP Rejection alert triggers when price returns back into the band after a control shift.
Alerts are attention markers. They are not trade instructions.
🧩 Confluence Logic
The context becomes stronger when acceptance direction, VWAP slope, distance from VWAP, and candle body pressure align.
The context becomes weaker when price quickly returns into the control band after an attempted shift.
📊 When to Use
• VWAP-based intraday analysis
• Swing charts where volume-weighted value remains relevant
• Mean-reversion versus directional acceptance decisions
• Markets with liquid volume and clean price structure
• Trend continuation or failed acceptance review
⚠️ When NOT to Use
• Very illiquid symbols
• Markets with unreliable volume
• Extremely noisy low-timeframe charts
• News shock environments where VWAP control changes abruptly
• Any context where a single indicator is being used without broader structure
🎛️ Key Inputs
• VWAP Control Length → controls the rolling volume-weighted control window
• Band Volatility Length → controls how the band width is calculated
• Control Band Multiplier → adjusts VWAP control band width
• Acceptance Bars → defines how many closes are needed for acceptance
• Rejection Window → controls failed-shift timing
• Visual settings → control the panel, zone, labels, font sizes, and projection
🖥️ Interface & Visual Design
The interface is designed for clean, premium chart reading.
The VWAP band uses visible four-edge zone boundaries so the control area remains clear in both editor and published TradingView views.
The panel uses the AG Pro merged blue header standard and keeps the current context readable without covering the main chart.
🧪 Practical Usage Workflow
1. Read the panel state.
2. Check whether price is inside, above, or below the VWAP control band.
3. Review acceptance or rejection labels.
4. Compare shift quality with reversion risk.
5. Use broader market structure before making any decision.
🔍 Interpretation Guidelines
VWAP control is not a prediction.
Acceptance shows where price has spent enough time outside the control band to suggest directional control.
Rejection shows that the attempted control shift returned back toward value.
Mean-reversion risk increases when price moves back into the VWAP control area after directional acceptance.
🚫 What This Script Is NOT
This script is not a prediction engine.
It is not financial advice.
It is not an auto-trading system.
It does not guarantee profitable trades.
It does not replace risk management or independent analysis.
⚠️ Limitations & Transparency
VWAP behavior can vary by timeframe, market session, liquidity, and volume quality.
Rolling VWAP control may differ from exchange-session VWAP or anchored VWAP tools.
Extreme volatility can temporarily reduce the usefulness of control-band interpretation.
Outputs should always be interpreted within broader market context.
🧠 Market Context Notes
VWAP often works as a value reference, but value can shift when acceptance becomes persistent.
A clean control shift is stronger when price accepts outside the band while VWAP slope supports the move.
A weak shift often returns back into the band and becomes a rejection or mean-reversion context.
🧾 Use Case Examples
When price accepts above the VWAP control band with strong shift quality, the chart may be showing directional control above value.
When price accepts below the band and VWAP turns down, the control context may favor downside acceptance.
When price quickly returns into the band after acceptance, VWAP rejection risk becomes more important.
🧱 System Philosophy
AGPro Series tools are built to convert complex market behavior into visual decision maps.
The goal is not certainty. The goal is structured context, cleaner interpretation, and better chart discipline.
🔐 Non-Promise Statement
No script can know the future.
No signal is certain.
No visual state should be treated as a guaranteed outcome.
📉 Risk Disclosure
Trading involves risk.
Markets can move unexpectedly.
Users are responsible for their own decisions, risk management, and trade execution.
This script does not provide financial advice.
📚 Educational Note
This tool is intended for educational and analytical use. It can help traders study VWAP control, acceptance shifts, rejection behavior, and mean-reversion risk.
Penunjuk

Anchored VWAP Risk Ladder [AGPro Series]Anchored VWAP Risk Ladder
🧠 Core Idea
After an important market event, is price trading close to fair value or becoming extended relative to the anchored VWAP?
📌 Overview / What it does
Anchored VWAP Risk Ladder builds a volume-weighted average price from a selected anchor event and turns the distance from that anchor into a structured risk ladder.
The script displays anchored VWAP, volume-weighted deviation bands, right-side ladder tags, reclaim and lose labels, extension context, and a compact AG Pro panel with distance, score, risk ladder, and action state.
It does not predict price direction, automate trades, or claim that anchored VWAP will hold as support or resistance. It organizes event-based volume-weighted context into a readable chart framework.
🎯 Purpose & Design Philosophy
Anchored VWAP is often useful after a meaningful event, but raw AVWAP alone can be difficult to interpret without context.
This script was built to answer a practical question: how far is price from the anchored value area, and is that distance becoming useful, balanced, or risky?
The design supports traders who think in terms of anchored fair value, risk distance, reclaim behavior, and extension zones.
⚡ Why This Script Is Different
Most VWAP tools show a line and leave interpretation fully manual.
This script does NOT stop at plotting anchored VWAP.
Instead, it builds a complete risk ladder around the anchor, adds deviation context, scores reclaim or lose behavior, and summarizes the current state in a clean dashboard.
⚙️ Methodology
1. Anchor Detection
The script can anchor from manual time, high-volume events, swing pivots, session open, week open, or month open.
2. AVWAP Calculation
From the active anchor, the script accumulates volume-weighted price and volume-weighted variance to calculate anchored VWAP and deviation bands.
3. Risk Ladder Mapping
Distance from anchored VWAP is measured in ATR and deviation terms to classify whether price is near value, inside Band 1, inside Band 2, or extended.
4. Visual Output
The script plots AVWAP, upper/lower deviation bands, ladder fills, event labels, right-side tags, bar state color, and a dashboard.
🗺️ How to Read the Chart
The AVWAP rail represents the volume-weighted average price from the active anchor.
Deviation bands represent the ladder around anchored value.
Labels mark anchor events, AVWAP reclaim events, AVWAP lose events, and optional extension-risk conditions.
The panel shows:
• Anchor → current anchor type and age
• Distance → price distance from AVWAP in ATR
• Risk Ladder → current ladder zone and risk score
• Score → current context score and direction state
• Action → READY / MONITOR / WAIT / BLOCKED
🚦 Signals & States
• Anchor Locked → a new event anchor has been selected
• Ready Reclaim → price has reclaimed anchored VWAP with enough context score
• Ready Lose → price has lost anchored VWAP with enough context score
• Near AVWAP → price is close to anchored value
• Band 1 / Band 2 → price is moving away from anchored value
• Extended → distance from AVWAP is elevated
🔔 Alerts Logic
Alerts can trigger when a new anchor is locked, when price reclaims AVWAP, when price loses AVWAP, or when extension-risk conditions appear.
Alerts are attention markers only. They do not represent trade instructions or guaranteed outcomes.
🧩 Confluence Logic
The context becomes stronger when anchored VWAP reclaim or lose behavior aligns with relative volume, acceptable distance, and a clear ladder state.
The risk ladder helps separate balanced conditions from extension conditions.
📊 When to Use
• After high-volume market events
• Around earnings, news, breakout, or liquidation-style candles
• During trend continuation pullbacks
• When studying institutional average price context
• On liquid symbols with meaningful volume data
⚠️ When NOT to Use
• Very low-liquidity symbols
• Markets with unreliable or synthetic volume
• Extremely choppy conditions where anchors reset too often
• Situations where the selected anchor is not meaningful
• When using AVWAP as a standalone trading signal
🎛️ Key Inputs
• Anchor Mode → controls how AVWAP is anchored
• Manual Anchor Time → user-defined anchor timestamp
• High Volume Anchor Threshold → controls automatic high-volume anchors
• Deviation Band 1 / 2 → controls ladder width
• Extension Risk ATR → controls when distance becomes elevated
• Minimum Ready Score → controls reclaim or lose strictness
• Visual Settings → control bands, labels, tags, panel, and bar colors
🖥️ Interface & Visual Design
The interface is built for fast visual hierarchy.
AVWAP is the central reference, deviation bands define the risk ladder, right-side tags make the ladder readable, and the panel summarizes state without forcing the user to inspect every line manually.
🧪 Practical Usage Workflow
1. Choose the anchor mode
2. Read the active anchor and distance in the panel
3. Check whether price is near AVWAP or extended
4. Watch reclaim or lose labels around AVWAP
5. Use broader structure and risk context before making any decision
🔍 Interpretation Guidelines
Price near AVWAP often represents a balanced value area relative to the anchor.
Price far from AVWAP may represent stronger trend behavior, but it may also carry extension risk.
READY states mark meaningful reclaim or lose behavior, not certainty.
🚫 What This Script Is NOT
This script is not a prediction engine.
It is not an automated trading system.
It does not guarantee support, resistance, continuation, reversal, or profit.
It is not financial advice.
⚠️ Limitations & Transparency
Anchored VWAP quality depends heavily on anchor selection.
Different timeframes may produce different anchor timing and visual structure.
Volume data quality may vary between symbols, brokers, and exchanges.
Deviation bands are statistical references, not fixed market boundaries.
🧠 Market Context Notes
Anchored VWAP works best when the anchor represents a meaningful market event.
High-volume displacement, swing pivots, session opens, weekly opens, and monthly opens may each tell a different story.
The user should choose the anchor mode that best fits the market question.
🧾 Use Case Examples
When a high-volume candle creates a new anchor, the script tracks whether price remains near the anchored value area or begins to extend away from it.
When price reclaims AVWAP with enough score, the script marks a READY reclaim context.
When price loses AVWAP with enough score, the script marks a READY lose context.
🧱 System Philosophy
AGPro Series tools are built as decision-support engines.
The purpose is to structure market context into readable zones, states, scores, and risk references without turning analysis into blind signal-following.
🔐 Non-Promise Statement
No script can provide certainty.
No AVWAP level guarantees a reaction.
No signal guarantees continuation, reversal, or profit.
📉 Risk Disclosure
Trading involves risk.
Users are responsible for their own analysis, decisions, risk management, and execution.
This script is for educational and analytical purposes only and does not provide financial advice.
📚 Educational Note
Use this tool to study how anchored value, volume-weighted distance, deviation bands, reclaim behavior, and extension risk interact across different market conditions.
Penunjuk

VWAP Pullback Reclaim Planner [AGPro Series]VWAP Pullback Reclaim Planner
🧠 Core Idea
Has price pulled back into VWAP and reclaimed it with enough quality to deserve attention?
📌 Overview / What it does
VWAP Pullback Reclaim Planner is a volume-weighted price action tool designed to evaluate pullbacks around VWAP and highlight reclaim conditions with a structured readiness score.
The script maps VWAP, a pullback pocket, reclaim corridors, invalidation shelves, target rails, labels, and a compact AG Pro dashboard. It focuses on whether price has moved away from VWAP, reacted, and returned through the reference with enough quality.
It does not predict future price movement, automate trading, or provide buy/sell commands. It is a visual decision-support framework for reading VWAP reclaim context.
🎯 Purpose & Design Philosophy
This script was built for traders who use VWAP as a live market reference but need more structure than a single line on the chart.
Many VWAP tools show the average price only. This planner adds context: pullback depth, reclaim quality, reaction strength, room, invalidation, and next-action state.
The design philosophy is simple: make VWAP reclaim situations easier to read without turning them into mechanical signals.
⚡ Why This Script Is Different
Most tools focus on plotting VWAP as a static benchmark.
This script does NOT treat every VWAP touch as meaningful.
Instead, it waits for a pullback, checks reclaim behavior, scores the reaction, and then presents the result through zones, labels, target rails, and a clear READY / MONITOR / WAIT / INVALIDATED state.
⚙️ Methodology
1. Context Detection
The script builds an anchored VWAP from the selected anchor mode and monitors price distance from that volume-weighted reference.
2. Reference Mapping
It creates a VWAP pullback pocket using ATR depth so the zone adapts to current volatility.
3. Reaction Evaluation
When price reclaims VWAP after a pullback, the script evaluates close distance, wick response, body quality, relative volume, VWAP slope alignment, and freshness.
4. Visual Output
Qualified events are shown with reclaim labels, a reclaim corridor, invalidation shelf, target rails, right-side tags, and a panel summary.
🗺️ How to Read the Chart
VWAP line shows the active volume-weighted reference.
The shaded pocket around VWAP marks the pullback area where reaction quality is evaluated.
READY RECLAIM labels highlight reclaim events that pass the selected score threshold.
The reclaim corridor shows the active continuation area after a valid reclaim.
The invalidation shelf marks where the reclaim context weakens.
The AG Pro panel summarizes VWAP State, Reclaim Score, Pullback Quality, Room, and Action.
🚦 Signals & States
• READY RECLAIM → price reclaimed VWAP after a pullback with enough quality.
• VWAP PULLBACK → price is inside or beyond the pullback pocket and may deserve monitoring.
• INVALIDATED → an active reclaim context lost its invalidation shelf.
• READY → a qualified reclaim event is active.
• MONITOR → a reclaim or pullback context is active but not a fresh ready event.
• WAIT → no actionable VWAP reclaim context is active.
• BLOCKED → VWAP or volatility context is not valid enough for evaluation.
🔔 Alerts Logic
Bullish VWAP Reclaim Ready triggers when price reclaims VWAP upward after a valid pullback and score threshold is met.
Bearish VWAP Reclaim Ready triggers when price reclaims VWAP downward after a valid pullback and score threshold is met.
VWAP Pullback Watch triggers when price enters the pullback evaluation area.
VWAP Reclaim Invalidated triggers when an active reclaim loses its invalidation shelf.
Alerts are attention markers, not trade instructions.
🧩 Confluence Logic
The strongest contexts appear when pullback freshness, VWAP reclaim, wick response, close strength, relative volume, and VWAP slope alignment support the same direction.
When these factors align, the score improves and the panel shifts toward a clearer action state.
📊 When to Use
• Intraday sessions where VWAP is actively watched
• Trend pullbacks around a volume-weighted mean
• Post-move reclaim attempts after sharp reactions
• Markets with enough liquidity for VWAP to be meaningful
• Breakout continuation and mean-reclaim review
⚠️ When NOT to Use
• Very low liquidity markets
• Extremely noisy symbols with unreliable volume
• Markets with wide spread or thin candles
• News-driven spikes where VWAP context can change too quickly
• Symbols where volume data is missing or distorted
🎛️ Key Inputs
• Anchor Mode → controls whether VWAP resets by session, week, or month.
• Pullback Pocket Depth → changes how wide the VWAP pullback area becomes.
• Reclaim Buffer → requires price to reclaim beyond VWAP by a volatility-adjusted amount.
• Invalidation Shelf → controls the risk shelf after reclaim.
• Minimum Ready Score → sets how strict READY labels should be.
• Target Rails → control the projected T1 and T2 reference levels.
• Label Settings → control density, size, spacing, and visual clarity.
• Panel Settings → control panel visibility, location, theme, and font size.
🖥️ Interface & Visual Design
The interface is designed to keep the chart readable while still feeling premium and informative.
The panel provides the current state at a glance. Labels mark important reclaim events. Zones and rails show context without overwhelming the candles.
The visual hierarchy is built around VWAP first, reclaim quality second, and action state third.
🧪 Practical Usage Workflow
1. Read the panel state.
2. Check whether price is near the VWAP pullback pocket.
3. Look for READY RECLAIM labels and score quality.
4. Compare price with the reclaim corridor, invalidation shelf, and target rails.
5. Confirm the broader market structure before making any decision.
🔍 Interpretation Guidelines
A high score means the reclaim structure is cleaner according to the script's rules.
A low or missing score means the reclaim context is incomplete, weak, or not currently active.
The script is best interpreted with trend, liquidity, volatility, and higher-timeframe structure.
🚫 What This Script Is NOT
This script is not a prediction engine.
It is not a financial advisor.
It is not an automated trading system.
It does not guarantee entries, exits, profits, or outcomes.
⚠️ Limitations & Transparency
VWAP behavior can differ across symbols, sessions, and timeframes.
Volume quality matters. If volume data is unreliable, VWAP interpretation may weaken.
Fast volatility expansion can invalidate reclaim context quickly.
No rule-based tool can fully account for market news, liquidity shocks, or sudden structural changes.
🧠 Market Context Notes
VWAP often acts as a live reference for institutional positioning, intraday fairness, and reaction quality.
However, VWAP should not be read alone. The best use comes from combining VWAP reclaim structure with liquidity, trend, volatility, and support/resistance context.
🧾 Use Case Examples
When price pulls below VWAP, rejects lower prices, and reclaims VWAP with strong close quality, the script may mark a bullish reclaim context.
When price pushes above VWAP, fails to hold, and reclaims downward with strong reaction quality, the script may mark a bearish reclaim context.
🧱 System Philosophy
VWAP Pullback Reclaim Planner follows the AG Pro Series approach: convert a market concept into a structured decision map with context, score, risk reference, and visual clarity.
The goal is not to replace judgment. The goal is to make judgment easier.
🔐 Non-Promise Statement
No script can provide certainty.
No signal should be treated as guaranteed.
Outputs should always be interpreted with independent analysis and risk control.
📉 Risk Disclosure
Trading involves risk.
Market conditions can change quickly.
Users are responsible for their own decisions, risk management, and trade execution.
This script is for educational and analytical purposes only and does not provide financial advice.
📚 Educational Note
This script is designed to help traders study how VWAP pullbacks, reclaim attempts, and reaction quality behave across different market conditions.
Penunjuk

VWAP Cross Flow Engine [AGPro Series]VWAP Cross Flow Engine
🔹 OVERVIEW
VWAP Cross Flow Engine is a precision scoring system for price-to-VWAP
crossovers. Instead of treating every VWAP cross as a binary signal,
this indicator measures the QUALITY of each crossover event in real
time using a weighted composite score derived from momentum, volume
expansion and optional sigma-band confluence. The engine is designed
for intraday scalpers and swing traders who rely on VWAP as a dynamic
equilibrium reference and need a structured way to separate high-
conviction continuation crosses from low-quality noise flips.
The script plots an anchored Volume-Weighted Average Price line with
optional volume-weighted standard-deviation bands, detects every
price/VWAP crossover event, scores each one on a 0–100 scale and
visualizes the result through compact X markers, directional bar
coloring, a retrospective quality dashboard and a dynamic bias zone
anchored on the strongest crosses.
🔸 UNIQUE EDGE
Most VWAP-based tools stop at plotting the line and marking raw
crossovers. VWAP Cross Flow Engine adds a multi-factor quality layer
on top of the crossover itself:
• Every cross receives a composite score, not a pass/fail flag
• Momentum sub-score derived from RSI distance from 50 at cross bar
• Volume sub-score derived from current volume vs SMA baseline
• Optional confluence bonus when cross occurs beyond 2-sigma envelope
• Retrospective follow-through measurement in ATR units
• Session-aware counters with automatic daily-vs-higher-timeframe
label switching
• ATR-based cooldown filter that prevents label overlap on any
timeframe, not just bar-count cooldowns that fail on daily charts
The combination of live scoring + retrospective success tracking in a
single panel is the core differentiator. It allows the trader to both
filter new crosses and study the historical reliability of VWAP cross
behavior on any symbol and timeframe.
🔷 METHODOLOGY
1. VWAP CALCULATION
Volume-weighted average of HLC3 (configurable) anchored to the
Session, Week or Month boundary. Cumulative price*volume and
cumulative volume series are reset at every anchor change.
2. SIGMA BANDS (optional)
Volume-weighted variance computed as E − E ² where X is the
source price weighted by volume. Square root produces the true
volume-weighted standard deviation. 1σ and 2σ envelopes are drawn
around the VWAP line.
3. CROSS DETECTION
Standard ta.crossover / ta.crossunder between close and VWAP.
4. QUALITY SCORING
• Momentum sub-score: |RSI(14) − 50|, scaled to 0–40 range
• Volume sub-score: volume / SMA(20), capped at 3x, scaled 0–30
• Confluence bonus: +5 if prior bar touched the opposing 2σ band
• Total live score (max 70 or 75) is rescaled to 0–100
5. COOLDOWN FILTER
A new cross is only plotted if BOTH conditions are met:
• At least N bars since the last plotted cross
• At least K × ATR price distance from the last plotted cross
6. FOLLOW-THROUGH TRACKING
Each cross is stored with its direction, price and ATR at the time
of the event. After N bars, the displacement (in the cross
direction) is measured. Success rate and average follow-through
in ATR units are maintained inside a rolling lookback window.
7. QUALITY ZONE
A rectangle zone (0.8 × ATR tall by default, 60 bars long) is
drawn at every strong cross (score ≥ 70). The zone acts as a
dynamic bias area anchored on high-conviction VWAP interactions.
🔶 SIGNALS & ALERTS
The indicator fires five distinct alert conditions:
1. High-Quality VWAP Cross Up — bullish cross above the min quality
threshold with cooldown satisfied.
2. High-Quality VWAP Cross Down — bearish cross above the min quality
threshold with cooldown satisfied.
3. Strong VWAP Cross (≥70) — score 70 or higher; anchors a new
quality zone.
4. Price Reached +2σ Band — price extended to the upper sigma band
(optional, requires bands enabled).
5. Price Reached −2σ Band — price extended to the lower sigma band
(optional, requires bands enabled).
🔹 KEY INPUTS
VWAP Reference
• Source — price series used for VWAP (default HLC3)
• Anchor Type — Session / Week / Month
• Show VWAP Line
Sigma Bands
• Show Sigma Bands (default OFF)
• Inner Band Multiplier (default 1.0)
• Outer Band Multiplier (default 2.0)
Quality Engine
• Momentum (RSI) Length
• Volume Average Length
• Follow-Through Bars
• ATR Length
• Min Quality To Plot (default 50)
• Use Sigma Confluence Bonus
• Cooldown — Minimum Bars (default 5)
• Cooldown — Minimum ATR Distance (default 0.5)
Visuals
• Show Cross X Labels
• Show Target Projection (default OFF)
• Show Quality Zone
• Quality Zone Height (ATR) / Length (Bars)
• Color Bars By Cross Strength
• Auto Label Size (upscale on 1D+)
Panel
• Show Dashboard Panel
• Panel Position (6 positions)
• Panel Theme (Dark / Light)
• Panel Font Size
• Success Rate Lookback Bars
🔸 HOW TO USE
• INTRADAY SCALPING — use Session anchor on 5m–1h charts. Focus on
crosses scoring 70 or higher. The quality zone becomes a short-term
bias area: price holding above a bull zone mid-line tends to favor
continuation, breaks back through the mid-line tend to indicate
weakening conviction.
• SWING BIAS — use Week or Month anchor on 4h and daily charts. Treat
strong crosses as potential regime-shift events. Monitor the
Success Rate metric to calibrate expectations for the current
market and instrument.
• MEAN-REVERSION — enable sigma bands and confluence bonus. Crosses
that form after a 2σ stretch tend to score higher and mark
statistically meaningful reversal attempts.
• FILTER CALIBRATION — raise Min Quality To Plot to 60 or 70 for
high-selectivity environments; lower to 40 for noisier instruments
where you want earlier confirmation.
The dashboard gives at-a-glance context: how many crosses have fired
this session, how many were strong, what the historical win rate
looks like in the current lookback window, the average ATR-normalized
follow-through, and whether price is currently above or below VWAP.
🔷 LIMITATIONS & TRANSPARENCY
• This is NOT a strategy and does not generate buy/sell orders.
• Score is a quality filter, not a directional prediction. A high-
score cross still carries market risk and can fail.
• Follow-through statistics depend on lookback window size and
timeframe; adjust Success Rate Lookback to match your trading
horizon.
• Sigma bands require a reliable volume feed. On low-liquidity
instruments the bands may be noisy or meaningless.
• Anchored VWAP resets at each new anchor (Session / Week / Month);
early-in-anchor values use fewer samples and are less stable.
• The indicator repaints only within the cross bar itself (like any
crossover detector). Once a bar closes, the plotted cross and its
score are fixed.
🔶 RISK DISCLOSURE
This script is a technical analysis tool intended for educational
and analytical purposes. It does not constitute financial advice,
investment advice or a recommendation to buy or sell any asset.
Trading financial markets involves substantial risk of loss. Past
performance of any indicator is not indicative of future results.
Users are fully responsible for their own trading decisions and
should combine this tool with independent analysis and proper risk
management. Penunjuk

Session VWAP Reaction Engine [AGPro Series]Session VWAP Reaction Engine
Session VWAP Reaction Engine builds the active intraday session VWAP as a reaction anchor and classifies confirmed price behaviour around it into three clear event types — Reclaim, Bounce, and Reject — each validated by a configurable confirmation window, a minimum prior-side bar filter, and an optional VWAP slope alignment filter. A volatility-scaled reaction corridor, compact reaction zones, a session box, and a minimal right-side bias panel turn raw session flow into a clean, publication-ready read on acceptance, rejection, and continuation.
🔷 OVERVIEW
Most session VWAP tools simply plot the line. Session VWAP Reaction Engine goes further: it reads how price behaves around the line inside a selected session window (Asia, London, New York, or Custom) and labels that behaviour using three structural event classes:
• Reclaim — a confirmed cross and acceptance on the new side of session VWAP, after price has spent a minimum number of bars on the opposite side.
• Bounce — a test of the reaction corridor edge that closes back on the prevailing side, with body-range and slope alignment quality checks feeding a Strong / Clean / Weak strength read.
• Reject — a wick into session VWAP that fails to accept on the other side, resolving as pressure against the crossing attempt.
Each confirmed event paints a compact rectangular reaction zone, a single label near the zone, and updates a right-side bias panel so the current session's story is always readable at a glance.
🟦 WHAT MAKES IT DIFFERENT
▸ Event classification, not just a line. Reclaim, Bounce, and Reject are treated as distinct structural events — each with its own confirmation path and visual signature — instead of blending into a single "crossed VWAP" signal.
▸ Corridor-based reaction detection. Bounce and Reject use a volatility-scaled ATR corridor around session VWAP rather than a single-pixel touch, which matches how VWAP is typically tested in real intraday flow.
▸ Slope-aware trend filter. Optional VWAP slope alignment biases bounce events toward the prevailing session direction and filters out counter-flow reactions that tend to fail.
▸ Reaction Strength read. Bounces are classified Strong / Clean / Weak using body-to-range ratio, close location in range, and slope alignment — turning every bounce into a quality-graded event.
▸ Active-Only and Publish Focus visual modes. The chart stays clean by surfacing only the latest session and the latest confirmed reaction, with older structure fading or removed. Ideal for decision-making and presentation.
🟣 METHODOLOGY
1) Session anchor. The selected session (Asia / London / New York / Custom) resets a cumulative PV / V VWAP on every new session bar, giving a fresh reaction reference for that window.
2) Prior-side filter. Before any Reclaim or opposite-side reaction can qualify, price must have spent a minimum configurable number of bars on one side of session VWAP. This isolates structural interactions and rejects chop.
3) Reclaim confirmation. A raw cross must be followed by N consecutive confirmed closes on the new side (default 2) before the Reclaim is validated and painted.
4) Corridor reactions. A volatility-scaled corridor (ATR × user multiplier) around session VWAP defines where Bounce and Reject qualify. Bounces require a corridor-edge test plus a close back on the prevailing side with body confirmation; Rejects require a wick into session VWAP that closes on the originating side.
5) Bias and state synthesis. Live Bias (Bullish / Bearish Acceptance or Pressure, or Neutral Rotation) is derived from close position relative to VWAP and corridor. Reaction State reflects the latest confirmed event (Bullish Acceptance, Bearish Acceptance, Bounce Support, Bounce Resistance, Reject Pressure, Reject Lift).
6) Post-session context. After the session ends, the last session VWAP and corridor stay on the chart for a configurable number of bars so recent structure remains visible without polluting older history.
🟢 SIGNALS & ALERTS
Eight alertcondition hooks are provided, all bar-close confirmable:
• Bullish Session VWAP Reclaim Confirmed
• Bearish Session VWAP Reclaim Confirmed
• Bullish Session VWAP Bounce Confirmed
• Bearish Session VWAP Bounce Confirmed
• Bullish Session VWAP Reject Confirmed
• Bearish Session VWAP Reject Confirmed
• Reaction State Shifted Bullish
• Reaction State Shifted Bearish
A "Confirmed Alerts Only" toggle restricts firing to barstate.isconfirmed so alerts will not repaint before close.
🟡 KEY INPUTS
Session Engine
• Selected Session — Asia / London / New York / Custom
• Custom Session — HHmm-HHmm format (used when Custom is selected)
• Session Timezone — Exchange / UTC / London / New York / Singapore
Reaction Engine
• Reclaim Confirm Bars — number of confirmed closes required after a cross (default 2)
• Minimum Prior Side Bars — whipsaw filter on the opposite side before qualifying (default 2)
• Reaction Corridor Width (ATR) — half-width of the ATR corridor around VWAP (default 0.20)
• Reaction Zone Length (Bars) — how far a confirmed zone extends right (default 14)
• Use VWAP Slope Alignment — trend filter for bounce events (default on)
• VWAP Slope Lookback — slope estimation window (default 3)
• Post-Session Context Bars — how long last session structure stays visible (default 18)
Visual Story
• Active-Only Mode, Publish Focus Mode, Show Previous Reaction Ghost
• Show Session Box, Show VWAP Reaction Corridor, Show Confirmed Reaction Zone
• Show Reaction Label, Show Session VWAP, Show Right-Edge SVWAP Tag
• Visible History Bars (default 700), Label Font Size (default Normal)
Panel
• Show Bias Panel (top-right), Panel Font Size (default Normal)
Alerts
• Confirmed Alerts Only (default on)
🟠 HOW TO USE
1) Apply to any intraday timeframe (1m–4h). Session VWAP requires intraday data to anchor the session reference.
2) Choose the session that best fits your market focus — New York for US equities and US-hours crypto, London for FX and European hours, Asia for Asian-session flow, or a Custom window.
3) Watch the corridor as the session develops. Bounce and Reject events inside the corridor describe how the session is defending or failing the VWAP reference.
4) Use Reclaim events as session-context shifts — combine with your own structure (HTF trend, S/R, order flow) rather than treating them as standalone entries.
5) Read the right-side Bias Panel for a compact summary: Session Status, Bias, Last Reaction, Reaction Strength, Signal Age, Reaction State, and Latest Line status.
6) For screenshots and presentation use, keep Publish Focus Mode and Active-Only Mode enabled — older sessions fade and only the latest structure remains dominant.
🟤 LIMITATIONS & TRANSPARENCY
• Intraday-only. Session VWAP is meaningful only on intraday timeframes; on daily and higher, the indicator will remain idle.
• Session VWAP resets at the start of each selected session. Reactions are evaluated within that window only.
• Confirmed events use bar-close logic. Intra-bar touches of the corridor are not counted as events until the bar closes.
• Volume-dependent. Session VWAP uses symbol volume. On symbols without meaningful volume, VWAP accuracy will be limited.
• The Reaction Corridor is a volatility-scaled visual and detection band, not a support/resistance guarantee.
⚠️ RISK DISCLOSURE
This indicator is an analytical and visualisation tool. It is not a trading strategy, does not generate buy/sell recommendations, does not predict future price direction, and does not guarantee any specific outcome. All signals, zones, and panel readings describe past and current price behaviour around session VWAP, not forecasts.
Markets carry risk of loss. Always use independent risk management, position sizing, and your own trading plan. Past behaviour of any signal does not imply future performance.
Penunjuk

Fixed Range Control Box [AGPro Series]Fixed Range Control Box
🔹 Overview
Fixed Range Control Box isolates a single high-conviction price range on your chart and classifies who is in control inside it. The tool draws one clean hero box around the most recent structural range, places a volume-weighted Control Line inside it, and tracks state transitions in real time: Inside, Upper, Lower, or Failed. When price structurally breaks the box, the range freezes, locking the reference so you can study the aftermath without visual drift.
Four range-definition modes are available — Pivot, Lookback, Compression, and Manual-Date — so the tool adapts to discretionary range traders, systematic rotation traders, and anyone who wants a fixed reference zone for backtesting or journaling.
🔸 Unique Edge
Most range tools on TradingView draw many boxes and leave the user to guess which one matters. Fixed Range Control Box is built around a different philosophy: one range, one story, one decision. The hero box is the visual focus; historical ranges fade into the background; the Control Line tells you which side of the range is winning the statistical argument.
Three design choices separate this from standard range-box scripts:
- Volume-weighted Control Line. Rather than dropping a midpoint line, the Control Line is computed from the volume-weighted typical price across the life of the range, with an edge-fallback to midpoint if the line drifts too close to either boundary. This produces a structurally meaningful reference instead of a geometric one.
- Retrospective fill on range rebuild. When a new range is committed, the script walks back through the range window and retroactively computes touch count, hold quality, and the Control Line. You see a fully-formed box with accurate statistics the moment it appears, not an empty box that slowly populates.
- Freeze-on-failure. When price closes beyond the range and the state transitions to Failed, the box locks at the break bar. No more drifting endpoints on broken structures — the reference stays where the story ended.
🔷 Methodology
The script cycles through four stages on every bar:
1. Range detection. Depending on the selected mode, the script looks for a qualifying range: confirmed swing pivots (Pivot), rolling highest/lowest (Lookback), short-ATR over long-ATR compression (Compression), or a user-defined date window (Manual). Gating rules — minimum lifespan, minimum width percentage, and a failed-state cooldown — prevent rapid re-triggers on noisy conditions.
2. Commit and retrospective fill. Once a range qualifies, the script snapshots the old range into history, installs the new one, and walks back through the window to compute the Control Line, touch count, and hold quality in a single pass. No warm-up period.
3. State machine. Each confirmed bar feeds the state machine. Strict logic requires bar closes on one side of the Control Line for the configured number of bars before switching to Upper or Lower; a close beyond either range boundary transitions to Failed.
4. Rendering. On the last bar, the hero box, Control Line, origin marker, and state badge are rebuilt from scratch. Historical ranges persist as muted boxes up to a configurable cap.
🔶 Signals & Alerts
Three alert conditions cover the full range lifecycle:
- New Control Box. Fires once per bar close when a new range is committed.
- Line Reclaimed (Bull or Bear). Fires when state transitions into Upper or Lower control, confirming directional bias inside the range.
- Control Failed. Fires once when price closes beyond the range and the box is frozen.
All alerts use alert() calls with once-per-bar-close frequency.
🔹 Key Inputs
- Range Mode — Auto-Pivot, Auto-Lookback, Auto-Compression, or Manual-Date.
- Pivot Length / Lookback Bars / Compression Window — window controls for each detection mode.
- Min Range Lifespan / Min Range Width % — structural filters to suppress micro-ranges.
- Failed Cooldown — bars to wait after a broken range before searching for a new one.
- Strict Control Logic + Reclaim Confirmation — governs how the Control Line state machine transitions.
- Visual controls — fade old boxes, max boxes kept, show state badge, show range origin, future projection bars, panel and label font sizes.
🔸 How to Use
1. Start on your primary timeframe and select the Range Mode that matches your style: Pivot for discretionary swing structures, Lookback for mechanical windows, Compression for auto-locking onto consolidations, Manual-Date for backtesting a specific episode.
2. Tune Min Range Width % and Min Range Lifespan so only structurally meaningful ranges appear.
3. Read the panel top-down: Mode confirms what you are tracking, Control tells you which side of the Control Line is winning, Range Age and Touches describe maturity and confluence, Hold Quality summarizes how cleanly price has respected the range, and State shows the live classification.
4. Use alerts to monitor the range lifecycle without staring at the chart.
🔻 Limitations & Transparency
- This is an analytical tool, not a strategy. It does not generate buy or sell recommendations and does not compute entries, stops, or targets.
- Past range behavior does not forecast future range behavior. Structural breaks can occur at any time.
- In very thin or illiquid markets, the volume-weighted Control Line can drift toward a boundary; the edge-fallback defaults to midpoint to protect against degenerate cases.
- Auto-Compression mode requires sufficient ATR history; expect a warm-up period on very recent symbols.
- The script is overlay-only and does not access other timeframes.
🔶 Risk Disclosure
Nothing in this script constitutes financial advice. Trading involves substantial risk of loss and is not suitable for every investor. Always do your own research and manage risk appropriately. Penunjuk

Value Shift Ladder [AGPro Series]Value Shift Ladder
🔹 Overview
Value Shift Ladder is a market-structure mapping tool that extracts the most volume-accepted price shelves from a rolling lookback window and arranges them, in creation order, as the rungs of a ladder. Each rung is a volume-weighted zone where the market has recently spent the most time and traded the most contracts. The script then tracks how price interacts with every rung through a full Held → Broken → Reclaimed lifecycle and summarizes the entire chain into one readable ladder state: Rising, Falling, Mixed, Broken, Reclaiming, Building, or Neutral.
The goal is not to predict direction and not to produce buy or sell signals. The goal is to give the chart reader a continuously updated answer to one question: where is the market's current fair-value region, how is that region moving over time, and which prior value shelves are still relevant versus which have been abandoned. This makes the tool useful as a structural reference for volume-profile readers, auction-theory traders, and anyone who builds a bias from accepted-value migration rather than from trend lines or moving averages.
🔸 Unique Edge
Most volume-based tools either draw a single static profile snapshot, or plot every candidate level and leave the reader to filter. Value Shift Ladder does three things differently:
Multi-shelf chronological ladder. Instead of producing one value band, the script maintains a ranked set of up to eight volume-accepted shelves and arranges them in the order they were first registered. This preserves the migration history of accepted value instead of collapsing it into one average.
Proximity-gated visualization. Only shelves within a configurable ATR distance from current price are drawn on the chart, counted in the panel, and fed into the ladder direction state. Distant historical shelves exist in memory but do not clutter the chart or bias the readout — the ladder always reflects the value structure that is actually relevant to the current bar.
Adaptive, confidence-aware breaks. A shelf is not broken on a single close outside its band. Young shelves are strongly protected (3.0 × ATR), maturing shelves require a medium distance (1.5 × ATR), and fully-aged shelves use the user-defined break distance. Shelves that have been re-confirmed multiple times gain a 2× confidence multiplier on top of that, preventing established value regions from being lost to a single volatility spike.
🔸 Methodology
1) Volume Profile Construction
The script divides the rolling lookback window into equal price bins and distributes each bar's volume across every bin it touches, proportional to range coverage. Zero-range bars are assigned to their single bin. This produces a volume-weighted histogram of the lookback period.
2) Shelf Extraction
The top-K bins by volume are selected iteratively. After each pick, the chosen bin and its ATR-neighborhood are zeroed out before the next pick, enforcing a minimum separation between shelves and preventing a single high-volume cluster from dominating every rung. Each surviving bin becomes a shelf, anchored at its bin-center price.
3) Shelf Merging and Confidence
On every refresh, newly extracted shelves are checked against existing ones. If a new shelf falls within the ATR separation of an existing non-broken shelf, the existing shelf's volume is refreshed and its confidence score is incremented. Otherwise a new shelf is registered. Confidence is capped at ten and used downstream to scale break tolerance.
4) Lifecycle State Machine
Each shelf carries one of three states — Held, Broken, or Reclaimed. Held flips to Broken when price closes beyond an adaptive break distance for three recent bars. Broken flips to Reclaimed when price dwells back inside the band for a user-defined number of bars. Reclaimed auto-promotes to Held once the shelf has stabilized past a short age threshold.
5) Ladder Direction
Proximity-filtered active shelves are sorted by creation order. The last one, two, or three rungs are compared to produce a single state: Rising if the sequence is monotonically higher, Falling if lower, Mixed if non-monotonic, plus transient overrides for Broken, Reclaiming, Building, or Neutral conditions.
6) Pruning
Stale broken shelves expire after a timeframe-aware window. A hard cap of ten active shelves is enforced, with broken shelves removed first when the cap is hit.
🔹 Signals and Alerts
The script provides four deterministic state-change alerts, all tied to closed-bar transitions:
— New Ladder Step Formed: fires when a new volume-accepted shelf is first registered.
— Ladder Step Held: fires when an existing shelf is re-confirmed by the rolling profile.
— Ladder Step Broken: fires when a held shelf transitions to broken.
— Ladder Step Reclaimed: fires when a broken shelf transitions back to reclaimed.
These alerts describe structural state changes inside the indicator logic. They are not trade signals and do not imply expected profitability, win rate, or directional certainty.
🔸 Key Inputs
— Profile Mode (Auto / Manual): Auto derives lookback and refresh from the chart timeframe. Manual exposes both for full control.
— Manual Lookback (bars): Size of the rolling window used to build the profile.
— Manual Refresh Interval (bars): How often the profile is rebuilt.
— Profile Resolution (bins): Number of price bins the range is divided into.
— Target Shelf Count: Maximum number of shelves kept active.
— Min Volume Ratio: Minimum fraction of the top-bin volume a bin must hold to qualify as a shelf.
— Min Shelf Separation (ATR): Minimum ATR distance between two shelves.
— Break Distance (ATR): Fully-aged break tolerance.
— Reclaim Dwell Bars: Bars needed inside the band to flip Broken to Reclaimed.
— Max Visible Distance (ATR): Proximity gate for drawing and counting shelves.
— Display options: panel position, panel font size, on-chart label size, alerts toggle.
🔹 How to Use
Value Shift Ladder is designed as a structural reference rather than a signal engine. Typical reading workflows include:
— Bias framing. Read the Ladder state first. Rising or Falling indicates a one-sided migration of accepted value; Mixed indicates balance; Broken or Reclaiming highlights an active transition.
— Dominant reference. The Dominant row in the panel highlights the nearest held or reclaimed shelf within two ATR of price. Use it as the closest structural reference for scenario planning, not as an execution level.
— Proximity discipline. Because shelves more than the configured ATR distance away are not drawn, the ladder always reflects value structure that is currently relevant. When no shelves are visible, the market is between value regions — a context in which mean-reversion assumptions weaken.
— Confluence. The tool is designed to be combined with independent confirmation such as session structure, higher-timeframe bias, or volume analysis. It is not meant to stand alone as a decision source.
🔸 Limitations and Transparency
— Volume profile quality depends on the instrument's volume reporting. On symbols with unreliable or synthetic volume, shelf placement may drift.
— The profile is recomputed on the close of refresh bars. Intrabar readings on the current bar can change until the bar closes; state transitions evaluate the last three bars for breaks and the reclaim-dwell window for reclaims, so fresh transitions can flip until those bars close.
— On extremely illiquid sessions or instruments with frequent volatility spikes, the adaptive-break logic can delay transitions by design. This is a tradeoff in favor of stability.
— Past structural behavior at a shelf does not guarantee future behavior. The tool does not forecast direction and is not a trading strategy.
🔹 Risk Disclosure
This script is a structural visualization tool provided for educational and analytical purposes. It is not financial advice, not a trading strategy, and not a signal service. All trading involves risk of loss. Past market behavior is not indicative of future results. Users are fully responsible for their own trading decisions and for independently verifying the tool's behavior on their chosen instruments and timeframes before relying on it for any purpose. Penunjuk

Multi-Anchor VWAP Grid [AGPro Series]Multi-Anchor VWAP Grid
🔹 Overview
Multi-Anchor VWAP Grid is a volume-weighted analysis tool that plots five independently anchored VWAP lines on the same chart — anchored from swing high, swing low, higher-timeframe pivot, all-time high, and session open. Each anchored VWAP includes optional ±1σ and ±2σ standard deviation bands, forming a dynamic grid of volume-weighted support and resistance levels. When three or more VWAPs converge within a tight ATR-based band, the indicator draws a rectangular confluence zone highlighting the area as a higher-probability price reaction region.
The script is fully automatic. All five anchors are detected by internal engines (pivot detection, session detection, timeframe change detection, all-time-high tracker) and require no manual date picking or retroactive anchor placement. Install the indicator, select which anchors you want active, and the grid builds itself.
🔹 What It Does Differently
Most anchored VWAP tools plot one anchor at a time and require the user to manually place the anchor each time a new swing or event is identified. This script plots five anchors simultaneously and lets them compete for relevance. When multiple independent anchors agree on a price level, that agreement itself becomes the signal — visualized as a confluence zone. A single VWAP is one data point. Five VWAPs intersecting within 0.5 ATR of each other is a structural event.
The confluence detection engine tests each active VWAP as a reference point, counts how many others fall within the user-defined ATR tolerance, and picks the densest cluster on each bar. A minimum VWAP count threshold (default 3) prevents noise, and a lifecycle manager extends, adaptively resizes, and expires zones based on bar age and midpoint drift.
🔹 Methodology
**Anchor engines**
Swing High and Swing Low VWAPs reset on each confirmed pivot using the standard ta.pivothigh / ta.pivotlow detector with a configurable lookback length. HTF Pivot VWAP resets at the start of each selected higher-timeframe period (daily, weekly, or monthly) using timeframe.change. ATH VWAP resets whenever a new all-time high is printed on the visible chart. Session Open VWAP resets at the first bar of each trading session defined by the session window input.
**VWAP calculation**
Each anchor maintains three running accumulators since its last reset: sum of (price × volume), sum of volume, and sum of (price² × volume). VWAP is computed as the first divided by the second. Standard deviation is derived from the variance identity: sqrt(E − E ²), where E and E are computed from the running accumulators. Bands are plotted at configurable multipliers of this running standard deviation.
**Confluence engine**
On each bar, the script evaluates every active VWAP as a potential cluster center. For each candidate center, it counts how many other active VWAPs fall within ATR × tolerance distance. The cluster with the highest count wins. If the winning count meets or exceeds the minimum threshold, the bar is marked as confluence-active.
**Zone lifecycle**
When confluence becomes active, a new rectangular zone is created spanning the min/max of the clustered VWAPs. As long as confluence remains active and the cluster midpoint drifts less than 0.5 ATR from its original midpoint, the zone extends to the current bar and adaptively resizes with rate-limited expansion (maximum 1 ATR growth per bar per direction, preventing erratic stretching). If the midpoint drifts more than 0.5 ATR, a new zone is created. A 5-bar debounce prevents micro-breaks in confluence from prematurely closing active zones. Zones auto-expire after a configurable age limit (default 120 bars).
🔹 Signals and Panel Readouts
The information panel in the top-right corner (position and theme configurable) displays:
- **Price Bias** — count of VWAPs price is currently above vs below, with an overall BULL / BEAR / MIXED classification
- **Confluence** — current status (active with cluster count, or none) and the minimum-count threshold in use
- **Closest VWAP** — which of the five VWAPs is currently closest to price, and the distance in ATR units
- **Active VWAPs** — each enabled VWAP's current value and percent distance from close
Two alert conditions are built in: new confluence zone detection, and price crossing any active VWAP line.
🔹 Key Inputs
**Anchor Points group** — toggle each of the five VWAPs on or off, set swing pivot lookback length, choose HTF timeframe (D/W/M), define the session window for intraday anchoring.
**Deviation Bands group** — toggle bands on or off, configure band 1 and band 2 multipliers, enable or disable gradient fills between VWAP and the first band.
**Confluence Zones group** — toggle zones on or off, set minimum VWAPs required for a confluence (2 to 5), adjust the ATR-based tolerance, define maximum zone age in bars.
**Panel group** — toggle panel, choose location (six positions), select Dark or Light theme, set font size (Small / Normal / Large).
**Labels group** — toggle the compact end-of-line labels that identify each VWAP at the right edge of the chart.
🔹 How to Use
This indicator is designed as a context layer, not a standalone entry signal. Suggested workflow:
**1. Identify structural bias.** Check the Price Bias row in the panel. If 4 or 5 VWAPs sit below price (BULL), the market is trading above its most relevant volume-weighted averages across multiple timeframes and event contexts. The opposite applies for BEAR.
**2. Watch for confluence formation.** When the panel shows Confluence ACTIVE with 3 or more VWAPs clustered, a meaningful volume-weighted support or resistance area is forming. These zones often precede reaction or reversal behavior.
**3. Use bands for context.** When price trades near the ±1σ band of a single VWAP, reversion back toward that VWAP is statistically more likely. ±2σ extensions indicate volatility outliers.
**4. Cross-reference with your own tools.** This script is most useful combined with price action, volume profile, or a trend filter of your choice. It does not generate entries or exits on its own.
🔹 Tips
- On crypto 24h markets, set Session Window to 0000-2359 for a full-day session VWAP.
- Higher Swing Pivot Length values (30–50) filter noise on higher timeframes; lower values (10–15) are better for intraday.
- If the chart feels visually crowded, disable the ±2σ bands or reduce the number of active anchors. All five are rarely needed simultaneously.
- For the strongest confluence signals, increase Min VWAPs for Confluence to 4 — rarer but higher conviction.
🔹 Limitations and Transparency
- The script uses standard Pine Script pivot detection for swing anchors. Pivots are confirmed only after the pivot length has passed, which means swing VWAP anchors are placed retrospectively by that many bars. This is an inherent limitation of all pivot-based tools, not a bug.
- ATH tracking is limited to the visible chart range. On timeframes or symbols where the chart does not load full history, the "ATH" anchor represents the highest point within loaded data, not the true all-time high.
- Standard deviation bands assume price dispersion around each VWAP is approximately normal over the anchored period. In strongly trending markets, this assumption weakens and bands may widen significantly.
- Confluence zones are descriptive, not predictive. They mark areas where multiple volume-weighted averages happen to agree. They do not guarantee price reaction, only indicate where reaction is more plausible than average.
- Session Window input must match the instrument's trading hours to produce a meaningful intraday VWAP. Incorrect session definitions will produce misleading anchor points.
🔹 Risk Disclosure
This indicator is provided for educational and analytical purposes only. It is not financial advice, investment advice, or a recommendation to buy, sell, or hold any asset. All trading involves substantial risk of loss. Past chart behavior and historical VWAP reactions do not guarantee future results. Users are solely responsible for their own trading decisions and risk management. Always combine indicator output with independent analysis and appropriate position sizing. The author accepts no responsibility for any financial outcome resulting from the use of this script. Penunjuk

AG Pro Anchored VWAP Event Map [AGPro Series]AG Pro Anchored VWAP Event Map
Overview / What it does
AG Pro Anchored VWAP Event Map is an overlay built to organize price action around Anchored VWAP after a meaningful starting point has been defined. Instead of treating VWAP as a single static reference, this script focuses on the relationship between price and a chosen anchor, then maps how the market behaves after that anchor is established. The goal is not to forecast price, but to make post-anchor structure easier to read in a consistent visual framework.
The script supports three anchor paths: Open, Swing, and Event. Open mode can reset the anchor from a daily, weekly, or monthly opening context. Swing mode rebuilds the anchor from a confirmed pivot high or pivot low. Event mode is designed for expansion-type situations and can anchor from a range expansion, a volume spike, or a breakout impulse. This creates a flexible workflow for traders who want to study how price responds to AVWAP under different structural conditions without switching tools.
Once the anchor is set, the script plots the Anchored VWAP, builds a distance band around it, tracks reclaim and reject behavior, and summarizes the current post-anchor bias in a compact panel. The result is a clean event map that can be used to study acceptance, rejection, recovery, or continuation around an anchored reference level. It is meant to simplify interpretation, not replace market context.
A key design goal of this script is clarity. The visual package is intentionally structured so the anchor, AVWAP path, distance zone, signal labels, and bias panel can be read together without turning the chart into a dense signal board. In practice, that means the indicator is most useful when it is treated as a contextual decision-support tool rather than a standalone trigger engine.
Unique Edge
The main distinction of this script is that it is not built as a generic VWAP overlay. Its emphasis is on post-anchor behavior. That means the visual logic starts from the selected anchor event and then evaluates how price interacts with the anchored VWAP afterward. In other words, the anchor is not only a starting point for the line itself; it is the center of the script's interpretation model.
Another differentiator is the combination of multiple anchor sources within one workflow. Traders can use opening-session logic, confirmed swing logic, or event-driven logic depending on the type of market behavior they are studying. This makes the indicator suitable for different styles of chart review while keeping the interface straightforward.
The distance band adds a second layer of structure. Rather than reading only the AVWAP line, users can also see whether price is operating close to the reference, stretched around it, or reacting from the upper or lower band zone. This helps frame whether a move appears to be re-accepting the anchored average, rejecting away from it, or trading in a more extended state.
The script also tries to keep the signal layer readable through selective label logic. Reclaim and reject markers are not intended to flood the chart. They are there to mark notable interactions with the anchored framework, while the panel provides a compact summary of the active anchor, current bias, distance, and latest signal state.
Methodology
The script begins by defining an anchor source. In Open mode, the anchor can be tied to a daily, weekly, or monthly opening transition. In Swing mode, the script waits for a confirmed pivot high or pivot low based on the selected swing length. In Event mode, the anchor is created only when a qualifying market event appears according to the selected event model.
For event-based anchoring, the script can use one of three internal conditions. Range Expansion looks for directional range behavior relative to ATR and recent structure. Volume Spike looks for directional participation with higher-than-average volume and a meaningful candle body fraction. Breakout Impulse looks for directional movement through recent extremes with supportive range and volume characteristics. These are practical anchor candidates for traders who want the AVWAP to begin from a meaningful change in behavior rather than from a calendar reset.
After the anchor is created, the script calculates Anchored VWAP using cumulative price-volume data relative to that anchor point. From there, it builds a distance band around the AVWAP. The band can be defined by ATR or percentage mode, depending on whether the user prefers a volatility-based or proportional framework.
Post-anchor bias is then derived from a simple internal score. The script evaluates whether price is above or below AVWAP, whether the AVWAP slope is improving or weakening, and whether price is trading beyond the distance band. This produces a practical Bullish, Bearish, or Neutral state. The intention is not to compress market structure into a perfect score, but to provide a compact directional read that can be used alongside the chart.
Reclaim and reject logic is based on how price interacts with the AVWAP and the surrounding band after the anchor is active. A reclaim highlights price moving back through the anchored reference with confirmation, while a reject highlights failure or pushback behavior around the band area. These events are intended as structural observations rather than guaranteed trade setups.
Signals & Alerts
The script includes reclaim and reject signal logic for both directions. These labels are designed to call attention to notable interactions with the anchored framework after the selected anchor becomes active. In practical use, reclaim behavior can be interpreted as a sign that price is attempting to re-establish acceptance relative to AVWAP, while reject behavior can suggest rejection away from the mapped zone.
Because market structure can become noisy, the script also includes signal spacing and density controls to reduce repetitive label clutter. This is especially relevant when anchored conditions remain active for long periods and price repeatedly tests the same area. The goal is to preserve readability while still marking relevant interactions.
Alert conditions are included for bullish reclaim, bearish reclaim, bullish reject, bearish reject, and a broader any-signal state. These alerts are deterministic within the script's ruleset, but they should still be used as workflow tools rather than interpreted as self-sufficient trading instructions.
Key Inputs
Anchor Source:
Choose whether the indicator should anchor from Open, Swing, or Event logic.
Open Anchor Type:
In Open mode, select daily, weekly, or monthly opening context.
Swing Length:
Controls how confirmed pivot highs and lows are detected in Swing mode.
Event Type:
In Event mode, choose between Range Expansion, Volume Spike, or Breakout Impulse as the anchor trigger model.
Event Lookback / Multipliers / Cooldown:
These inputs control how strict the event selection becomes and how frequently new event anchors can appear.
Band Mode:
Switch between ATR-based and percentage-based distance bands.
ATR Band Multiplier / Percent Band:
Define the width of the distance zone around Anchored VWAP.
Signal Density:
Helps regulate how aggressively reclaim and reject labels are displayed.
Panel and Label Size:
Allows the visual layout to remain readable across different chart styles and screen sizes.
Show Anchor Label / Show Anchor Level / Show Bias Ribbon:
These toggles control the visibility of anchor-focused visual elements and optional bias coloring.
Limitations & Transparency
This script is an interpretation aid. It does not identify the single correct anchor for all market environments. Different anchor choices can lead to different AVWAP paths, different reclaim or reject readings, and different conclusions. That is normal, and it is one of the reasons the script provides multiple anchor modes.
Event-based anchors depend on internal threshold logic such as ATR expansion, volume conditions, and breakout behavior. On some symbols or timeframes, those filters may trigger more frequently or less frequently than expected. Users may need to adjust event sensitivity and band settings to fit the market they are analyzing.
Reclaim and reject states are rule-based. They are not a guarantee of continuation, reversal, or follow-through. In sideways conditions, repeated AVWAP interactions can occur without producing a sustained directional move. The script can help organize those interactions visually, but it cannot remove market uncertainty.
The post-anchor bias is intentionally simplified. It is designed for readability, not for complete market classification. It should be read together with broader price structure, higher-timeframe context, liquidity conditions, and user-defined execution rules.
Risk Disclosure
This indicator is for chart analysis and workflow support. It does not provide financial advice, investment advice, or guaranteed outcomes. Markets involve risk, and any trading or investing decision remains the sole responsibility of the user.
No indicator can remove uncertainty from live markets. Anchored VWAP, reclaim behavior, reject behavior, and bias states are analytical references only. They should be validated with independent judgment, risk management, and broader market context before being used in any decision-making process.
Use this script as a structured visualization tool, not as a promise of performance or a substitute for disciplined trade planning.
Penunjuk

AG Pro VWMA Dislocation Map [AGPro Series]AG Pro VWMA Dislocation Map
OVERVIEW
AG Pro VWMA Dislocation Map is a state-based charting tool designed to measure how far price is trading from its volume-weighted mean, how persistent that displacement has become, and whether the move is still expanding or beginning to normalize.
This script is built around a simple but often underexplored idea: distance from a moving average is not equally meaningful in all situations. A small deviation can matter when it is persistent and building under directional participation, while a larger deviation can become less informative when the move is already mature and beginning to contract. Instead of treating every separation from the mean as identical, this script organizes that behavior into a structured framework.
The result is a visual map centered on VWMA behavior rather than a classic crossover model. The goal is not to guess tops or bottoms, and it is not to replace broader market structure analysis. The goal is to help the user read displacement quality, persistence, and normalization pressure around a volume-weighted equilibrium reference.
This makes the script useful in two very different but related contexts. In intraday use, it can help identify when a move is still building away from the mean versus when extension may already be mature. In swing use, it can help frame whether price is holding a healthy distance from its weighted mean or rotating back toward equilibrium.
WHAT MAKES IT DIFFERENT
This script is not presented as “another moving average” and it is not intended to function as a simple VWMA trend filter. Its design focus is the behavior around VWMA, not the line by itself.
The main distinction is the state model. Instead of reducing the chart to a binary above/below interpretation, the script tracks whether displacement is mild, active, persistent, extended, overextended, re-approaching, or rebalanced. That adds context to moves that may otherwise look similar at first glance but are materially different in maturity and behavior.
A second distinction is normalization. Raw distance in price units can be misleading across different symbols, different volatility conditions, and different phases of the same market. For that reason, the script evaluates displacement relative to a normalization unit rather than using absolute price distance alone. This is intended to make the map more comparable and more structurally meaningful.
A third distinction is presentation. The indicator is designed as a chart-reading framework, with a central weighted-mean structure, layered displacement bands, background state context, a last-bar state label, and a compact information panel. The output is meant to be descriptive and contextual rather than promotional or predictive.
METHODOLOGY
The script begins with a VWMA reference built from user-defined length and source settings. Around that reference, it measures normalized price displacement. The normalization can be based on ATR, standard deviation, or a hybrid approach, depending on the selected mode.
From there, the script derives several internal components:
1. Distance
This reflects how far price is trading from the VWMA after normalization. The purpose is to measure relative displacement rather than raw tick or point difference.
2. Persistence
This tracks how long the current directional displacement has remained active. A move that has stayed consistently above or below the weighted mean for multiple bars may carry a different interpretation than a one-bar separation.
3. Expansion
This evaluates whether the displacement is still building. Rising displacement can indicate that price is not merely away from the mean, but continuing to separate from it.
4. Normalization
This evaluates whether the displacement is beginning to contract toward the mean. It does not forecast reversal by itself. It is intended to show whether the existing separation is losing expansion pressure and moving into a more balanced phase.
5. Regime
The script also classifies contextual slope behavior into a simplified regime reading. This is not meant to be a full market regime engine. It is a compact contextual aid for distinguishing broader trend-like conditions from quieter or more balanced environments.
These components feed the state engine and the panel metrics. The result is not a claim of certainty, but a structured way to read where price is operating relative to a volume-weighted center.
STATE MODEL
The indicator organizes behavior into discrete chart states. These states are designed for interpretation, not for deterministic outcome prediction.
Balanced
Price is trading close to the VWMA and displacement is limited.
Early Dislocation
Price is beginning to separate from the weighted mean, but the move is still in an early stage.
Persistent Dislocation
Distance is no longer only emerging; it has remained active for a more sustained period.
Extended
The move has reached a stronger separation from the mean and may require more caution in interpretation.
Overextended
Displacement is extreme relative to the current normalization model. This does not mean price must reverse immediately. It indicates an elevated extension condition.
Re-approaching
Distance is beginning to contract and the move may be rotating back toward VWMA equilibrium.
Rebalanced
Price has moved back toward the mean after a prior displacement phase.
The practical value of this model is that it helps separate fresh movement from mature movement. Two charts can both be above VWMA, but one may be in an early building phase while another may already be extended and normalizing.
HOW TO READ THE PANEL
The information panel is designed to provide a quick summary of the current state without overwhelming the chart.
Score
A composite reading of displacement behavior. This is a contextual score, not a performance metric and not a probability estimate.
Bias
A directional summary based on price relative to VWMA.
Regime
A simplified context tag derived from the weighted-mean behavior.
Distance
The current normalized displacement from VWMA.
Persistence
The number of bars associated with the current directional displacement run.
Normalization
A compact measure of contraction pressure toward the weighted mean.
Footer interpretation
A short descriptive line showing the current qualitative state context and whether displacement is expanding or contracting.
The panel is intended to summarize current conditions, not to replace full chart reading.
VISUAL STRUCTURE
The chart output is designed to be read in layers.
The central weighted-mean structure provides the equilibrium reference.
The inner visual structure highlights the core region around VWMA.
The displacement bands expand outward to show increasingly stretched conditions relative to the normalization thresholds.
The background tint provides a broad state cue so users can quickly identify periods of balance, active displacement, or higher extension.
The last-bar state label is included to make the current state readable at a glance without scanning the full panel.
This layered design is intentional. It allows the script to remain visually expressive while still communicating a hierarchy: center, displacement, extension, and normalization.
HOW THIS TOOL MAY BE USED
Some users may apply the script as a continuation context tool. In that workflow, the focus is less on exact entries and more on whether a move is still developing in a healthy way away from the weighted mean.
Some users may apply it as an extension-awareness tool. In that workflow, the purpose is to identify when a move may already be mature and when aggressive continuation assumptions deserve more caution.
Others may use it as a mean-normalization context tool. In that workflow, the interest is not whether price is simply above or below VWMA, but whether the separation is holding, expanding, or rotating back toward equilibrium.
Because of this flexibility, the script is not restricted to one market style. It can be used as an analytical overlay in trending markets, in rotational conditions, or as part of a broader discretionary review process.
SIGNALS AND ALERTS
The script includes alerts tied to state transitions and context changes. These alerts are descriptive events based on the model, not trade promises.
Persistent Dislocation
Triggers when the script enters the Persistent Dislocation state.
Extended
Triggers when the script enters the Extended state.
Overextended
Triggers when the script enters the Overextended state.
Re-approaching
Triggers when the script enters the Re-approaching state.
Rebalanced
Triggers when price rotates back toward the weighted mean after prior displacement.
Score Threshold Cross
Triggers when the composite score crosses above the user-defined threshold.
Bias Flip
Triggers when directional bias flips across VWMA.
These alerts are intended to support monitoring and workflow organization. They should be interpreted in the context of the broader chart.
KEY INPUTS
VWMA Length
Controls the length of the volume-weighted mean.
Normalization Mode
Selects whether normalized displacement is built from ATR, standard deviation, or a hybrid of the two.
Normalization Length
Controls the lookback used in the normalization engine.
Distance Smoothing
Adjusts smoothing applied to the displacement behavior.
Regime Lookback
Controls the lookback used in the regime context calculation.
State Thresholds
Define how mild, active, strong, and extreme displacement are classified.
Persistence Confirmation Bars
Helps distinguish brief separation from more sustained displacement.
Re-Approach Confirmation Bars
Controls how quickly the script recognizes contraction back toward the mean.
Visual Settings
Allow the user to manage bands, background context, VWMA visibility, line strength, opacity behavior, and label placement.
Panel Settings
Allow layout, position, theme, and text sizing adjustments.
The script is intended to be configurable so the same framework can be adapted to different symbols and timeframes without changing its core logic.
LIMITATIONS AND TRANSPARENCY
This script does not predict future price direction.
It is not a standalone trading system, not an execution engine, and not a substitute for full chart analysis.
A strong displacement can remain strong for longer than expected. An overextended reading does not guarantee immediate reversal. A re-approaching or rebalanced state does not guarantee that a larger directional move has ended.
Like any normalized framework, the output depends on the settings chosen by the user. Different symbols, timeframes, volatility environments, and threshold selections can meaningfully change the visual behavior and state classification.
The script should be understood as a descriptive map around a volume-weighted mean, not as a promise of edge by itself.
RISK DISCLOSURE
This indicator is for analytical and educational charting use only.
It does not provide financial advice, investment advice, or guaranteed outcomes.
All trading and investing involve risk. Users should evaluate any signal, state change, or alert in the context of their own process, market conditions, risk controls, and independent judgment.
AG Pro VWMA Dislocation Map is designed to help structure interpretation around VWMA displacement behavior. It is not designed to remove uncertainty from markets, and it should not be used as the sole basis for financial decisions.
Penunjuk

ATR Trailing Stops for Hyperliquid Spot + Perps [HYPR-run]DESCRIPTION:
A drop-in ATR trailing exits module. Four architectures that maximize
profit on winning trades using volume weighted volatility instead of fixed levels or
plain ATR. Built modular; the trailing logic is self-contained so you
can drop it into any existing indicator or strategy as a plug-and-play
exits block. Two independent stops (long/short), spot and perps.
DISCOVERING EDGE
ATR trailing exits are popular, everyone uses them, but this indicator doesn't just trail on volatility, it trails on meaningful volatility that very few people measure. In order to gain a persistent, mechanical edge in how winners run and protect capital on the trades that don't work, we explored a more meaningful expression of ATR trailing exits.
VOLUME-WEIGHTED ATR vs PLAIN ATR
Plain ATR treats every candle equally. Volume-weighted ATR will only expand stops when volume validates the volatility, preventing premature exits on noise and letting winners run further on real moves. Over hundreds of trades this single difference can compound in the spirit of letting winners run further, losers stay controlled versus fixed levels or vanilla ATR.
- Four modes (A3.1, A4.0, A4.1, A4.2) cover different trailing
behaviors: ratcheting, chandelier anchor, free-floating, and raw
baseline. All size stop distance from volatility, not fixed levels.
- Modular engine. The trailing logic is self-contained; drop it into
any existing indicator or strategy as a plug-and-play exits block.
- Alerts fire built-in JSON webhook payloads. Paste your webhook URL,
create the alert, execute on the exchange of your choice.
ATR MODES
A3.1: LinReg + plain ATR, no ratchet. The baseline. Linear regression
projects where price is heading, plain ATR sets the distance. Stop moves
freely in both directions. Use as a reference or when you want a raw
trailing stop.
A4.0: LinReg + VWATR + Efficiency Ratio + ratchet (default). The
all-rounder. Volume-weighted ATR discounts low-liquidity candles. The
Efficiency Ratio (Kaufman) measures trend quality: in a clean trend it
widens the stop to let price run; in chop it tightens. Ratchet floor
means the stop only moves in your favor.
A4.1: Chandelier + VWATR + ratchet + first-bar multiplier. Anchored to
the highest high (longs) or lowest low (shorts). First-bar multiplier
sets a tighter initial stop, then the standard multiplier takes over as
the ratchet locks in gains. Use when entering off key levels.
A4.2: LinReg + VWATR, no ratchet. Same as A4.0 but without ratchet
floor or Efficiency Ratio. Stop moves freely with the projection, giving
the trade room through consolidation at the cost of less locked profit.
FEATURES
- Four ATR architectures selectable via dropdown
- Volume-weighted ATR: low-liquidity candles contribute less
- Efficiency Ratio: tightens in chop, widens in trend (A4.0)
- Ratchet floor: stop only moves in your favor (A4.0, A4.1)
- First-bar multiplier for tighter initial protection (A4.1)
- Separate ATR lookbacks for longs and shorts
- Separate multipliers for longs and shorts
- Two-bar confirmation prevents single-wick fakeouts
- Gradient fill between price and stop (intensifies near danger)
- Stop line color shifts with ATR regime (green stable, amber expanding)
- Ratchet circles mark each new locked-in level on the stop line
- Dashboard: mode, stop price, gap %, ER, VWATR %, regime state
- Dark/light theme toggle for any chart background
- Independent long/short alert toggles
- No JSON snippet needed; close payload is built into the script
HOW IT WORKS
Volume-weighted ATR scales each bar's true range by its volume relative
to the lookback average. High-volume bars contribute more; thin candles
contribute less. This prevents low-liquidity spikes from inflating stop
distance. Separate lookbacks for longs (default 14) and shorts (default
26) reflect that crypto drops faster than it climbs.
The Efficiency Ratio measures directional movement versus noise on a 0-1
scale. It scales the ATR multiplier between 0.8x (choppy) and 1.2x
(trending), adapting stop width to market regime. Only active in A4.0.
Two-bar confirmation requires a confirmed close beyond the stop level.
A single wick does not trigger the exit. The cross must hold for at
least one additional bar close.
ALERTS
Close Long fires as SPOT (sell spot position). Close Short fires as
PERPS (close short; spot is long-only). Toggle each independently.
Alert payload is built into the script as JSON; works with any webhook
receiver that accepts market/ticker/position fields.
CREDITS
ATR: J. Welles Wilder (1978)
Efficiency Ratio: Perry Kaufman Penunjuk

AG Pro VWAP Reclaim Quality [AGPro Series]AG PRO VWAP RECLAIM QUALITY
OVERVIEW
AG Pro VWAP Reclaim Quality is a chart-first tool built to evaluate whether a move back above VWAP is clean, weak, delayed, or structurally fragile.
This script does not treat every recovery above VWAP as equally meaningful. Instead, it grades the reclaim event itself and then follows what happens next: whether price can hold above VWAP, whether the retest is constructive, and whether the reclaim deteriorates shortly after recovery.
The objective is simple: separate efficient VWAP reclaims from noisy or late recoveries that may look promising at first glance but fail to show durable acceptance.
This makes the script useful for traders who want more context than a basic VWAP cross. A standard cross can show that price moved from one side of VWAP to the other. This script is designed to evaluate the quality of that transition.
UNIQUE EDGE
The focus here is not generic VWAP direction bias and not a simple above/below state model.
The main edge of the script is its reclaim-quality framework. It evaluates the reclaim as a sequence rather than as a one-line event:
1) reclaim strength,
2) post-reclaim acceptance,
3) retest behavior,
4) timing quality,
5) failure risk.
That structure is what differentiates it from ordinary VWAP cross tools.
A reclaim that closes back above VWAP with a strong bar, holds acceptance, and survives a disciplined retest should not be treated the same as a reclaim that occurs late, stalls immediately, or fails after a shallow recovery. This script is designed to reflect that distinction visually and systematically.
In practical terms, the script attempts to answer a more specific question:
Is this reclaim simply back above VWAP, or is it actually behaving like a higher-quality recovery?
METHODOLOGY
The script starts by tracking session VWAP and identifying reclaim attempts after price has spent time below it.
Once a reclaim is detected, the script evaluates several components:
1) Reclaim strength
The reclaim bar is assessed using distance from VWAP, body efficiency, and close location within the bar. This helps distinguish decisive recoveries from marginal crosses.
2) Acceptance above VWAP
After the reclaim, the script measures whether price is actually holding above VWAP over the next bars. Stable acceptance is treated differently from mixed or poor acceptance.
3) Retest behavior
The script checks whether price revisits VWAP inside a defined tolerance area and whether that test is held constructively. A confirmed retest is handled as separate information rather than being merged blindly into the initial reclaim.
4) Timing quality
Reclaims that occur after an extended stay below VWAP, or later in the intraday session, can be penalized. This allows the script to separate timely recoveries from delayed ones.
5) Failure logic
A reclaim can later be downgraded if price loses structure below VWAP after the recovery. This failure layer is intentionally more selective so that minor noise is not treated as a meaningful reclaim breakdown.
The result is a compact grading model that produces a readable chart-first output instead of a large diagnostic dashboard.
HOW TO READ THE OUTPUT
Main chart labels:
- CLEAN: reclaim quality is strong and structurally healthy
- LATE: reclaim occurred, but timing quality is weaker or delayed
- RT HOLD: VWAP retest was revisited and held constructively
- FAILED: reclaim lost quality and broke down after recovery
Panel fields:
- VWAP Reclaim: current reclaim classification
- Reclaim: strength of the reclaim move itself
- Acceptance: quality of post-reclaim holding behavior
- Retest: whether a constructive retest is confirmed
- Bias: summary interpretation of the current reclaim state
- Quality: compact score representation
The chart is intentionally designed to stay visual and readable. The panel provides state context, while the labels highlight the important transition points.
SIGNALS AND ALERTS
The script includes alert conditions for:
- Clean Reclaim
- Late Reclaim
- Retest Hold
- Failed Reclaim
These alerts are intended to map to the reclaim lifecycle rather than to every minor VWAP interaction.
For more conservative usage, bar-close confirmation is generally preferable when evaluating reclaim quality, especially on volatile instruments or during rapid intrabar movement.
KEY INPUTS
Some of the main controls include:
- VWAP source
- ATR length
- reclaim distance normalization
- minimum prior bars below VWAP
- late reclaim thresholds
- acceptance lookback
- retest tolerance and retest window
- failure delay bars
- panel text size and panel theme
- label visibility and label discipline controls
The script also includes label filtering logic to reduce clustering and keep the chart cleaner by default.
WHAT THIS SCRIPT IS DESIGNED FOR
This script is designed for traders who want to evaluate reclaim quality around VWAP, not merely track whether price is above or below it.
Typical use cases may include:
- reviewing whether a recovery above VWAP has enough structural follow-through
- filtering weak reclaims from stronger continuation candidates
- identifying retest discipline after reclaim
- spotting delayed or fragile recovery behavior
- keeping a cleaner visual workflow around VWAP-based chart reading
LIMITATIONS AND TRANSPARENCY
This script is not a prediction engine and should not be interpreted as a guaranteed continuation model.
A reclaim labeled as clean can still fail.
A reclaim labeled as late can still continue.
A failed reclaim label does not automatically imply a larger bearish trend.
The tool is designed to classify reclaim behavior around VWAP, not to replace broader market structure analysis.
Like all chart-based tools, outputs can vary depending on instrument, volatility regime, timeframe, and user settings.
VWAP-based behavior is also context-dependent. Market environment, liquidity, trend phase, and volatility expansion can all influence reclaim behavior beyond what a single script can capture.
This script is therefore best used as a structured interpretation tool, not as a standalone decision framework.
RISK DISCLOSURE
This indicator is for chart analysis and research use only. It does not provide investment advice, portfolio advice, or trade guarantees.
Always evaluate signals within broader market context, risk management, and your own execution process.
No single indicator should be relied upon in isolation.
NOTES
This publication focuses on reclaim quality around VWAP rather than generic VWAP crosses.
The aim is to keep the logic interpretable, the visuals readable, and the methodology transparent. Penunjuk

Periodic Anchored VWAPPeriodic Anchored VWAP
Overview
The Periodic Anchored VWAP is a professional volume-weighted average price indicator that anchors VWAP calculations to fixed calendar periods. Unlike traditional anchored VWAP tools that require manual point-and-click anchoring, this indicator automatically resets VWAP calculations at predefined interval boundaries (hourly, daily, weekly, monthly), providing a clean, systematic approach to volume-weighted support and resistance analysis.
Key Features
13 Anchor Periods: 1H, 4H, 6H, 12H, 1D, 3D, 1W, 2W, 1M, 2M, 3M, 6M, 12M
Smart Timeframe Filtering: Automatically hides VWAPs when chart timeframe equals or exceeds anchor period
Individual Period Controls: Toggle each VWAP on/off independently with custom colors
Master Toggle: Global show/hide for all VWAP lines
Dynamic Labels: Real-time price labels at the right edge of chart
Compact Settings: Streamlined input panel with inline color pickers
How It Works
The Golden Rule
VWAP is displayed ONLY when: Chart Timeframe < Anchor Period
This ensures VWAP lines always represent meaningful continuous calculations. For example:
1H VWAP appears only on timeframes smaller than 1 hour (e.g., 15min, 5min, 1min)
1D VWAP appears only on timeframes smaller than daily (e.g., 4H, 1H, 15min)
1W VWAP appears only on timeframes smaller than weekly (e.g., daily, 4H, 1H)
Anchor Logic
Each VWAP resets at its respective period boundary:
Intraday Anchors (1H, 4H, 6H, 12H): Reset at the start of each hour/4-hour/6-hour/12-hour period
Daily Anchors (1D, 3D): Reset at daily market open
Weekly Anchors (1W, 2W): Reset at weekly market open
Monthly Anchors (1M, 2M, 3M, 6M, 12M): Reset at month boundaries
Input Settings
Master Control:
VWAP Display Show / Hide Global toggle for all VWAP lines
Intraday Anchors (Default: Off):
1H => Teal => Short-term intraday reference
4H => Pink => Medium-term intraday reference
6H => Magenta => Half-day session reference
12H => Cyan => Full session reference
Anchor VWAP Periods (Default: On):
1D => Yellow/Green => Daily support/resistance
3D => Purple => Multi-day trend reference
1W => Blue => Weekly pivot levels
2W => Light Blue => Bi-weekly trend
1M => Green => Monthly support/resistance
2M => Dark Green => 2-month horizon
3M => Yellow => Quarterly reference
6M => Orange => Semi-annual trend
12M => Red => Annual benchmark
Visual Display
VWAP Lines: Colored lines plotted at 2px thickness for clear visibility:
Right-Edge Labels: Compact labels showing period and current VWAP value
Smart Label Colors: Black or white text automatically based on line color for optimal readability
Use Cases
Intraday Trading:
Use 1H, 4H, 6H, 12H VWAPs on lower timeframes (e.g., 5min, 15min) to identify intraday support/resistance levels
Multiple intraday VWAPs reveal stacked liquidity zones
Swing Trading:
1D, 3D, 1W, 2W VWAPs help identify trend direction and mean reversion levels
Weekly VWAP provides context for daily price action
Position Trading:
1M, 3M, 6M, 12M VWAPs offer long-term benchmarks for valuation assessment
Multiple monthly VWAPs show multi-year price distribution
Multi-Timeframe Analysis:
Visualize up to 13 VWAP levels simultaneously
Identify confluences where multiple VWAP periods align
Observe how price interacts with different anchored levels
Important Notes
Timeframe Limitations: VWAPs automatically hide when the chart timeframe is equal to or greater than the anchor period (prevents misleading point-to-point lines)
Intraday Anchors Disabled by Default: Enable only the periods relevant to your trading style to reduce visual clutter
Monthly Anchors: Use 30-day approximation for minute calculations; display logic ensures they only appear on daily or lower timeframes
Label Positioning: Labels appear 1-13 bars to the right of the current bar to prevent overlap with price action
Performance
Efficiently coded with looped label management
No repainting — all calculations are historical
Compatible with all markets and symbols
Version History
v.1.0 => Initial release with 13 anchor periods, timeframe validation, and dynamic labels
Start using Periodic Anchored VWAP to elevate your volume-weighted analysis across all timeframes!
Penunjuk

Penunjuk

VWAP Daily/Weekly/Monthly - Automatic AnchoredExplanation:
This script plots Volume-Weighted Average Price (VWAP) lines that are automatically anchored to the beginning of key timeframes — daily, weekly, and monthly. VWAP is a widely used trading indicator that shows the average price of an asset weighted by trading volume, making it useful for identifying fair value and institutional trading levels.
The “automatic anchored” feature means that you don’t have to manually select starting points. Instead, the script automatically resets the VWAP at the start of each day, week, or month, depending on the chosen setting. This ensures the VWAP always reflects the true average price for that period, providing traders with a consistent reference for support, resistance, and trend direction across multiple timeframes.
Notice:
On the chart, you may notice visible “jumps” in the VWAP lines. These are intentional. Each jump marks the reset point at the start of a new day, week, or month, depending on the selected setting. This design keeps the VWAP history from the previous period intact, allowing you to clearly see how price interacted with VWAP in past sessions.
By keeping these historical resets, you can easily compare short-term (daily) VWAP behavior against longer-term levels like weekly and monthly VWAP. This provides valuable context, helping you spot when price respects or diverges from fair value across different timeframes.
In short:
Daily VWAP resets at the start of each trading day.
Weekly VWAP resets at the beginning of each trading week.
Monthly VWAP resets at the start of each month.
This makes it easy to analyze how price interacts with VWAP levels across different time horizons without manual adjustments. Penunjuk

OBVX Conviction Bias🧮 The OBVX Conviction Bias overlay tracks the flow of directional volume using the classic On-Balance Volume calculation, then filters it through a layered moving average system to expose crowd commitment , pressure transitions , and momentum fatigue . The tool applies two smoothed averages to the OBV line—a fast curve and a longer-term baseline scaled using Euler’s constant (2.718)—and visualizes their relationship using a color-coded crossover ribbon and pressure fills. When used correctly, it reveals whether a move is being supported by meaningful volume, or whether the crowd is starting to disengage.
🚦 The core signal compares OBV to its fast moving average. When OBV climbs above the short average, it fills green—suggesting real directional effort. When OBV sinks below, the fill turns maroon—flagging fading conviction or pullback potential. A second fill between the short and long OBV moving averages captures the broader trend of volume intention. If the short is above the long, this space fills greenish, showing constructive pressure. If it flips, the fill fades red, signaling crowd hesitation, rotation, or early exhaustion.
⚖️ All smoothing is user-selectable, defaulting to VWMA for effort-sensitive structure. The long-term average is auto-scaled using the natural exponential multiplier (2.718), offering rhythm that reflects the curve of participation. OBVX Conviction Bias isn’t trying to predict—it’s trying to show you where the crowd is leaning , and whether that lean is gaining traction or losing strength.
🧐 Ideal Use-Cases:
• Detect divergence between volume flow and price action
• Confirm breakout validity with volume alignment
• Fade breakouts where OBV fails to follow through
• Time pullback entries when OBV pressure resumes in trend direction
🍷 Recommended Pairings:
• ZVOL to measure whether volume is statistically significant or just noise (as shown)
• RVOL Effort Matrix to validate crowd effort by tier and structure zone
• SUPeR TReND 2.718 and/or MA Ribbons for directional confluence
• ATR Turbulence to track volatility-phase alignment with volume intention Penunjuk

Volume-Weighted Supertrend Strategy [wbburgin]This is a script that can be used as a strategy or a standalone indicator.
The Volume-Weighted Supertrend is a supertrend based on a rolling VWAP, instead of a normal price source. The strategy has two components - a supertrend based off of this VWAP (shown on the chart) and a supertrend from volume itself (not plotted on the chart directly). The supertrend from volume is an example of my "Supertrend Any Source" indicator, where a custom ATR is created from non-OHLC data; this is available as both a separate public script and also in my "wbburgin_utils" library for you to use in your own script creation.
The supertrend from volume acts as a confirmation filter for the VWAP-supertrend shown on-chart. If the volume supertrend is trending up and the VWAP-based supertrend is also trending up, a buy signal is generated. Likewise, if the volume supertrend is trending down and the VWAP-supertrend is trending down, a sell signal is generated. The colors are based off of whether both supertrends are trending up or down: green for both up, blue for only price up, orange for only price down, and red for both down.
The settings enable you to change the volume length and the ATR length separately, as well as the multiplier and the source for the price supertrend. If you load the indicator for the first time and see no entries and exits, this is because "Show Strategy Entries and Exits" is disabled in the settings. This is if you plan on using the strategy as an indicator and don't want to be bothered by the entry and exit symbols on the chart. Additionally, for those who like clean charts (like me), you can turn all the labels off in the settings, as well as the highlighting.
My default strategy settings for the strategy results shown below are as follows: 5% equity per trade, 5 degrees of pyramiding, commissions of 0.08% per trade. This strategy doesn't come with stops yet, so please be aware of that before using it to trade - I highly suggest you create your own stops based off of your R/R ratio and personal risk tolerance. Additionally, it works best on trending assets (b/c of the supertrends) with high volume. This might mean it does not work as well on lower timeframes. Strategi

Penunjuk

Penunjuk

Penunjuk

Penunjuk

Multi-TF Avg BBandsMULTI-TF AVERAGE BBANDS - with signals (BETA)
Overall, it shows where the price has support and resistance, when it's breaking through, and when its relatively low/high based on the magic of standard deviation.
created by gamazama. send me a shout if u find this useful, or if you create something cool with it.
%BB: The price's position in the boilinger band is converted to a range from 0-1. The midpoint is at 0.5
Description of parameters
"BB:Window Length" is the standard BB size of 20 candles.
The indicator plots up to 7 different %BB's on different timescales
They are calculated independently of the timescale you are viewing eg 12h, 3d, 30m will be the same output
You can enter 7 timescales, eg. if you want to plot a range of bbands of the 12h up to 3d graphs, enter values between 0.5 and 3 (days) - you can also select 0 to disable and use less timescales, or select hours or minutes
Take note if you eg. double the main multiplier to 40, it is the same as doubling all your timescales
You can turn the transparency of the 7 x %BB's to 100 to hide them, their average is plotted as a thick cyan line
"Variance" is a measure of how much the 7 BB's agree, and changes colour based on the thresholds used for the strategy
---- TO START FROM SCRATCH ----
- set all except one to ZERO (0), set to 0, and everything after to 0.
Turn ON and right click -> move the indicator to a new pane - this will show you the internal workings of the indicator.
Then there is a few standard settings
"Source Smoothing Amount" applies a basic small sma on the price.
It should be turned down when viewing candles with less information, like 1D or more.
Standard BBands use an SMA, there one uses a blend between VWMA or SMA
Volume Weight settings, the same as SMA at 0, and the same as VWMA at 1
BB^2 is a bband drawn around the average %BB. Adjust the to change its window length
The BB^2 changes color when price moves up or down
Now its time to look at the parameters which affect the buy/sell signals
turn on "show signal range" - you see some red lines
buy and sell each have 4 settings
min/max variance will affect the brigtness of the signal range
range adjust will move the range up/down
mix BB^2 blends between a straight line (0) and BB^2's top or bottom (1)
a threshold of "variance" and "h/l points" is available to generate weaker signals.
these thresholds can be increased to show more weak signals
ONCE YOU ARE HAPPY WITH THE SIGNALS being generated, you can turn OFF , and move it back to the price pane
the indicator then draws a bband around the price to maps some info into the chart:
fills a colour between 0.5 & the mid BB^2 and converts relative to the price chart
draws a line in the middle of the midband.
controls how much these lines diverge from the price - adjust it to reduce noise
converts the signal range (red lines) to be relative to the price chart
if you like, you can adjust the sell & buy signals in the tab from and to and to match the picture. It messes with auto-scaling when moving back to though
enjoy, I hope that is easy enough to understand, still trying to make this more user-friendly.
If you want to send me some token of appreciation - btc: 33c2oiCW8Fnsy41Y8z2jAPzY8trnqr5cFu
I promise it will put a fat smile on my face
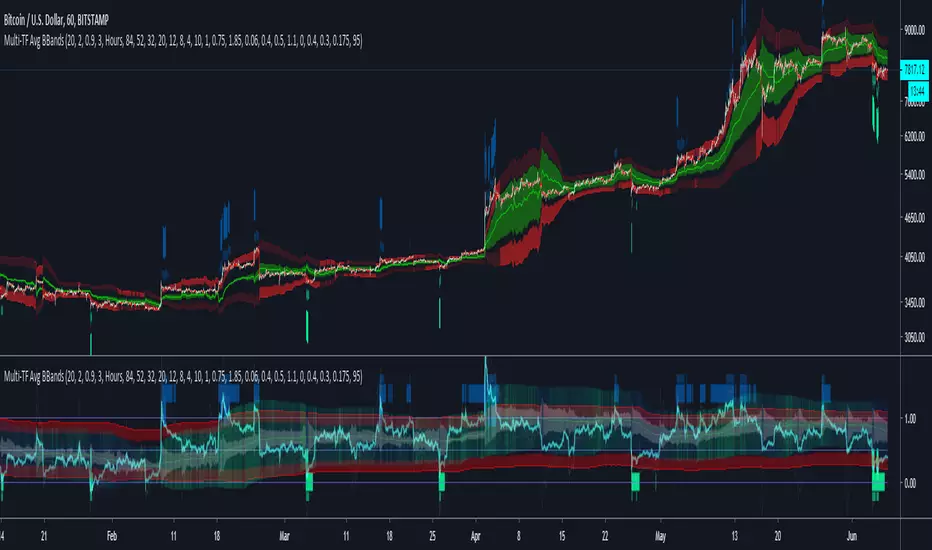
Penunjuk