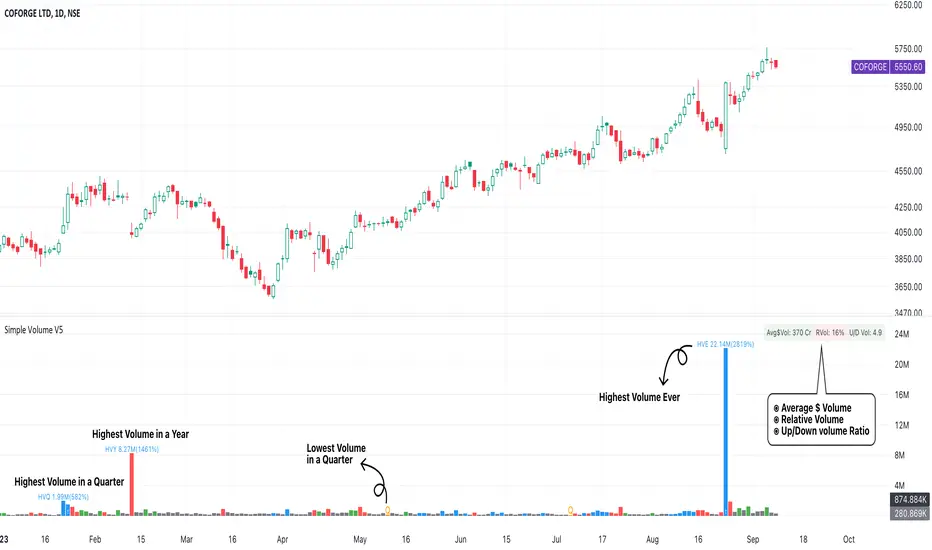
Simple Volume with Pocket PivotsThis is a minimalistic indicator that, instead of introducing more bells & whistles, strips away the conventional volume indicator from a lot of “ noise ”, and displays only 3 type of volume bars prominently:
Blue bars : Pocket Pivot Volumes (PPV), that is an up-day volume which is greater than the highest down-day volume of the last 10 down-days.
Red bars : Down-day volumes that are greater than 50-period moving average of the volume.
Green bars : Up-day volumes that are greater than 50-period moving average of the volume.
All other volumes are “ noise ” & need not be kept into any actionable consideration. All these bars are dark grey .
While initiating a long entry, we need to look out for only these 3 volume bars in this way:
RRV (recent red volumes) are indicative of unconsumed supply. Either the highs of those red days be taken out, or these RRVs be suceeded later by higher RGV (recent green volumes) . Pocket Pivot Volumes (PPV) are the best indicator of institutional accumulation. Multiple PPVs in a consolidation base, & in a breakout candle are very bullish signals.
Please also note that moving average of the volume is also purposely hidden, as the dark grey bars themselves are indication of a below-average volume. Rather than looking at each bar & comparing it to the overlying moving average line, the color scheme itself is self-explanatory, & devoid of distractions.
Penunjuk Volum
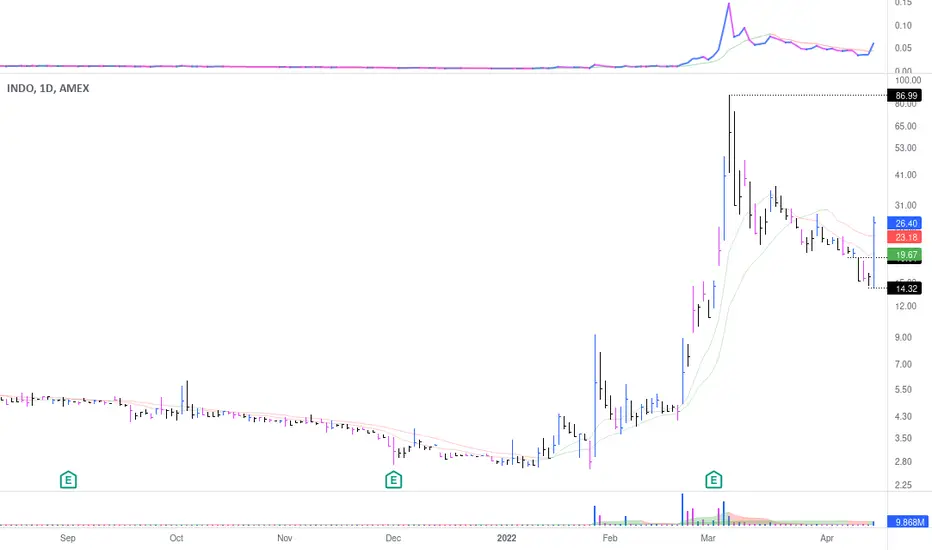
Capeya Bar ColorColor bars based on price and volume.
Volume can be set dollar denominated.
Change can be set close to close.
Volume can meet a threshold.
Color is bullish if the change is positive & bar's volume is greater than previous bar's volume.
Color is bearish if the change is negative & bar's volume is greater than previous bar's volume.
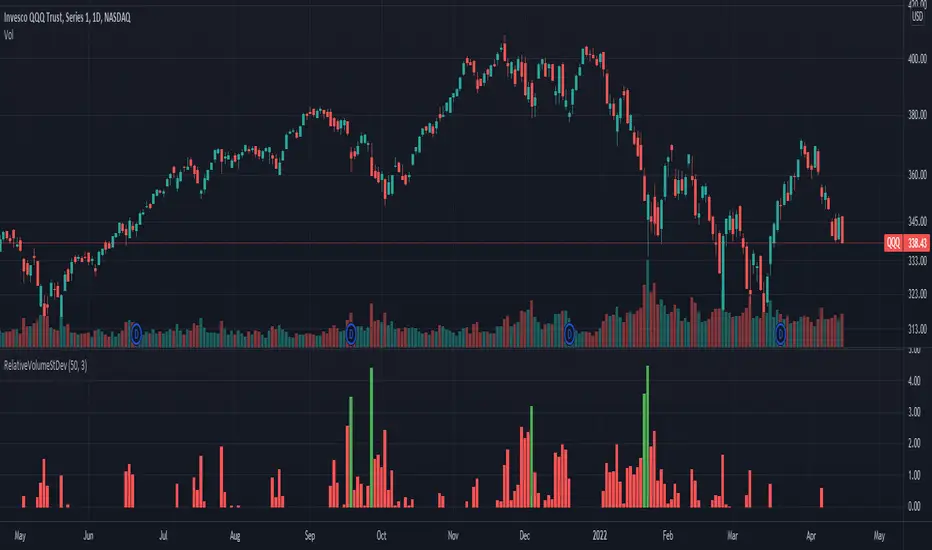
Relative Volume Standard DeviationThis indicator, developed by Melvin E. Dickover, calculates the difference between the volume and its simple moving average, but expressed as a ratio in standard deviations.
The plotted bars become green when the volume is unusually large (configurable).
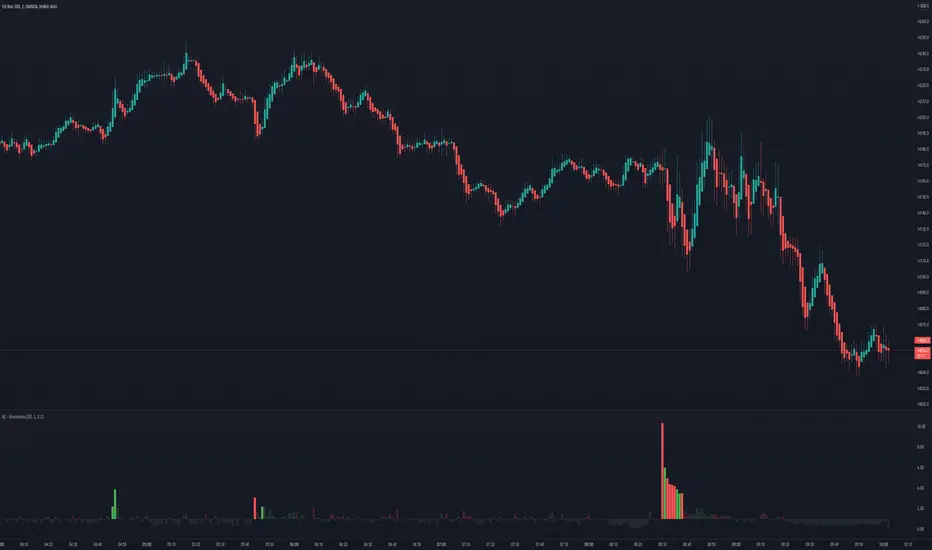
Bogdan Ciocoiu - MakaveliDescription
This indicator integrates the functionality of multiple volume price analysis algorithms whilst aligning their scales to fit in a single chart.
Having such indicators loaded enables traders to take advantage of potential divergences between the price action and volume related volatility.
Users will have to enable or disable alternative algorithms depending on their choice.
Uniqueness
This indicator is unique because it combines multiple algorithm-specific two-volume analyses with price volatility.
This indicator is also unique because it amends different algorithms to show output on a similar scale enabling traders to observe various volume-analysis tools simultaneously whilst allocating different colour codes.
Open source re-use
This indicator utilises the following open-source scripts:

Bogdan Ciocoiu - GreuceanuDescription
This indicator is an entry-level script that simplifies volume interpretation for beginning traders.
It is a handy tool that removes all the noise and focuses traders on identifying potential smart money injections.
Uniqueness
This indicator is unique because it introduces the principle of a moving average in the context of volume and then compares it with tick-based volume.
Its uniqueness is reflected in the ability to colour code each volume bar based on the intensity of each relevant (volume) unit whilst comparing it with the volume moving average.
Another benefit of this indicator is the colour coding scheme that removes volume below a particular threshold (default set to 1) under the volume moving average.
In addition to the above features, the indicator differentiates the colour of each bar by price direction.
Open source re-use
To achieve this functionality several open source indicators have been used an integrated within the current one.
Volume Strength FinderGenerally, Volume indicator shows total Volume of a candle. In this Volume Strength Finder Indicator, I tried to separate Strength of buyers and sellers based on the candle stick pattern. Calculating Buyer and Seller Strength each and every candle of the day based on the pattern formation.
High - close => Buyers
Close - low => Sellers
in this way, cumulative volume separates for buyer and sellers and comparing with total volume of the day and showing results.
if buyer strength more than seller, candle bar color remains green even a candle is negative candle(Open>close) and wise versa.
Note: This is for Education Purpose only.

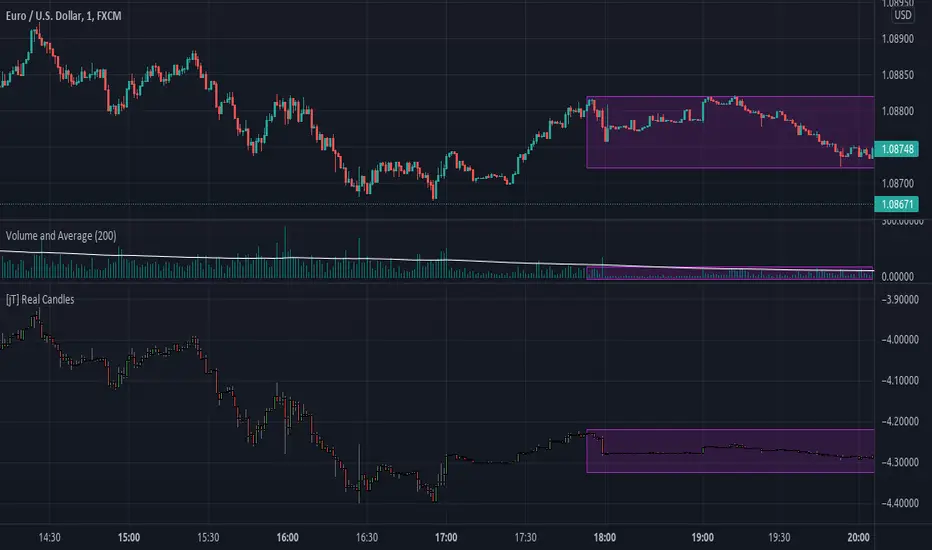
[jT] Real CandlesThis is an "indicator" that takes the candle's size and multiply it by the current volume, so now the candle size is affected by how much volume is being traded.
Here we assume that the volume traded is essential, and now it kinda have a weight on how the price acts. So "dead-volume" areas will be almost inexpressive in the chart, while the areas with huge volume are where the volatility really happens.
Note: the purple rectangles aren't part of the script, they are just to show how a area with no volume behaves.
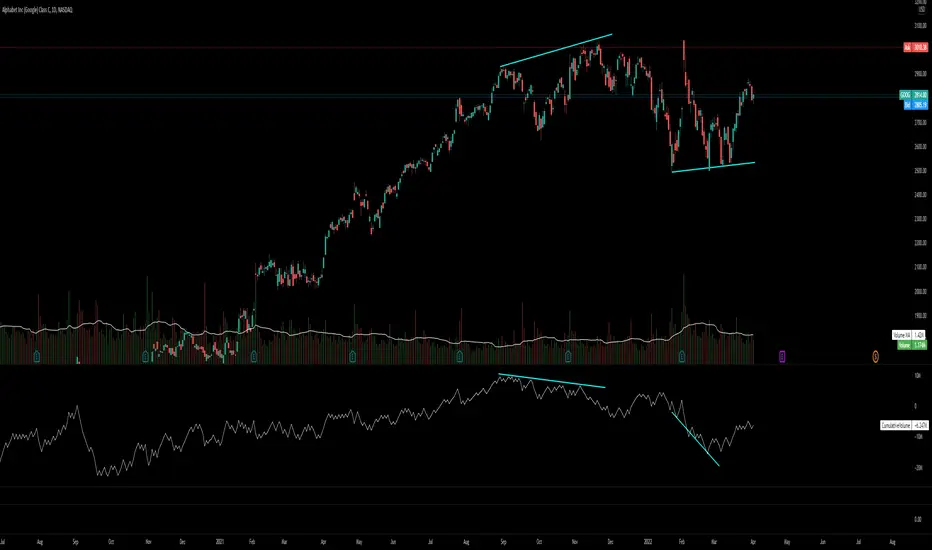
Cumulative VolumeThis is a simple script and is derived from OBV (On Balance Volume).
While OBV will smoothen the data, Cumulative Volume will start at zero and add the trading volume on a bullish day and will subtract on a bearish day.
This tool is great to spot divergences between price and volume.
Enjoy! ;-)
[Mad] Volume DeltaThis is a volume indicator that splits purchases and sales into 2 separate columns.
In addition, I added some POW factors to scale the volume to a more compact or expanded picture.
The SMA draws the red line indicating the volume of purchases and sales, also with POW factor customizable, so it is possible to scale it within the volume bars
what to do with this information: it is very easy to find rotation points when the selling volume and the buying volume are equal, this is where possible rotation phases occur
have fun

Downtick Volume / Uptick Volume - TradingEDThis case study is based on a Volume study, but with three different Moving Average & Standard Deviation counts to compare different trends. The use of this indicator is for free use. Different functionalities have been added to the original code, such as alerts and signals that seek to make trading much easier to interpret by any type of trading operator of any experience level, from beginner to intermediate and advanced .
Key components:
• Downtick volume is the number of shares or contracts that change hands at a price lower than the prior transaction price.
• Downtick volume provides insight into the intensity of selling pressure.
• High volume on downticks indicates a strong desire for traders to sell.
Downtick volume is an indicator analysts and traders use to understand current movement within an asset's price. When a transaction occurs at a higher price than the previous transaction, that is an uptick. When a transaction occurs at a lower prior price than the previous transaction, that is a downtick.
Main functions of this indicator:
1) You can select the type of MOVING AVERAGE, among many available options ( SMA , EMA , DEMA , HMA , etc.)
2) The SOURCE for the counts can be determined by the trader (close, open, etc).
3) The MEASURE can be based on a CANDLES count if you are trading OHLC Charts from 1D onwards, or if your trading is intraday, you can also select counts by MINUTES, HOURS or DAYS, depending on your trading style.
4) LENGTH, by default it will be loaded as in the STRATEGY, but considering the previous point, you can modify it according to your convenience.
5) You have the option to hide or show a LABEL at the top of the chart, with respect to the signals: BULLISH green, BEARISH red.
Main performance functions of this modified indicator:
I) In the case of the PERFORMANCE that appears at the right of the chart, you have the option to adjust the WIDTH of the box.
II) The TEXT of the PERFORMANCE is not modifiable, but you can customize the default color. *
III) The BACKGROUND of the PERFORMANCE, you can customize the default color. *
IV) You have the option to hide or show a PERFORMANCE that appears at the right of the chart.
Main functions to customize the style of this indicator:
a) You can select the color for VOLUME and for MA, with the colors that best suit you.
b) The CROSSOVER/CROSSUNDER signal between Uptick & Downtick Volume can also be customized. *
c) For any type of SIGNAL, it is painted as a VERTICAL LINE in the graph, you can change the color that comes by default. *
d) In the case of the LABELS that appear at the top, the text is not modifiable, but you can customize both the type of label and change the default color. *
e) You can select the colors for the BACKGROUND of the indicator according to the trend, whether it is BEARISH or BULLISH , with the colors that best suit you. *
* By default, they are marked as red for downtrends and green for uptrends.

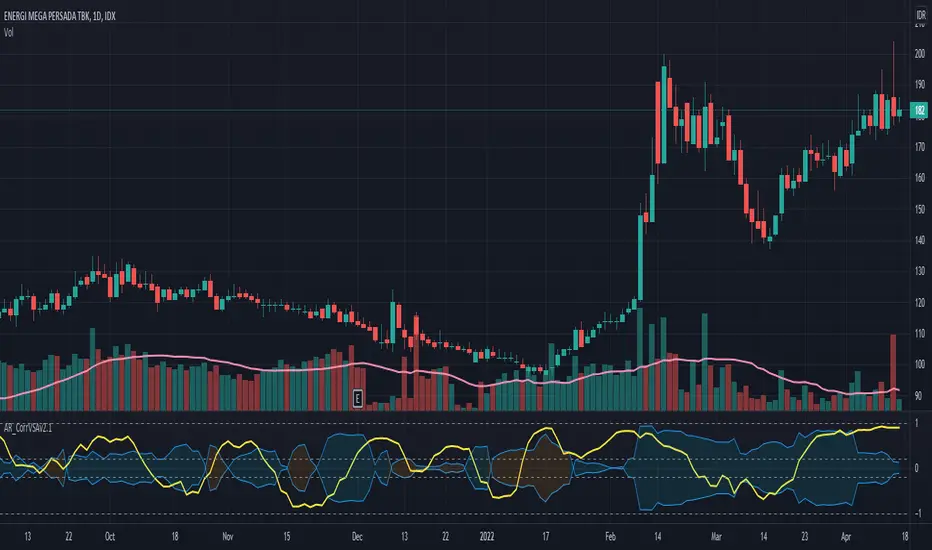
Correlation of Price Spread and VolumeCorrelation between candle's price spread (length of candle of each bar) and volume.
Generally, increases in volume precede significant price movements. However, If the price is rising in an uptrend but the volume is reducing, it may show that there’s little interest in the instrument, and the price may reverse.
The closer the correlation is to 1.0, indicates the instruments will move up and down together as it is expected with volume and price spread. So the correlation Indicator aims to display when the price spread and volume is in correlation and not. Blue color represent positive correlation while orange negative correlation. The strength of the correlation is determined by the width of the bands.
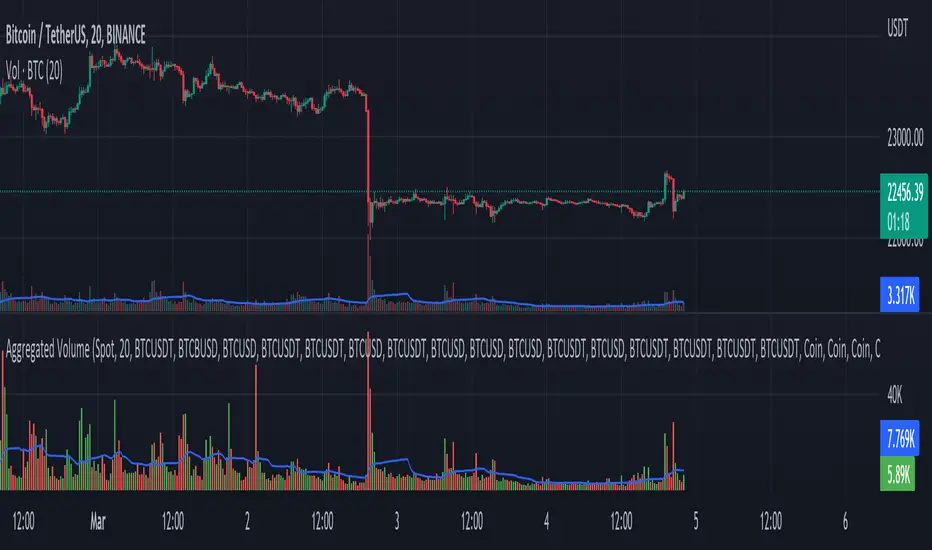
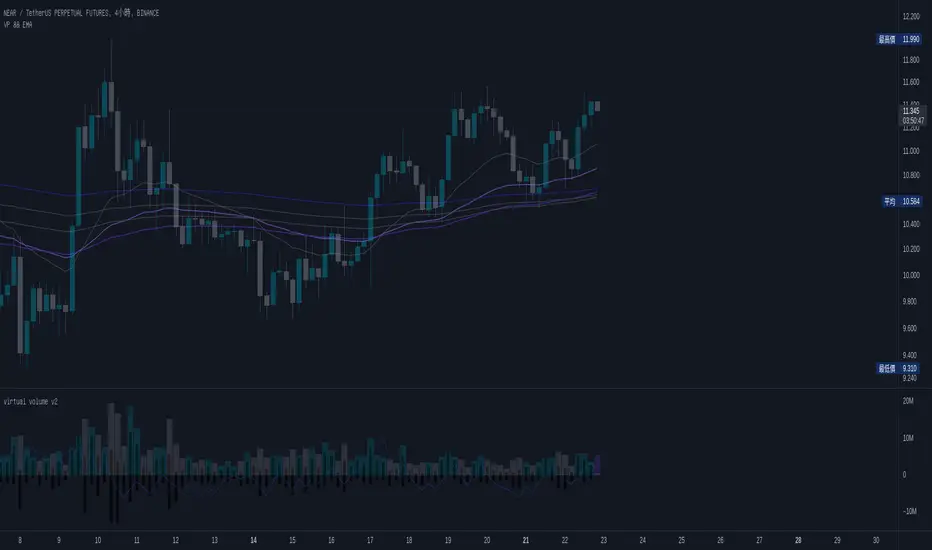
Aggregated Volume - By InFinitoVolume indicator that works like a normal Volume indicator with the following additional features:
- Aggregates Volume across different exchanges and Market Types - *Original Aggregation Code By Crypt0rus*
- Displays data by Market Type and combinations of Market Types (Spot, Futures , Perpetuals, Futures+Perpetuals & All Volume )
- Allows for the user to select the exchanges from which to aggregate Volume (This allows for the aggregation of any other pair i.e ETH, SOL, LUNA)
- Normalizes the Volume reported through TradingView by every exchange in order to homogenize the data (i.e Binance reports Bitcoin Volume in BTC terms BUT FTX reports Bitcoin Volume in USD)
- Allows for manual input of how Volume is reported in a particular Pair/Exchange (i.e If you want to aggregate data from the BTCEUR pair, you can select 'Other' and introduce the Value of EUR in USD terms)
COIN: Select this option if the volume is reported in terms of the asset traded ( BTC , ETH, SOL, etc....)
USD: Select this option if the Volume is reported in terms of the USD amount traded
OTHER: Select this option in case the Volume is reported in another currency (EUR, ETH, etc....)
NOTE: *ALL VOLUME IS AGGREGATED IN TERMS OF THE ASSET TRADED, FOR EXAMPLE IN THIS CASE: BTC . BUT IF YOU'RE AGGREGATING BNB PAIRS, VOLUME WILL BE CALCULATED TO BE DISPLAYED IN BNB TERMS*
Feel free to leave suggestions/questions in the comments or to message them directly to me
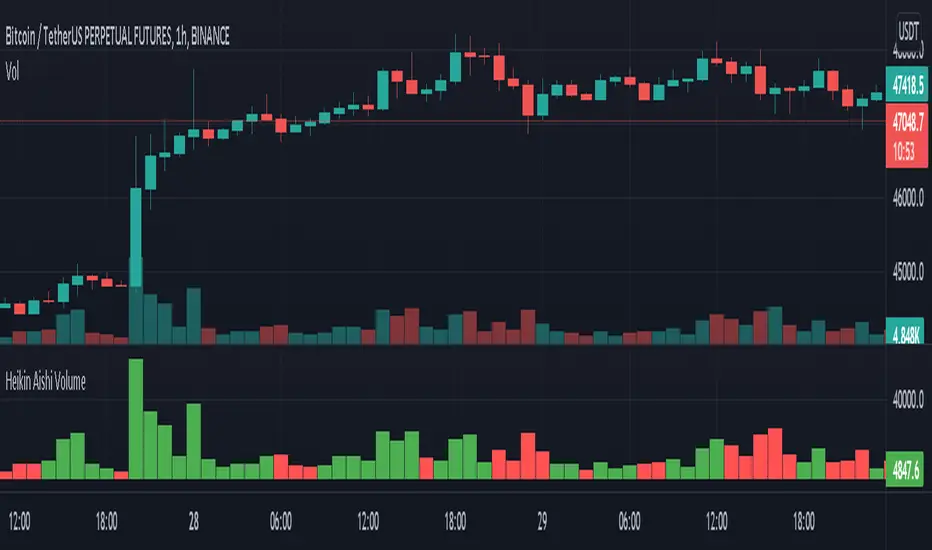
Heikin Aishi VolumeThis indicator plots the volume of each Heikin - Ashi bar...
As you all know the color of the volume depends on the open and close of the current and previous candle. So this indicator will give different color result when used on regular candles...
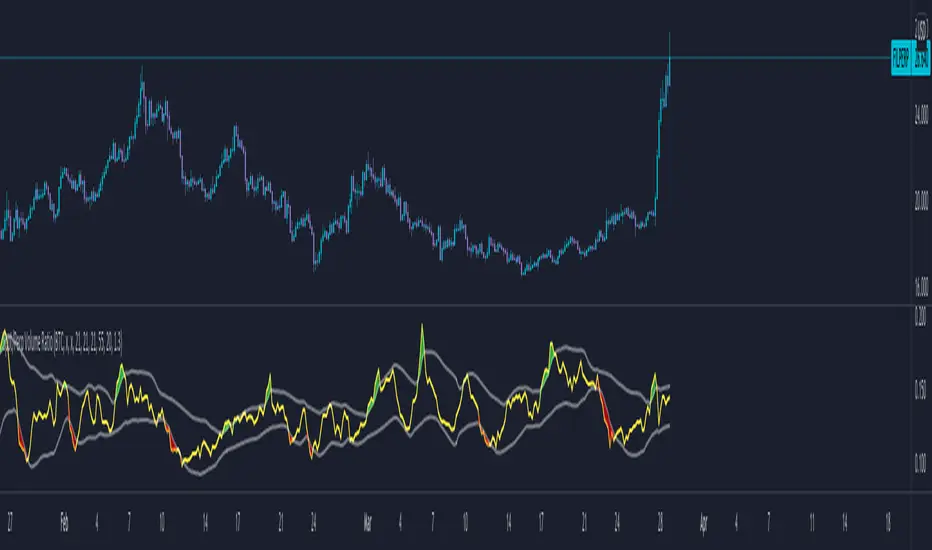
Aggregate spot/perp ratio (24 hour)This indicator plots the ratio between aggregate volume from spot and perp pairs.
Also added some moving averages, can be enabled/disabled in settings.
Sources of spot volume: Binance, Coinbase, FTX and Kraken. Sources of perp volume: Binance, FTX, Bybit and OKEX. These had highest volume.
How to use example: (v simple)
To analyze ratio on ETH:
type 'ETH' in the string input in settings, thats all.
Also 1D chart plots no ratio, due to minor issue in function. just plot 12H chart instead. ratio sensitivity will change when moving to LTF.
-Ares
Volume DeltaVolume Delta is the difference between buying and selling power. Volume Delta is calculated by taking the difference of the volume that traded at the offer price and the volume that traded at the bid price. If delta is greater than 0 you have more buying than selling pressure. If delta is less than 0, you have more selling than buying pressure. This indicator also has a pivots and alarms. Before i create this indicator i'd try all off them on market but all off them seems doing wrong calculation. Price - Some people say "Price Action is King but actually DELTA is King!
By default, this indicator displays “Delta Volume and can be set to:
Plot Levels
Volume
Default TF:
1M
Strategy:
If you get 3 gren delta in a row its buying signal and visa versa for short. You can also use more confirmation with overbought\oversold level.

[GARUFI] MFI-DMFI-D is an oscillator histogram based on the Money Flow Index. It uses two different MFI settings and present in a histogram the distance between a fast and slow setting.
It can be use to find volume-based divergences and convergences.

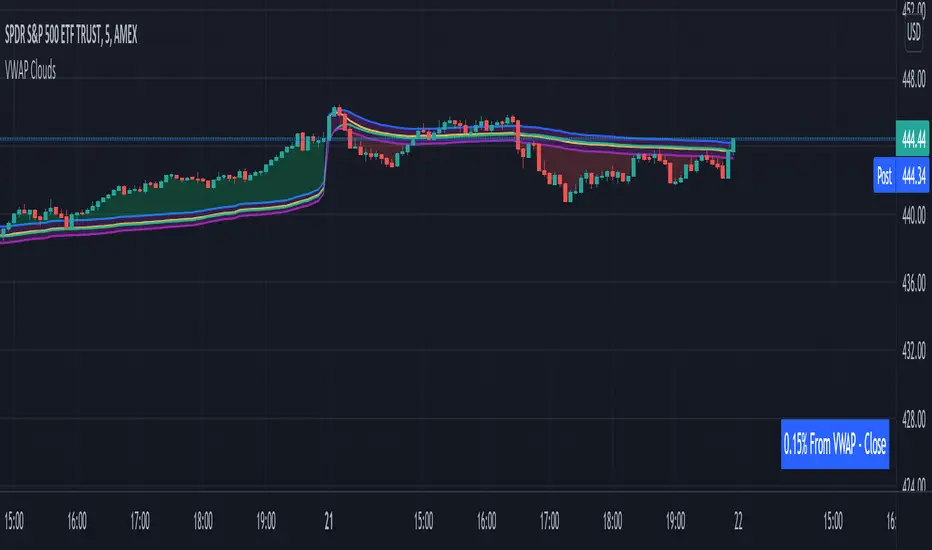
VWAP From Multiple Sources With Cloud & Percentage GapVWAP CLOUD FROM CLOSE, OPEN, HIGH & LOW SOURCES WITH CLOUD & PERCENTAGE GAP
VWAP stands for volume weighted average price and shows the average price of buys/sells based on volume traded across the current session. This VWAP is based off of the Daily session.
***HOW TO USE***
Use the purple cloud between the VWAPs as your entry points as price will typically bounce from that cloud area.
The Yellow Line is the VWAP using the close price as a source.
The Green Line is the VWAP using the open price as a source.
The Blue Line is the VWAP using the high price as a source.
The Purple Line is the VWAP using the low price as a source.
When price is above the VWAP cloud, the background will paint green because the trend is bullish.
When price is below the VWAP cloud, the background will paint red because the trend is bearish.
In the bottom right hand corner, three is a table that will show you the current percentage gap between current price and the VWAP using close as the source.
All sources and colors can be easily switched in the settings menu.
***MARKETS***
This indicator can be used as a signal on all markets, including stocks, crypto, futures and forex.
***TIMEFRAMES***
This vwap indicator can be used on all timeframes but is calculated using the daily session.
***TIPS***
Try using numerous indicators of ours on your chart so you can instantly see the bullish or bearish trend of multiple indicators in real time without having to analyze the data. Some of our favorites are our Auto Fibonacci, Volume Profile, Directional Movement Index, Momentum, Auto Support And Resistance and Money Flow Index in combination with this VWAP Cloud. The other indicators all have real time Bullish and Bearish labels as well so you can immediately understand each indicator's trend.
Volume Profile With Buy & Sell Pressure LabelVOLUME PROFILE WITH BUY AND SELL PRESSURE LABEL
This volume profile indicator shows volume traded for each bar and is colored according to the difference in buy and sell pressure(DMI).
***HOW TO USE***
If the bar and background is colored green, there is more market buying than selling on that bar.
If the bar and background is colored red, there is more market selling than buying on that bar.
If the bar and background is colored blue, there is an equal amount of market buying and selling on that bar.
***BUY/SELL LABEL***
There is also a label on the right side that tells you whether there is more buying or selling on the current bar. This table updates in real time and changes colors so you can get an easy, quick interpretation of the current buy/sell pressure without having to look at the volume bars so you can make faster decisions on whether to enter or exit a trade. The table changes colors in sync with the volume bars and background. Green means more market buying than selling. Red means more market selling than buying. Blue means an equal amount of market buying and selling.
***MARKETS***
This indicator can be used as a signal on all markets, including stocks, crypto, futures and forex.
***TIMEFRAMES***
This volume profile indicator can be used on all timeframes.
***TIPS***
Try using numerous indicators of ours on your chart so you can instantly see the bullish or bearish trend of multiple indicators in real time without having to analyze the data. Some of our favorites are our Auto Fibonacci, DMI, Momentum, Auto Support And Resistance and Money Flow Index in combination with this Volume Profile. They all have real time Bullish and Bearish labels as well so you can immediately understand each indicator's trend.

Volume Weighted Accumulation DistributionVWAD : Volume Weighted Accumulation Distribution
VWAD, is a "Sentiment analysis" indicator that measures a moving average of volume being bought versus volume being sold.
====================
SETTINGS:
Acc/Dist Immediacy : is a lookback length from which buying and selling volume data is collected.
Signal Smoothing : removes the whiplash effect of the raw Immediacy buy and sell data (higher numbers slows the averaging effect)
Short Term Sentiment : measures a period of candles to obtain a "reading" of accumulation or distribution sentiment.
Long Term Sentiment : measures a longer period of candles to obtain a "reading" of accumulation or distribution sentiment.
Volatility Threshold : affects the colouring of an optional Histogram display. When the signal line exceeds this negative or positive level, the histogram will colour depending on which accumulation/distribution state its in and whether it is accelerating or decelerating. This helps to remove false "Signals".
Show Histogram : allows you to "hide" the histogram and just view the two plot lines (the 'VWAD', which displays as red or green and the 'Signal' line which is a smoothed version of the VWAD line)
====================
BASIC USAGE:
Looking at just the yellow 'Signal' line, one can determine the sentiment of Accumulation or Distribution, depending on whether it is above the dashed zero horizontal line (accumulation) or below (distribution).
It can be helpful to see when the balance of buying or selling volume shifts toward the top or bottom of price movements. As such, this indicator is not intended to give "Buy" or "Sell" signals, but instead is used to 'start finding opportunities' to enter and exit.
I have found that with the default settings, the 4 - 8 hour chart offers a good balance of "signal to noise", however, feel free to adjust the settings to your liking.
-----------------------------
Notes:
This is intended to suit a dark background, if the VWAD becomes popular enough, there may be an update to allow re-colouring to suit those freaks that prefer light backgrounds.
====================\\

Liquidity_Zone by SebasVentuLiquidity_Zone by SebasVentu It is a strategy that shows the liquidity zones and also has a simulator
Es una estrategia que muestra las zonas de liquidez y ademas cuenta con un simulador

Haos Visual Divergence + Volume Analysis█ OVERVIEW
The Haos Visual Oscillators is a trend indicator that combines two William % indicators with different periods , to show Over Sold and Over Bought signals.
I have added Divergences and a volume indicator to check if buying or selling pressure is exhausted or showing divergences
this can help spot trend reversals
code taken from:
www.prorealcode.com
█ DESCRIPTION
Divergences:
• checks up to 20 pivot points to look for Divergences
• Divergences require single candle confirmation
• Divergences are only confirmed if oscillator pivot is of close proximity of a price pivot
Volume Indicator:
• checks for volume divergences or exhaustion
This is done by comparing relative change in price to the relative change in volume when oscillator is at over bought or over sold levels
indicator Columns:
• Yellow => divergence has been spotted
• Dim Yellow => divergence was spotted on the previous candle
• Blue => volume exhaustion was spotted
• Dim Blue => volume exhaustion was spotted on the previous candle
• Green => OverSold
• Red => OverBought
OB/OS:
• OverBough t => above 30
• OverSold => below -30
Alerts:
• Regular Bullish Divs
• Hidden Bullish Divs
• Regular Bearish Divs
• Hidden Bearish Divs
- if you realized that I posted 2 versions of the indicator :
• its because I named the first version wrongly on the publishing name and cant change it

Haus Visual Divergence + Volume Analysis█ OVERVIEW
The Haos Visual Oscillators is a trend indicator that combines two William % indicators with different periods , to show Over Sold and Over Bought signals.
I have added Divergences and a volume indicator to check if buying or selling pressure is exhausted or showing divergences
this can help spot trend reversals
code taken from:
www.prorealcode.com
█ DESCRIPTION
Divergences:
• checks up to 20 pivot points to look for Divergences
• Divergences require single candle confirmation
• Divergences are only confirmed if oscillator pivot is of close proximity of a price pivot
Volume Indicator:
• checks for volume divergences or exhaustion
This is done by comparing relative change in price to the relative change in volume when oscillator is at over bought or over sold levels
indicator Columns:
• Yellow => divergence has been spotted
• Dim Yellow => divergence was spotted on the previous candle
• Blue => volume exhaustion was spotted
• Dim Blue => volume exhaustion was spotted on the previous candle
• Green => OverSold
• Red => OverBought
OB/OS:
• OverBought => above 30
• OverSold => below -30
Alerts:
• Regular Bullish Divs
• Hidden Bullish Divs
• Regular Bearish Divs
• Hidden Bearish Divs
