Liquidity Depth [AlgoAlpha]OVERVIEW
This script visualizes market liquidity by identifying key price levels where significant volume has transacted. It highlights zones of high buying and selling interest, helping traders understand where liquidity is accumulating and how price may respond to these areas. By dynamically tracking volume at highs and lows, the script builds a real-time liquidity profile, making it a powerful tool for identifying potential support and resistance levels.
CONCEPTS
Liquidity depth analysis helps traders determine how price interacts with supply and demand at different levels. The script processes historical volume data to distinguish between high-liquidity and low-liquidity zones. It assigns transparency levels to plotted lines , ensuring that more relevant liquidity areas stand out visually. The script adds a profile to show the depth of liquidity (derived from historical volume data) for levels above and below the current price
FEATURES
Liquidity Levels: Tracks liquidity levels based on volume concentration at price high and lows.
Volume-Based Transparency: More significant liquidity levels are displayed with higher visibility, showing their significance.
Interpolation: interpolates the bullish and bearish liquidity depth at a user defined range away from the price, helping in comparing the liquidity amounts between bullish and bearish.
Depth Profile: Allows traders to visualize depth of liquidity in a more quantitative and clearer way than the liquidity levels/list]
USAGE
This indicator is best used to track liquidity levels and potential price reaction areas. Traders can adjust the Liquidity Lookback setting to analyze past liquidity levels over different historical periods. The Profile Resolution setting controls the granularity of liquidity depth visualization, with higher values providing more detail. The script can be applied across different timeframes, from intraday scalping to swing trading analysis. The plotted liquidity zones provide traders with insights into where price may encounter strong support, resistance, or potential liquidity-driven reversals.
Volumepriceanalysis

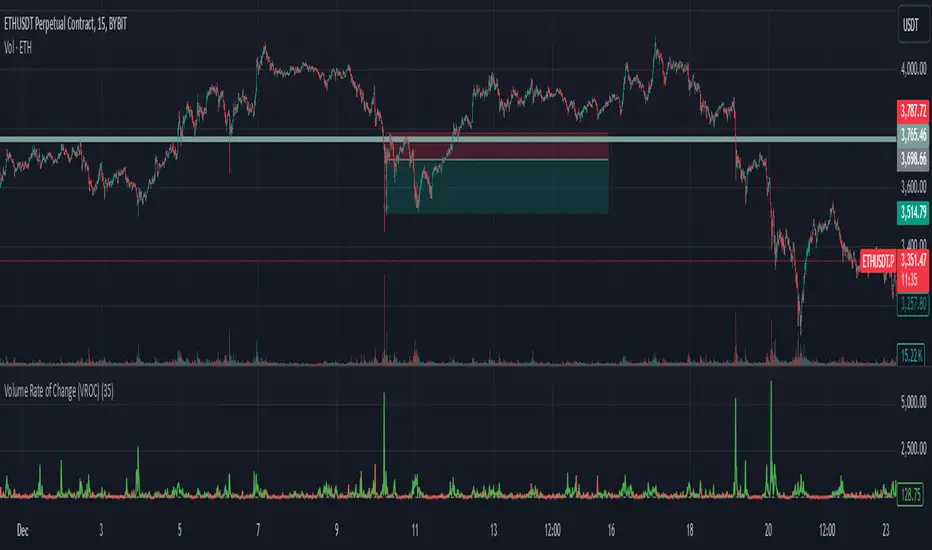
Fibonacci Volume Profiles [AlgoAlpha]Unlock a deeper understanding of price action with the Fibonacci Volume Profiles indicator by AlgoAlpha! This powerful tool blends Fibonacci retracement levels with customizable volume profiles, helping traders identify high-probability areas of support, resistance, and accumulation. Designed for both continuous dynamic levels and custom time periods, this indicator is a must-have for traders seeking confluence in market structure analysis.
🔑 Key Features
📈 Dual Mode Selection : Choose between Continuous Fibonacci levels, which adapt dynamically to pivots, or a Custom Period mode, where you set your own start and end points.
📊 Integrated Volume Profile : Visualize volume distributions at key Fibonacci retracement levels, revealing areas of strong buying/selling interest.
🎨 Customizable Colors & Transparency : Adjust Fibonacci level colors, fill zones, and profile transparency for a visually clear experience.
🔍 Profile Resolution & Scaling : Control the number of price levels and width of the volume profile for detailed market insights.
🛠 Extendable Levels : Optionally extend Fibonacci levels to the right of the chart for better visualization of future price interaction.
📌 How to Use
Add the Indicator: Click on the star icon to add it to your favorites and apply it to your TradingView chart.
Analyze The Market: Observe how price interacts with Fibonacci levels alongside the volume profile to confirm support/resistance zones. Switch between custom range or continuous mode to align the tool with your trading style.
⚙️ How It Works
The indicator calculates pivot highs/lows dynamically (or uses user-defined time periods) to plot Fibonacci retracement levels. It then builds a volume profile by analyzing historical volume data, grouping it into price bins to highlight volume-heavy zones. The Point of Control (PoC) is identified as the level with the highest traded volume, acting as a key price magnet. The color-coded Fibonacci levels help traders spot retracement zones, while the volume profile confirms strength or weakness in those areas.

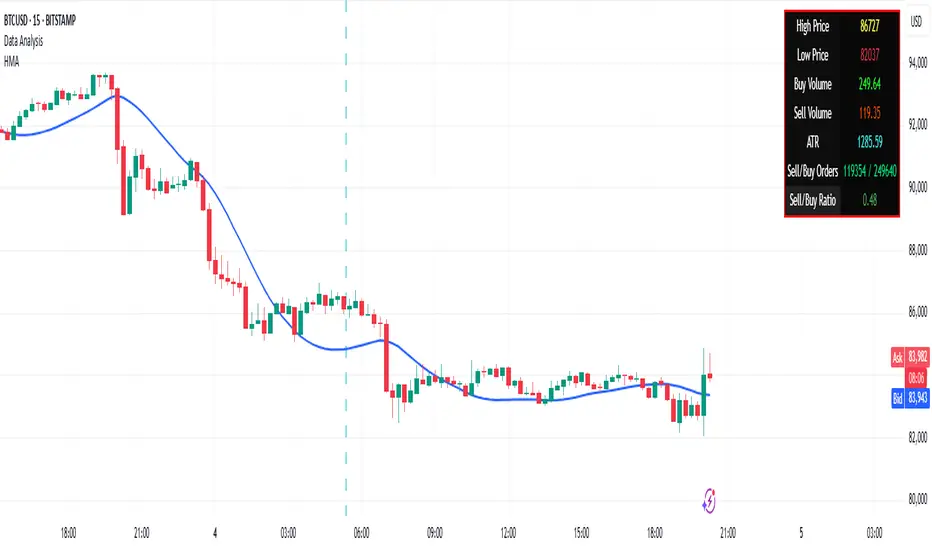
Volume Data Customized TimeframeThe "Volume Data Customized Timeframe" (VolData CTF) indicator provides traders with an enhanced volume analysis tool that aggregates buy and sell volume over a user-defined timeframe. It enables a comparative assessment of bullish and bearish volume trends, offering deeper insights into market sentiment. The indicator features a customizable display table with user-selectable themes and positioning, providing essential volume metrics for improved trading decisions.
1. Introduction:
The "Volume Data Customized Timeframe" indicator is designed to help traders analyze volume trends across different timeframes. It allows users to customize the period for volume calculations, view the ratio of selling to buying volume, and present the data in a user-friendly table format.
2. Features:
Selectable timeframe for volume analysis (default: chart timeframe)
Calculation of bullish (buy) and bearish (sell) volume
Customizable table size, theme, and positioning
Displays key volume metrics:
Total Buy Volume
Total Sell Volume
Sell/Buy Volume Ratio
Analysis period in minutes, days, weeks, or months
3. Indicator Inputs:
Average Volume Lookback (n): Number of bars used to calculate volume statistics.
Select Timeframe: Custom timeframe for volume calculations (leave empty to use the chart's timeframe).
Table Size: Choose from Small, Medium, or Big to adjust text size.
Table Theme: Choose between Light and Dark themes.
Table Position: Place the table in any corner of the chart (top-left, top-right, bottom-left, bottom-right).
4. How It Works:
The indicator retrieves volume data for the selected timeframe.
It aggregates bullish and bearish volume based on the lookback period.
The sell-to-buy volume ratio is calculated and color-coded (green for bullish dominance, red for bearish dominance).
The volume statistics are displayed in a customizable table for easy reference.
5. Interpretation:
Δ BUY VOL: Represents the total volume of bullish (up-closing) bars within the lookback period.
Δ SELL VOL: Represents the total volume of bearish (down-closing) bars within the lookback period.
Δ SELL/Δ BUY: The ratio of bearish to bullish volume; values above 1 indicate more selling pressure, while values below 1 indicate buying dominance.
Period (M/D/W/M): Displays the selected timeframe for volume aggregation.
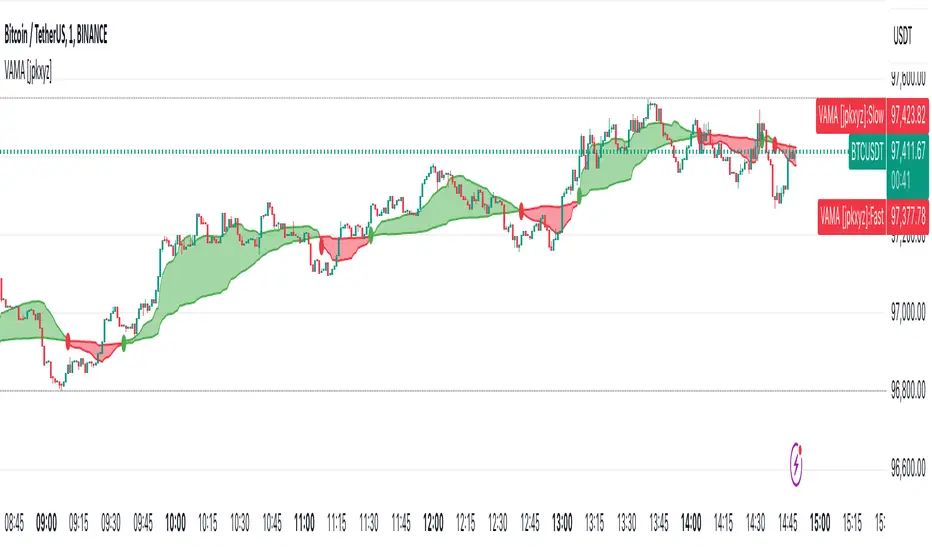
VAMA - Volume Adjusted Moving Average [jpkxyz]VAMA is a moving average that adapts to volume, giving more weight to price movements backed by higher relative volume. This VAMA (Volume Adjusted Moving Average) indicator implementation emphasizes visual clarity. It is based on the VAMA script by @allanster
Dual VAMA lines (Fast/Slow) with dynamic coloring:
Single-color scheme switches between green (bullish) and red (bearish)
Color changes on crossovers rather than relative position
Configurable line widths (set to 1 for clean appearance)
Visual enhancements:
Optional fill between VAMA lines (50% transparency)
Crossover dots can be toggled
Fills and dots match the current trend color
Customization parameters:
Independent source inputs for Fast/Slow lines
Adjustable VI Factor (volume influence)
Sample size control
Strict/non-strict calculation toggle
The code maintains efficient computation while prioritizing visual feedback for trend changes. It's designed for clear signal identification without visual clutter.
Notable style choices:
Consistent color theming throughout all visual elements
Simplified color transitions (only at crossovers)
Subtle transparency for fill areas
Minimal dot size for crossover markers
VAMA (Volume Adjusted Moving Average) Technical Analysis:
Core Calculation:
1. Volume Influence (v2i):
v2i = volume / ((total_volume/total_periods) * volume_factor)
- total_volume: Sum of volume over sample period
- total_periods: Either full history (nvb=0) or specified sample size
- volume_factor: Controls sensitivity to volume deviation
2. Price Weighting:
weighted_price = source_price * v2i
3. Accumulation Process:
- Iterates through length*10 periods
- Accumulates weighted prices and volume influence values
- Continues until volume influence sum >= specified length or strict rule triggers
4. Final VAMA Value:
vama = (weighted_sum - (volume_sum - length) * last_price) / length
Parameters:
- SampleN: Historical reference length (0=full history)
- Length: Base period for calculation
- VI Factor: Volume influence multiplier (>0.01)
- Strict: Forces exact length period completion when true
- Source: Input price data
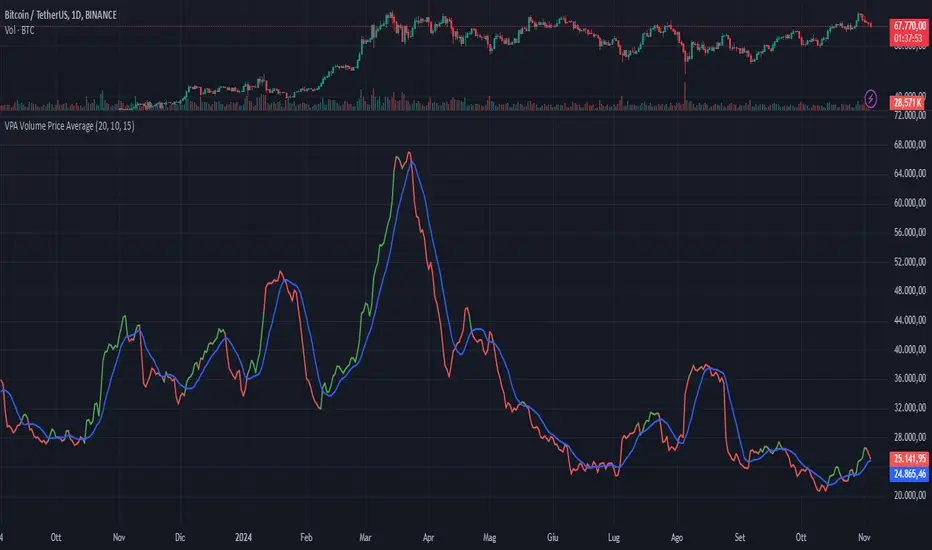
VPA Volume Price AverageDescription:
This indicator displays a moving average of volume and its signal line in a separate pane, with conditional highlighting to help interpret buyer and seller pressure. It’s based on two main lines:
Volume Moving Average (red line) : represents the average volume calculated over a configurable number of periods.
Signal Line of the Volume Moving Average (blue line): this is an average of the volume moving average itself, used as a reference for volume trends.
Key Features
Volume Moving Average with Conditional Highlighting:
The volume moving average is plotted as a red line and changes color based on two specific conditions:
The closing price is above its moving average, calculated over a configurable number of periods, indicating a bullish trend.
The volume moving average is greater than the signal line, suggesting an increase in buyer pressure.
When both conditions are met, the volume moving average turns green. If one or both conditions are not met, the line remains red.
Signal Line of the Volume Moving Average:
The signal line is plotted in blue and represents a smoothed version of the volume moving average, useful for identifying long-term volume trends and as a reference for the highlighting condition.
Customizable Periods
The indicator allows you to set the periods for each average to adapt to different timeframes and desired sensitivity:
Period for calculating the volume moving average.
Period for calculating the signal line of the volume moving average.
Period for the price moving average (used in the highlighting condition).
How to Use
This indicator is especially useful for monitoring volume dynamics in detail, with a visual system that highlights conditions of increasing buyer strength when the price is in an uptrend. The green highlight on the volume moving average provides an intuitive signal for identifying potential moments of buyer support.
Try it to gain a clearer and more focused view of volume behavior relative to price movement!
Enhanced volumeHi all!
This indicator plots volume at the bottom of the chart and the volume Moving Average (with the choice of Simple Moving Average (SMA) (default), Exponential Moving Average (EMA) and Volume Weighted Moving Average (VWMA)) and desired length (defaults to 20). It then changes the transparency of the volume (and the bars body) based on the close and the volume. It also changes the bar transparency. All these visual changes can be configured in the "Style" tab in the indicators settings.
The opacity will be high when the close is considered to be a "Strong close (%)" and has a bigger volume than any of the red closing in the last 10 bars. This "Strong close (%)" is defaulted to 50 which means that the bar needs to close equal or higher than 50% of the bar.
You also have an option to include red bars, which are excluded by default.
This indicator can help you to spot bars with relevant volume and find reversals.
I hope this explanation makes sense, let me know otherwise. Also let me know if you have any suggestions on improvements.
Best of trading luck!

FuTech V-Spike & V-HighlighterFuTech V-Spike & V-Highlighter
In the context of trading and technical analysis, this volume spike & volume highlighter indicator is the perfect indicator used to assess market activity and make informed trading decisions.
Let's Understand in brief as below :
1) Volume Spike :
A volume spike refers to a sudden, significant increase in trading volume compared to the average volume over a specific period.
This spike can indicate heightened interest in a particular security, often preceding price movements.
Traders may look for volume spikes as signals for potential buy or sell opportunities because they can suggest that a stock is experiencing increased activity, possibly due to news, earnings releases, or other catalysts.
Characteristics of a Volume Spike:
Assess the sudden increase in trading volume.
It Can occur in both upward and downward price movements.
Often compared to the average volume over a defined period (e.g., the last 20 days).
2) Volume Highlighter:
A volume highlighter emphasizes significant changes in trading volume on a price chart. This indicator typically uses color coding to highlight periods of high volume, making it easier for traders to identify volume spikes at a glance.
How this indicator works:
a) Volume Spike will calculate the highest volume spike as per the user defined threshold multiplier. (Multiplier = when volume exceeds a certain threshold)
b) The threshold Multiplier can be set based on a fixed number or as a multiple of the Exponential Moving Average volume. Volume Spike Multiplier default is 1.5, means the EMA volume should cross 1.5 times the user defined lookback period
c) The result is derived from the user defined lookback candles by using its EMA instead of SMA, which will give us more precise results.
d) By default, last 10 candles EMA average is used to calculate the Volume Spike but you can choose your lookback period as many days, weeks, months, years of your choice !
e) In Volume Spike -
- Green candle will show Yellow color Bar as Bullish sentiments, whereas
- Red candle will show Black Bar as Bearish sentiments.
f) Volume Highlighter will highlight the candles background if the highest volume is crossing as per the the user defined lookback period
g) Default Lookback period is 20, Color coding (e.g., Blue for bullish spikes, Red for bearish spikes) helps traders quickly assess the volume context.
h) Volume Highlighter plotting shapes and positions can be modified
Illustration:
From the Above pic,
If last Volume Spike is 10 lookback candles, Spike multiplier is 1.5 and Highlighter lookback candles is 20,
Then yellow candle means the spike in volume which is 1.5 times higher than the last 10 candles
Highlighting color defines the highest volumes trading from the last 20 candles which is either Blue (Bullish) or Red (Bearish) sentiments
Conclusion :
Using FuTech V-Spike & V-Highlighter indicator - will help traders identify potential trading opportunities and better understand market dynamics.
By analyzing volume in conjunction with price movements, traders can make more informed decisions based on market sentiment.
Thank you !
Jai Swaminarayan Dasna Das !
He Hari ! Bas Ek Tu Raji Tha !

Big Volume Highlighter ADVANCEDBIG VOLUME HIGHLIGHTER INDICATOR ADVANCED
The BIG VOLUME INDICATOR ADVANCED is an essential tool for traders who want to gain a deeper understanding of market dynamics through volume analysis. This advanced indicator highlights significant volume spikes, enabling traders to make more informed decisions based on market activity and price movements.
Key Features:
Customizable Lookback Period: Define the number of candles over which the highest volume is calculated, allowing you to adjust the analysis to fit your specific trading strategy and timeframe.
Approximate Volume Matching: Activate the approximate volume matching feature to identify candles that fall within a specified range of a target volume. This feature is particularly valuable for capturing notable volume spikes that may not match your exact input but are within an acceptable tolerance.
Flexible Volume Units: Input volumes in various units (Hundreds, Thousands, Millions, or Billions) to cater to your trading preferences. This flexibility ensures that you can analyze volume data in a way that aligns with your trading style.
Dynamic Tolerance Calculation: Set a percentage-based tolerance for volume matching, allowing for greater flexibility. For instance, if you input a volume of 600 million with a tolerance of 1.5%, the indicator will highlight candles with volumes ranging from 591 million to 609 million.
Visual Alerts: Highlighted candles are marked with clear, color-coded labels positioned above the bars. Green labels represent bullish candles, while red labels denote bearish candles, providing immediate visual feedback on market sentiment.
Mobile and Desktop Compatibility: Designed for seamless integration with TradingView, this indicator is accessible on both desktop and mobile devices, ensuring that you can monitor the market wherever you are.
How to Use:
Set the Lookback Period: Adjust the lookback period to analyze a specific number of candles for volume spikes.
Enable Approximate Volume Matching: If desired, toggle the approximate volume matching feature and enter your target volume, selecting the appropriate unit.
Adjust Tolerance: Define the tolerance percentage to specify how close the volume must be to your input for it to be considered significant.
Analyze the Chart: Observe the highlighted candles on your chart, which indicate significant volume activity based on your criteria.
Make Informed Decisions: Leverage the insights provided by the indicator to guide your trading decisions, identifying potential entry or exit points based on volume analysis.
****

Ehlers Loops [BigBeluga]The Ehlers Loops indicator is based on the concepts developed by John F. Ehlers, which provide a visual representation of the relationship between price and volume dynamics. This tool helps traders predict future market movements by observing how price and volume data interact within four distinct quadrants of the loop, each representing different combinations of price and volume directions. The unique structure of this indicator provides insights into the strength and direction of market trends, offering a clearer perspective on price behavior relative to volume.
🔵 KEY FEATURES & USAGE
● Four Price-Volume Quadrants:
The Ehlers Loops chart consists of four quadrants:
+Price & +Volume (top-right) – Typically indicates a bullish continuation in the market.
-Price & +Volume (bottom-right) – Generally shows a bearish continuation.
+Price & -Volume (top-left) – Typically indicates an exhaustion of demand with a potential reversal.
-Price & -Volume (bottom-left) – Indicates exhaustion of supply and near trend reversal.
By watching how symbols move through these quadrants over time, traders can assess shifts in momentum and volume flow.
● Price and Volume Scaling in Standard Deviations:
Both price and volume data are individually filtered using HighPass and SuperSmoother filters, which transform them into band-limited signals with zero mean. This scaling allows traders to view data in terms of its deviation from the average, making it easier to spot abnormal movements or trends in both price and volume.
● Loops Trajectories with Tails:
The loops draw a trail of price and volume dynamics over time, allowing traders to observe historical price-volume interactions and predict future movements based on the curvature and direction of the rotation.
● Price & Volume Histograms:
On the right side of the chart, histograms for each symbol provide a summary of the most recent price and volume values. These histograms allow traders to easily compare the strength and direction of multiple assets and evaluate market conditions at a glance.
● Flexible Symbol Display & Customization:
Traders can select up to five different symbols to be displayed within the Ehlers Loops. The settings also allow customization of symbol size, colors, and visibility of the histograms. Additionally, traders can adjust the LPPeriod and HPPeriod to change the smoothness and lag of the loops, with a shorter LPPeriod offering more responsiveness and a longer HPPeriod emphasizing longer-term trends.
🔵 USAGE
🔵 SETTINGS
Low pass Period: default is 10 to
obtain minimum lag with just a little smoothing.
High pass Period: default is 125 (half of the year if Daily timeframe) to capture the longer term moves.
🔵 CONCLUSION
The Ehlers Loops indicator offers a visually rich and highly customizable way to observe price and volume dynamics across multiple assets. By using band-limited signals and scaling data into standard deviations, traders gain a powerful tool for identifying market trends and predicting future movements. Whether you're tracking short-term fluctuations or long-term trends, Ehlers Loops can help you stay ahead of the market by offering key insights into the relationship between price and volume.

Price Action Volumetric Order Blocks [UAlgo]"Price Action Volumetric Order Blocks" indicator aims to identify significant price zones in the market based on a combination of price action and volume analysis. It utilizes the concept of "Order Blocks," which are areas on the chart where large orders are believed to have been placed, influencing price behavior. By analyzing price swings and volume activity, the indicator attempts to highlight potential support and resistance levels.
🔶 Key Features
Swing Length: This input allows you to adjust the timeframe used to identify price swings for order block detection. A longer swing length will focus on larger timeframes and potentially capture stronger order blocks.
Show Last X Order Blocks: This controls the number of order blocks displayed on the chart. You can choose to visualize a specific number of the most recent order blocks.
Violation Check: This setting determines how the indicator identifies potential order block violations. You can choose between "Wick" or "Close" violations. A "Wick" violation occurs when the price (wick) extends beyond the order block boundaries, while a "Close" violation signifies that the closing price breaches the order block.
Hide Overlap: This option allows you to manage the display of overlapping order blocks. If set to "True," only non-overlapping order blocks will be shown, potentially offering a clearer visualization.
Colors: You can customize the color scheme for bullish (upward) and bearish (downward) order blocks to enhance visual clarity on the chart.
🔶 Interpreting the Indicator
Order Blocks: The teal-colored boxes represent bullish order blocks, indicating areas of demand where buying pressure is likely to be strong. Red-colored boxes represent bearish order blocks, indicating areas of supply where selling pressure is likely to be dominant. These zones often signal potential reversal points or consolidation areas.
Strength Calculations: The indicator calculates the relative strength of bullish and bearish blocks based on volume. A higher bullish strength indicates stronger buying pressure, while higher bearish strength suggests more selling pressure. Traders can use this information to gauge the strength of a price level and predict future price movements.
Market Structure Lines: The indicator displays horizontal lines to depict the current market structure, labeled as "MSB" (Market Sell Balance) or "BOS" (Break of Structure). These lines can help visualize the prevailing trend direction.
Order Block Violations: When a price wick or close breaches an order block (depending on the chosen violation type), the corresponding order block visualization is removed from the chart. This can signify a potential weakening of the identified support or resistance zone.
🔶 Disclaimer
Use with Caution: This indicator is provided for educational and informational purposes only and should not be considered as financial advice. Users should exercise caution and perform their own analysis before making trading decisions based on the indicator's signals.
Not Financial Advice: The information provided by this indicator does not constitute financial advice, and the creator (UAlgo) shall not be held responsible for any trading losses incurred as a result of using this indicator.
Backtesting Recommended: Traders are encouraged to backtest the indicator thoroughly on historical data before using it in live trading to assess its performance and suitability for their trading strategies.
Risk Management: Trading involves inherent risks, and users should implement proper risk management strategies, including but not limited to stop-loss orders and position sizing, to mitigate potential losses.
No Guarantees: The accuracy and reliability of the indicator's signals cannot be guaranteed, as they are based on historical price data and past performance may not be indicative of future results.

Volume Profile Heatmap [UAlgo]The "Volume Profile Heatmap " indicator is a tool designed to visualize the distribution of trading volume across different price levels over a specified period. This heatmap-style indicator helps traders identify significant price levels where a high volume of trading activity has occurred, which can be crucial for making informed trading decisions. The indicator divides the price range into multiple levels and calculates the volume of trades occurring at each level, presenting this data in a visually intuitive manner using a gradient of colors.
By analyzing the volume profile, traders can gain insights into areas of support and resistance, as well as the Point of Control (POC)—the price level with the highest traded volume. This information is valuable in assessing market sentiment, potential reversal points, and key areas of interest where price action might consolidate or react.
🔶 Key Features
Customizable Analysis Period: The indicator allows users to specify the analysis period, defining the historical range over which the volume profile is calculated.
Adjustable Number of Levels: Users can set the number of price levels to divide the price range, offering flexibility in the granularity of the volume analysis.
Color-Coded Heatmap: The indicator uses a gradient color scheme to visually represent volume intensity at each price level. Higher volume areas are shaded differently than lower volume areas, making it easy to spot significant price levels.
Opacity Control: Users can adjust the opacity of the volume boxes, enabling a clearer or more subtle visualization according to their preferences.
Point of Control (POC) Display: The indicator highlights the Point of Control, the price level with the highest traded volume, with a distinct line on the chart, allowing traders to easily identify this critical level.
🔶 Disclaimer
Use with Caution: This indicator is provided for educational and informational purposes only and should not be considered as financial advice. Users should exercise caution and perform their own analysis before making trading decisions based on the indicator's signals.
Not Financial Advice: The information provided by this indicator does not constitute financial advice, and the creator (UAlgo) shall not be held responsible for any trading losses incurred as a result of using this indicator.
Backtesting Recommended: Traders are encouraged to backtest the indicator thoroughly on historical data before using it in live trading to assess its performance and suitability for their trading strategies.
Risk Management: Trading involves inherent risks, and users should implement proper risk management strategies, including but not limited to stop-loss orders and position sizing, to mitigate potential losses.
No Guarantees: The accuracy and reliability of the indicator's signals cannot be guaranteed, as they are based on historical price data and past performance may not be indicative of future results.

Volume Spread Analysis [AlgoAlpha]Unleash the power of Volume Spread Analysis (VSA) with our state-of-the-art indicator designed to detect market divergences and convergences, helping you make informed trading decisions. 📈
Key Features:
Detects bullish and bearish divergences based on volume and price movements. 📊🔍
Identifies bullish and bearish convergences, signaling potential trend continuations or reversals. 🔄📉
Customizable parameters for period length, volume SMA period, and outlier reduction factor. ⚙️🔧
Visual highlights for detected effects, with color-coded boxes and labels. 🟩🟥
Provides alerts for divergences and convergences, keeping you updated on market conditions. 🔔📬
📚 Introduction to Volume Spread Analysis (VSA) :
Volume Spread Analysis is a method used to interpret the relationship between volume and price to identify the intentions of market participants. By analyzing the spread (range) of a price bar and its corresponding volume, VSA helps traders discern market strength and potential reversals.
In VSA, harmony occurs when price and volume move in sync, such as when increasing prices(aka "Effect" in the script) are accompanied by increasing volume. This indicates a strong and healthy trend. Conversely, divergence happens when price and volume move in opposite directions. For example, if prices are rising lesser but volume is still high, it may signal a weakening trend and a potential reversal. Identifying these patterns helps traders understand market dynamics and make more informed trading decisions.
🛠 Quick Guide to Using the Volume Spread Analysis Indicator
⭐ Add the Indicator: Add the indicator to favorites by pressing the star icon. Customize settings such as period length, volume SMA period, and outlier reduction factor to fit your trading style.
📊 Market Analysis: Watch for color-coded boxes indicating effects and labels showing effort values. Look for divergences and convergences to identify potential trading opportunities. A higher work done suggests that the markets are needing to work harder to move the price and users can use that information as displayed below each trend impulse box to analyze the likely hood of trend continuation/reversals.
🔔 Alerts: Enable alerts for divergences and convergences to stay informed of critical market conditions without constant chart monitoring.
🔍 How It Works:
Our indicator meticulously analyzes volume and price data to detect significant market movements. It identifies periods where volume is above or below a moving average, marks these points, and tracks the price effect over a user-defined range. By calculating the effort (volume) and effect (price movement), it distinguishes between divergences and convergences based on predefined conditions. Bullish and bearish conditions are visually represented with color-coded boxes and labels, making it easy to spot trading opportunities. Alerts can be set to notify you of critical market conditions, ensuring you never miss a potential trade setup.
Happy trading! 📈🚀

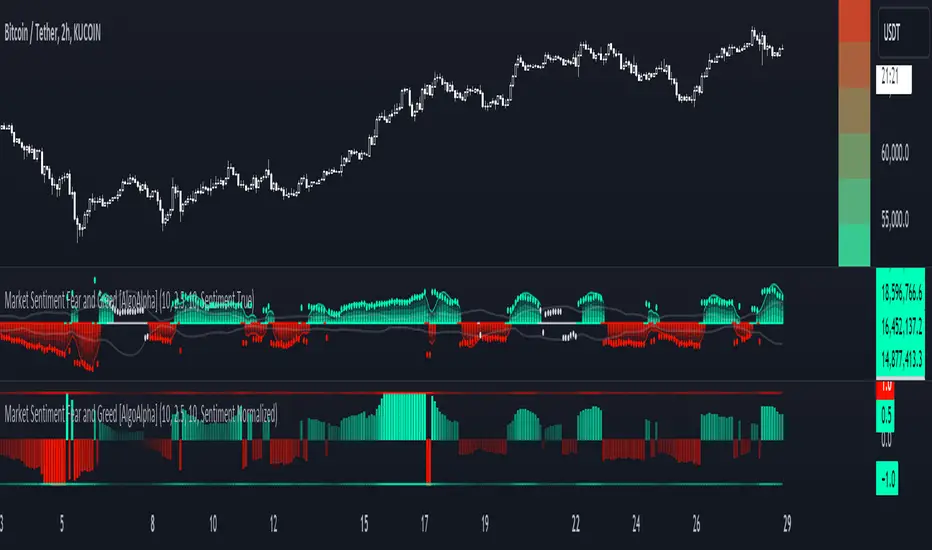
Market Sentiment Fear and Greed [AlgoAlpha]Unleash the power of sentiment analysis with the Market Sentiment Fear and Greed Indicator! 📈💡 This tool provides insights into market sentiment, helping you make informed trading decisions. Let's dive into its key features and how it works. 🚀✨
Key Features 🎯
🧠 Sentiment Analysis : Calculates market sentiment using volume and price data. 📊
📅 Customizable Lookback Window : Adjust the lookback period to fine-tune sensitivity. 🔧
🎨 Bullish and Bearish Colors : Visualize trends with customizable colors. 🟢🔴
🚀 Impulse Detection : Identifies bullish and bearish impulses for trend confirmation. 🔍
📉 Normalized Sentiment Index : Offers a normalized view of market sentiment. 📊
🔔 Alerts : Set alerts for key sentiment changes and trend impulses. 🚨
🟢🔴 Table Visualization : Displays sentiment strength using a gradient color table. 🗂️
How to Use 📖
Maximize your trading potential with this indicator by following these steps:
🔍 Add the Indicator : Search for "Market Sentiment Fear and Greed " in TradingView's Indicators & Strategies. Customize settings like the lookback window and trend breakout threshold to suit your trading strategy.
📊 Monitor Sentiment : Watch the sentiment gauge and plot changes to detect market sentiment shifts. Use the Normalized Sentiment Index for a more balanced view.
🚨 Set Alerts : Enable alerts for sentiment flips and trend impulses to stay ahead of market movements.
How It Works ⚙️
The indicator calculates market sentiment by averaging the volume and closing prices over a user-defined lookback period, creating a sentiment score. It differentiates between bullish and bearish sentiment by evaluating whether the closing price is higher or lower than the opening price, summing the respective volumes. The true sentiment is determined by comparing these summed values, with a positive score indicating bullish sentiment and a negative score indicating bearish sentiment. The indicator further normalizes this sentiment score by dividing it by the EMA of the highest high minus the lowest low over double the lookback period, ensuring values are constrained between -1 and 1. Bullish and bearish impulses are identified using Hull Moving Averages (HMA) of the positive and negative sentiments, respectively. When these impulses exceed a calculated threshold based on the standard deviation of the sentiment, it indicates a significant trend change. The script also includes a gradient color table to visually represent the strength of sentiment, and customizable alerts to notify users of key sentiment changes and trend impulses.
Unlock deeper insights into market sentiment and elevate your trading strategy with the Market Sentiment Fear and Greed Indicator! 📈✨
Volume Insignts AnalyzerDescription:
The Volume Insight Analyzer is an advanced Pine Script designed for traders who want a comprehensive view of volume dynamics on their charts. This script combines multiple volume-based indicators to help identify key trading opportunities, including significant volume days, volume dry-ups, and pocket pivots.
Key Features:
VDU (Volume Dry-Up) Detection: Automatically identifies and marks days when the volume is significantly below its moving average, helping to spot potential breakout or breakdown points. Customizable volume thresholds allow for tailored analysis based on your trading strategy. The Volume Dry-Up label appears when the volume is substantially below its average level and the price is near a key moving average. This condition indicates a period of equilibrium between supply and demand, suggesting a potential low-risk entry point for traders.
Pocket Pivot Analysis using 5 and 10 Length Pocket Pivots: Highlights days with exceptionally high volume compared to recent history, indicating potential pocket pivots. Visual markers on the chart and volume bars color-coded for 5 and 10-day lengths. Pocket pivot points are identified when the volume on a given day exceeds the maximum volume observed over the past several days. Specifically, a 5-day pocket pivot point is marked when today's volume surpasses the highest selling volume of the last 5 days. A cluster of 5-day pocket pivot points within a base is a strong indicator of stock strength. Similarly, a 10-day pocket pivot point following a Volume Dry-Up (VDU) suggests a potential entry opportunity. Moreover, a pre-existing cluster of 5-day pocket pivot points before a 10-day pocket pivot point provides greater conviction in the trade.
Volume Moving Averages: Set different lengths for primary and secondary moving averages to track volume trends over daily, weekly, and monthly timeframes. Options to display moving average lines on the volume chart.
Volume Visualization:
a. Major and Minor Volume Bars: Option to display bars that are either above or below average volume levels. Adjustable settings to show or hide these bars based on user preference.
b. Volume Bar Coloring: Volume bars are color-coded based on significant volume thresholds, including green for bullish signals, red for bearish signals, and orange for volume dry-ups.
Volume Metrics Table: A customizable table that displays real-time volume metrics including Relative Volume (RVOL), Turnover, and the number of high volume days. The table can be oriented horizontally or vertically and styled according to your theme preferences.
Visual Indicators:
a) Volume Dry-Up (VDU) Labels: Clearly marked VDU events with textual annotations on the chart.
b) Bullish and Bearish Arrows: Arrows indicating potential bullish or bearish closes based on volume analysis, enhancing decision-making.
Customization Options:
a) Dark and Light Theme Support: Toggle between dark and light themes to match your chart settings.
b) Adjustable Parameters: Easily configure input settings such as volume thresholds, MA lengths, and table display options to fit your trading style.
How to Use:
Set Parameters: Adjust the script settings such as volume thresholds, moving average lengths, and display preferences according to your analysis needs.
Analyze Volume Patterns: Use the indicators and visual markers provided by the script to identify significant volume patterns and potential trading signals.
Monitor Metrics: Refer to the volume metrics table for a quick overview of key volume-related statistics and trends.
Make Informed Decisions: Utilize the visual cues and volume data provided by the script to enhance your trading strategy and make more informed decisions.
Disclaimer:
This script is for informational purposes only and should not be considered as trading advice. Use it in conjunction with other analysis tools and consult with a financial advisor if needed. Trading involves risk, and past performance does not guarantee future results.

Auto Volume Spread Analysis (VSA) [TANHEF]Auto Volume Spread Analysis (visible volume and spread bars auto-scaled): Understanding Market Intentions through the Interpretation of Volume and Price Movements.
All the sections below contain the same descriptions as my other indicator "Volume Spread Analysis" with the exception of 'Auto Scaling'.
█ Auto-Scaling
This indicator auto-scales spread bars to match the visible volume bars, unlike the previous "Volume Spread Analysis " version which limited the number of visible spread bars to a fixed count. The auto-scaling feature allows for easier navigation through historical data, enabling both more historical spread bars to be viewed and more historical VSA pattern labels being displayed without requiring using the bar replay tool. Please note that this indicator’s auto-scaling feature recalculates the visible bars on the chart, causing the indicator to reload whenever the chart is moved.
Auto-scaled spread bars have two display options (set via 'Spread Bars Method' setting):
Lines: a bar lookback limit of 500 bars.
Polylines: no bar lookback limit as only plotted on visible bars on chart, which uses multiple polylines are used.
█ Simple Explanation:
The Volume Spread Analysis (VSA) indicator is a comprehensive tool that helps traders identify key market patterns and trends based on volume and spread data. This indicator highlights significant VSA patterns and provides insights into market behavior through color-coded volume/spread bars and identification of bars indicating strength, weakness, and neutrality between buyers and sellers. It also includes powerful volume and spread forecasting capabilities.
█ Laws of Volume Spread Analysis (VSA):
The origin of VSA begins with Richard Wyckoff, a pivotal figure in its development. Wyckoff made significant contributions to trading theory, including the formulation of three basic laws:
The Law of Supply and Demand: This fundamental law states that supply and demand balance each other over time. High demand and low supply lead to rising prices until demand falls to a level where supply can meet it. Conversely, low demand and high supply cause prices to fall until demand increases enough to absorb the excess supply.
The Law of Cause and Effect: This law assumes that a 'cause' will result in an 'effect' proportional to the 'cause'. A strong 'cause' will lead to a strong trend (effect), while a weak 'cause' will lead to a weak trend.
The Law of Effort vs. Result: This law asserts that the result should reflect the effort exerted. In trading terms, a large volume should result in a significant price move (spread). If the spread is small, the volume should also be small. Any deviation from this pattern is considered an anomaly.
█ Volume and Spread Analysis Bars:
Display: Volume and spread bars that consist of color coded levels, with the spread bars scaled to match the volume bars. A displayable table (Legend) of bar colors and levels can give context and clarify to each volume/spread bar.
Calculation: Levels are calculated using multipliers applied to moving averages to represent key levels based on historical data: low, normal, high, ultra. This method smooths out short-term fluctuations and focuses on longer-term trends.
Low Level: Indicates reduced volatility and market interest.
Normal Level: Reflects typical market activity and volatility.
High Level: Indicates increased activity and volatility.
Ultra Level: Identifies extreme levels of activity and volatility.
This illustrates the appearance of Volume and Spread bars when scaled and plotted together:
█ Forecasting Capabilities:
Display: Forecasted volume and spread levels using predictive models.
Calculation: Volume and Spread prediction calculations differ as volume is linear and spread is non-linear.
Volume Forecast (Linear Forecasting): Predicts future volume based on current volume rate and bar time till close.
Spread Forecast (Non-Linear Dynamic Forecasting): Predicts future spread using a dynamic multiplier, less near midpoint (consolidation) and more near low or high (trending), reflecting non-linear expansion.
Moving Averages: In forecasting, moving averages utilize forecasted levels instead of actual levels to ensure the correct level is forecasted (low, normal, high, or ultra).
The following compares forecasted volume with actual resulting volume, highlighting the power of early identifying increased volume through forecasted levels:
█ VSA Patterns:
Criteria and descriptions for each VSA pattern are available as tooltips beside them within the indicator’s settings. These tooltips provide explanations of potential developments based on the volume and spread data.
Signs of Strength (🟢): Patterns indicating strong buying pressure and potential market upturns.
Down Thrust
Selling Climax
No Effort ➤ Bearish Result
Bearish Effort ➤ No Result
Inverse Down Thrust
Failed Selling Climax
Bull Outside Reversal
End of Falling Market (Bag Holder)
Pseudo Down Thrust
No Supply
Signs of Weakness (🔴): Patterns indicating strong selling pressure and potential market downturns.
Up Thrust
Buying Climax
No Effort ➤ Bullish Result
Bullish Effort ➤ No Result
Inverse Up Thrust
Failed Buying Climax
Bear Outside Reversal
End of Rising Market (Bag Seller)
Pseudo Up Thrust
No Demand
Neutral Patterns (🔵): Patterns indicating market indecision and potential for continuation or reversal.
Quiet Doji
Balanced Doji
Strong Doji
Quiet Spinning Top
Balanced Spinning Top
Strong Spinning Top
Quiet High Wave
Balanced High Wave
Strong High Wave
Consolidation
Bar Patterns (🟡): Common candlestick patterns that offer insights into market sentiment. These are required in some VSA patterns and can also be displayed independently.
Bull Pin Bar
Bear Pin Bar
Doji
Spinning Top
High Wave
Consolidation
This demonstrates the acronym and descriptive options for displaying bar patterns, with the ability to hover over text to reveal the descriptive text along with what type of pattern:
█ Alerts:
VSA Pattern Alerts: Notifications for identified VSA patterns at bar close.
Volume and Spread Alerts: Alerts for confirmed and forecasted volume/spread levels (Low, High, Ultra).
Forecasted Volume and Spread Alerts: Alerts for forecasted volume/spread levels (High, Ultra) include a minimum percent time elapsed input to reduce false early signals by ensuring sufficient bar time has passed.
█ Inputs and Settings:
Indicator Bar Color: Select color schemes for bars (Normal, Detail, Levels).
Indicator Moving Average Color: Select schemes for bars (Fill, Lines, None).
Price Bar Colors: Options to color price bars based on VSA patterns and volume levels.
Legend: Display a table of bar colors and levels for context and clarity of volume/spread bars.
Forecast: Configure forecast display and prediction details for volume and spread.
Average Multipliers: Define multipliers for different levels (Low, High, Ultra) to refine the analysis.
Moving Average: Set volume and spread moving average settings.
VSA: Select the VSA patterns to be calculated and displayed (Strength, Weakness, Neutral).
Bar Patterns: Criteria for bar patterns used in VSA (Doji, Bull Pin Bar, Bear Pin Bar, Spinning Top, Consolidation, High Wave).
Colors: Set exact colors used for indicator bars, indicator moving averages, and price bars.
More Display Options: Specify how VSA pattern text is displayed (Acronym, Descriptive), positioning, and sizes.
Alerts: Configure alerts for VSA patterns, volume, and spread levels, including forecasted levels.
█ Usage:
The Volume Spread Analysis indicator is a helpful tool for leveraging volume spread analysis to make informed trading decisions. It offers comprehensive visual and textual cues on the chart, making it easier to identify market conditions, potential reversals, and continuations. Whether analyzing historical data or forecasting future trends, this indicator provides insights into the underlying factors driving market movements.

Frequency and Volume ProfileFREQUENCY & VOLUME PROFILE
⚪ OVERVIEW
The Frequency and Volume Profile indicator plots a frequency or volume profile based on the visible bars on the chart, providing insights into price levels with significant trading activity.
⚪ USAGE
● Market Structure Analysis:
Identify key price levels where significant trading activity occurred, which can act as support and resistance zones.
● Volume Analysis:
Use the volume mode to understand where the highest trading volumes have occurred, helping to confirm strong price levels.
● Trend Confirmation:
Analyze the distribution of trading activity to confirm or refute trends, mark important levels as support and resistance, aiding in making more informed trading decisions.
● Frequency Distribution:
In statistics, a frequency distribution is a list of the values that a variable takes in a sample. It is usually a list. Displayed as a histogram.
⚪ SETTINGS
Source: Select the price data to use for the profile calculation (default: hl2).
Move Profile: Set the number of bars to offset the profile from the current bar (default: 100).
Mode: Choose between "Frequency" and "Volume" for the profile calculation.
Profile Color: Customize the color of the profile lines.
Lookback Period: Uses 5000 bars for daily and higher timeframes, otherwise 10000 bars.
The Frequency Profile indicator is a powerful tool for visualizing price levels with significant trading activity, whether in terms of frequency or volume. Its dynamic calculation and customizable settings make it a versatile addition to any trading strategy.

Volume Spread Analysis [TANHEF]Volume Spread Analysis: Understanding Market Intentions through the Interpretation of Volume and Price Movements.
█ Simple Explanation:
The Volume Spread Analysis (VSA) indicator is a comprehensive tool that helps traders identify key market patterns and trends based on volume and spread data. This indicator highlights significant VSA patterns and provides insights into market behavior through color-coded volume/spread bars and identification of bars indicating strength, weakness, and neutrality between buyers and sellers. It also includes powerful volume and spread forecasting capabilities.
█ Laws of Volume Spread Analysis (VSA):
The origin of VSA begins with Richard Wyckoff, a pivotal figure in its development. Wyckoff made significant contributions to trading theory, including the formulation of three basic laws:
The Law of Supply and Demand: This fundamental law states that supply and demand balance each other over time. High demand and low supply lead to rising prices until demand falls to a level where supply can meet it. Conversely, low demand and high supply cause prices to fall until demand increases enough to absorb the excess supply.
The Law of Cause and Effect: This law assumes that a 'cause' will result in an 'effect' proportional to the 'cause'. A strong 'cause' will lead to a strong trend (effect), while a weak 'cause' will lead to a weak trend.
The Law of Effort vs. Result: This law asserts that the result should reflect the effort exerted. In trading terms, a large volume should result in a significant price move (spread). If the spread is small, the volume should also be small. Any deviation from this pattern is considered an anomaly.
█ Volume and Spread Analysis Bars:
Display: Volume and/or spread bars that consist of color coded levels. If both of these are displayed, the number of spread bars can be limited for visual appeal and understanding, with the spread bars scaled to match the volume bars. While automatic calculation of the number of visual bars for auto scaling is possible, it is avoided to prevent the indicator from reloading whenever the number of visual price bars on the chart is adjusted, ensuring uninterrupted analysis. A displayable table (Legend) of bar colors and levels can give context and clarify to each volume/spread bar.
Calculation: Levels are calculated using multipliers applied to moving averages to represent key levels based on historical data: low, normal, high, ultra. This method smooths out short-term fluctuations and focuses on longer-term trends.
Low Level: Indicates reduced volatility and market interest.
Normal Level: Reflects typical market activity and volatility.
High Level: Indicates increased activity and volatility.
Ultra Level: Identifies extreme levels of activity and volatility.
This illustrates the appearance of Volume and Spread bars when scaled and plotted together:
█ Forecasting Capabilities:
Display: Forecasted volume and spread levels using predictive models.
Calculation: Volume and Spread prediction calculations differ as volume is linear and spread is non-linear.
Volume Forecast (Linear Forecasting): Predicts future volume based on current volume rate and bar time till close.
Spread Forecast (Non-Linear Dynamic Forecasting): Predicts future spread using a dynamic multiplier, less near midpoint (consolidation) and more near low or high (trending), reflecting non-linear expansion.
Moving Averages: In forecasting, moving averages utilize forecasted levels instead of actual levels to ensure the correct level is forecasted (low, normal, high, or ultra).
The following compares forecasted volume with actual resulting volume, highlighting the power of early identifying increased volume through forecasted levels:
█ VSA Patterns:
Criteria and descriptions for each VSA pattern are available as tooltips beside them within the indicator’s settings. These tooltips provide explanations of potential developments based on the volume and spread data.
Signs of Strength (🟢): Patterns indicating strong buying pressure and potential market upturns.
Down Thrust
Selling Climax
No Effort → Bearish Result
Bearish Effort → No Result
Inverse Down Thrust
Failed Selling Climax
Bull Outside Reversal
End of Falling Market (Bag Holder)
Pseudo Down Thrust
No Supply
Signs of Weakness (🔴): Patterns indicating strong selling pressure and potential market downturns.
Up Thrust
Buying Climax
No Effort → Bullish Result
Bullish Effort → No Result
Inverse Up Thrust
Failed Buying Climax
Bear Outside Reversal
End of Rising Market (Bag Seller)
Pseudo Up Thrust
No Demand
Neutral Patterns (🔵): Patterns indicating market indecision and potential for continuation or reversal.
Quiet Doji
Balanced Doji
Strong Doji
Quiet Spinning Top
Balanced Spinning Top
Strong Spinning Top
Quiet High Wave
Balanced High Wave
Strong High Wave
Consolidation
Bar Patterns (🟡): Common candlestick patterns that offer insights into market sentiment. These are required in some VSA patterns and can also be displayed independently.
Bull Pin Bar
Bear Pin Bar
Doji
Spinning Top
High Wave
Consolidation
This demonstrates the acronym and descriptive options for displaying bar patterns, with the ability to hover over text to reveal the descriptive text along with what type of pattern:
█ Alerts:
VSA Pattern Alerts: Notifications for identified VSA patterns at bar close.
Volume and Spread Alerts: Alerts for confirmed and forecasted volume/spread levels (Low, High, Ultra).
Forecasted Volume and Spread Alerts: Alerts for forecasted volume/spread levels (High, Ultra) include a minimum percent time elapsed input to reduce false early signals by ensuring sufficient bar time has passed.
█ Inputs and Settings:
Display Volume and/or Spread: Choose between displaying volume bars, spread bars, or both with different lookback periods.
Indicator Bar Color: Select color schemes for bars (Normal, Detail, Levels).
Indicator Moving Average Color: Select schemes for bars (Fill, Lines, None).
Price Bar Colors: Options to color price bars based on VSA patterns and volume levels.
Legend: Display a table of bar colors and levels for context and clarity of volume/spread bars.
Forecast: Configure forecast display and prediction details for volume and spread.
Average Multipliers: Define multipliers for different levels (Low, High, Ultra) to refine the analysis.
Moving Average: Set volume and spread moving average settings.
VSA: Select the VSA patterns to be calculated and displayed (Strength, Weakness, Neutral).
Bar Patterns: Criteria for bar patterns used in VSA (Doji, Bull Pin Bar, Bear Pin Bar, Spinning Top, Consolidation, High Wave).
Colors: Set exact colors used for indicator bars, indicator moving averages, and price bars.
More Display Options: Specify how VSA pattern text is displayed (Acronym, Descriptive), positioning, and sizes.
Alerts: Configure alerts for VSA patterns, volume, and spread levels, including forecasted levels.
█ Usage:
The Volume Spread Analysis indicator is a helpful tool for leveraging volume spread analysis to make informed trading decisions. It offers comprehensive visual and textual cues on the chart, making it easier to identify market conditions, potential reversals, and continuations. Whether analyzing historical data or forecasting future trends, this indicator provides insights into the underlying factors driving market movements.

Net Buying/Selling Flows Toolkit [AlgoAlpha]🌟📊 Introducing the Net Buying/Selling Flows Toolkit by AlgoAlpha 📈🚀
🔍 Explore the intricate dynamics of market movements with the Net Buying/Selling Flows Toolkit designed for precision and effectiveness in visualizing money inflows and outflows and their impact on asset prices.
🔀 Multiple Display Modes : Choose from "Flow Comparison", "Net Flow", or "Sum of Flows" to view the data in the most relevant way for your analysis.
📏 Adjustable Unit Display : Easily manage the magnitude of the values displayed with options like "1 Billion", "1 Million", "1 Thousand", or "None".
🔧 Lookback Period Customization : Tailor the sum calculation window with a configurable lookback period, applicable in "Sum of Flows" mode.
📊 Deviation Thresholds : Set up lower and upper deviation thresholds to identify significant changes in flow data.
🔄 Reversal Signals and Deviation Bands : Enable signals for potential reversals and visualize deviation bands for comparative analysis.
🎨 Color-coded Visualization : Distinct colors for upward and downward movements make it easy to distinguish between buying and selling pressures.
🚀 Quick Guide to Using the Net Buying/Selling Flows Toolkit :
🔍 Add the Indicator : Add the indicator to you favorites. Customize the settings to fit your trading requirements.
👁️🗨️ Data Analysis : Compare the trend of Buying and Selling to help indicate whether bulls or bears are in control of the market. Utilize the different display modes to present the data in different form to suite your analysis style.
🔔 Set Alerts : Activate alerts for reversal conditions to keep abreast of significant market movements without having to monitor the charts constantly.
🌐 How It Works :
The toolkit processes volume data on a lower timeframe to distinguish between buying and selling pressures based on intra-bar price closing higher or lower than it opened. It aggregates these transactions and finds the net selling and buying that took place during that bar, offering a clearer view of market fundamentals. The indicator then plots this data visually with multiple modes including comparisons between buying/selling and the net flow of the asset. Deviation thresholds help in identifying significant changes, allowing traders to spot potential buying or selling opportunities based on the money flow dynamics. The "Sum of Flows" mode is unique from other trend following indicators as it does not determine trend based on price action, but rather based on the net buying/selling. Therefore in some cases the "Sum of Flows" mode can be a leading indicator showing bullish/bearish net flows even before the prices move significantly.
Embark on a more informed trading journey with this dynamic and insightful tool, tailor-made for those who demand precision and clarity in their trading strategies. 🌟📉📈

Smart Money Liquidity Heatmap [AlgoAlpha]🌟📈 Introducing the Smart Money Liquidity Heatmap by AlgoAlpha! 🗺️🚀
Dive into the depths of market liquidity with our innovative Pine Script™ indicator designed to illuminate the trading actions of smart money! This meticulously crafted tool provides an enhanced visualization of liquidity flow, highlighting the dynamics between smart and retail investors directly on your chart! 🌐🔍
🙌 Key Features of the Smart Money Liquidity Heatmap:
🖼️ Visual Clarity: Uses vibrant heatmap colors to represent liquidity concentrations, making it easier to spot significant trading zones.
🔧 Customizable Settings: Adjust index periods, volume flow periods, and more to tailor the heatmap to your trading strategy.
📊 Dynamic Ratios: Computes the ratio of smart money to retail trading activity, providing insights into who is driving market movements.
👓 Transparency Options: Modify color intensity for better visibility against various chart backgrounds.
🛠 How to Use the Smart Money Liquidity Heatmap:
1️⃣ Add the Indicator:
Add the indicator to favourites. Customize settings to align with your trading preferences, including periods for index calculation and volume flow.
2️⃣ Market Analysis:
Monitor the heatmap for high liquidity zones signalled by the heatmap. These are potential areas where smart money is actively engaging, providing crucial insights into market dynamics.
Basic Logic Behind the Indicator:
The Smart Money Liquidity Heatmap utilizes the Smart Money Interest Index Indicator and operates by differentiating between the trading behaviors of informed (smart money) and less-informed (retail) traders. It calculates the differences between specific volume indices—Positive Volume Index (PVI) for retail investors and Negative Volume Index (NVI) for institutional players—and their respective moving averages, highlighting these differences using the Relative Strength Index (RSI) over user-specified periods. This calculation generates a ratio that is then normalized and compared against a threshold to identify areas of high institutional trading interest, visually representing these zones on your chart as vibrant heatmaps. This enables traders to visually identify where significant trading activities among smart money are occurring, potentially signalling important buying or selling opportunities.
🎉 Elevate your trading experience with precision, insight, and clarity by integrating the Smart Money Liquidity Heatmap into your toolkit today!

Effective Volume Z-ScoreThis indicator aims at responding the question: is the current trend supported by volume?
The concept and formula
The central concept is the Effective Volume, calculated as follow:
effectiveVolume = volume * (close - open) / (high - low)
Then the Effective Volume Z-Score indicator is calculated by smoothing the effective volume and applying the z-score function:
zscore(x) = (x - mean) / stdev
Essentially, the indicator's value represents the number of standard deviations of the effective volume away from the mean.
How to use it
This indicator should be used for trend confirmation.
For an uptrend, the bigger the indicator value, the greater the volume support, while for a downtrend, the lower the indicator value, the greater the volume support.
Divergences are also important, as with every volume indicator.

Volume Breakout [Afnan]Introducing the Relative Volume / Volume Breakout Multiplier (RVI) , RVI is specifically designed for traders who incorporate volume breakout analysis into their trading strategies, particularly breakout traders.
This indicator provides a unique perspective on volume dynamics by quantifying the extent of volume breakouts in relation to the Simple Moving Average (SMA). It offers an upgraded version of the default volume indicator on TradingView, with the added feature of Relative Volume.
For example, if the volume SMA is 100M and the current volume is 200M, the indicator will return a breakout number of 2.0, indicating that the current volume is twice that of the volume SMA. Conversely, if the volume SMA is 100M and the current volume is 50M, the indicator will return a value of 0.50, indicating that the current volume is half of the volume SMA.
This tool can be a very helpful for breakout traders, helping them identify potential trading opportunities and assess volume strength more effectively. this indicator is a must-have in the toolkit of any trader who focuses on volume breakout analysis.
Remember, every tool we use, every analysis we perform, is a step towards becoming better traders. So, let’s embrace this journey of continuous learning and improvement together. As the saying goes, “The only limit to our realization of tomorrow will be our doubts of today." Let’s step into the future with confidence, armed with the right tools and the right mindset.
Lastly, a big thank you for your support, your likes, and your comments. They mean a lot! If you have any questions, feel free to ask. Together, let’s make trading a rewarding experience!

Volume Flow Oscillator (VFO)I created the Volume Flow Oscillator (VFO) to explore the intricate interplay between volume and price movements over a specific lookback period. This tool contrasts volumes that move in sync with the price against those that move in opposition, signaling potential overbought or oversold territories. To determine the direction, I compare the current price to its value four periods back, shedding light on underlying bullish or bearish momentum. The VFO enriches my analysis and decision-making by offering a detailed perspective on how volume trends correlate with price changes. Its color-coded visuals are crucial for highlighting optimal trading points based on volume dynamics.
