GARCH Volume VolatilityGARCH Volume Volatility (GV)
Description
Concept This indicator applies GARCH (Generalized Autoregressive Conditional Heteroskedasticity) concepts to Volume rather than Price. While most traders analyze volume as a raw figure, this script calculates the volatility of volume changes.
By understanding how stable or erratic volume flow is, traders can identify periods of institutional accumulation (often stable, high volume) versus panic or exhaustion (erratic, exploding volume volatility). The script uses an EWMA (Exponentially Weighted Moving Average) model to smooth squared volume returns, providing a highly responsive metric for volume variance.
How It Works The calculation follows a strict statistical methodology to ensure accuracy:
Returns Calculation: First, the script calculates the period-over-period change in volume. Users can select between Logarithmic Returns (ideal for handling the skew in volume data) or standard percentage change.
Variance Proxy: These returns are squared to calculate the raw variance.
EWMA Smoothing (The GARCH Component): Instead of a simple moving average, the script applies an EWMA filter. This uses a lambda (decay factor) to weigh recent variance more heavily than past variance.
Formula logic: Variance_t = lambda * Variance_{t-1} + (1 - lambda) * Returns^2_t
This recursive calculation mimics the "RiskMetrics" approach to volatility, adapting quickly to sudden volume shocks.
Dynamic Thresholds: The script calculates a Mean and Standard Deviation (Z-Score bands) of the resulting volatility to generate dynamic Overbought/Oversold zones for volume stability.
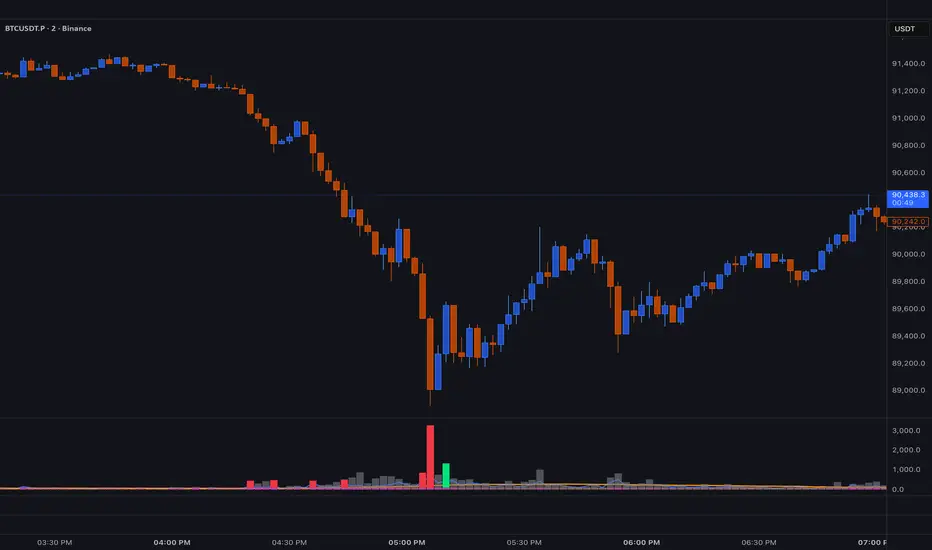
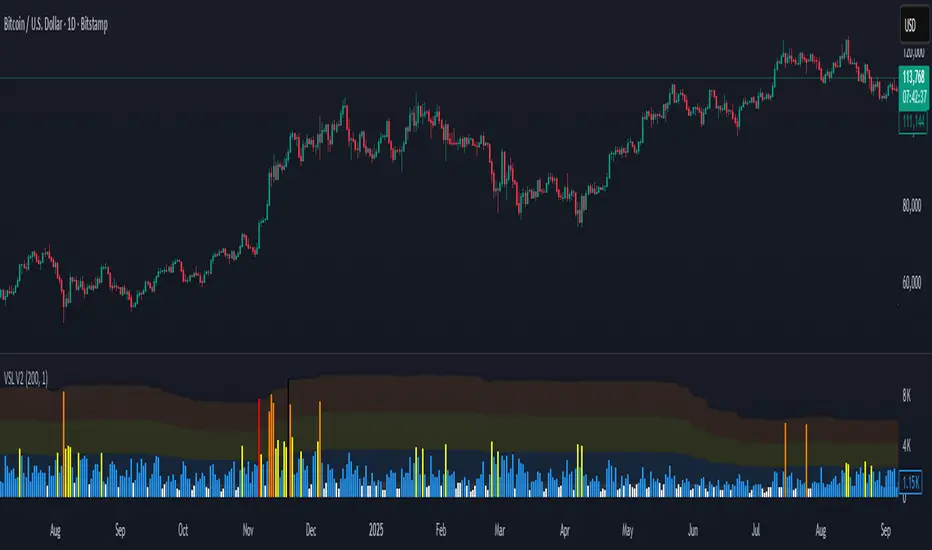
Visuals & usage The indicator displays a histogram representing the current Volume Volatility, color-coded by its intensity relative to the dynamic bands:
Red (High Band): Indicates extreme volume volatility (3+ Standard Deviations). This often occurs during capitulation bottoms or euphoric tops where volume consistency breaks down completely.
Maroon (Above Mean): Indicates elevated volatility. Volume is changing rapidly, suggesting active fighting between buyers and sellers.
Green (Low Band): Indicates low volatility. This suggests volume is flowing consistently. In trends, consistent volume (low volatility) often confirms a sustainable move.
Settings
Use EWMA: Toggles the recursive GARCH-style calculation. If disabled, it reverts to a simple SMA of variance.
Log Returns: Recommended true. Uses log-change for smoother handling of massive volume spikes.
EWMA Lambda: The decay factor (Default 0.94). Higher values make the indicator smoother; lower values make it more reactive to immediate shocks.
Threshold Lookback: The length of the window used to calculate the dynamic bands (High/Low zones).
Disclaimer This tool is designed for technical analysis of volume patterns and does not guarantee future price direction. Volume analysis is subjective and should be used in confluence with price action.
Volumespike

BT SpikeBT Spike is a lightweight but highly effective alert engine designed to identify
moments of unusual volatility and volume expansion . These spikes often appear
at the very beginning of major moves, giving traders early insight into:
Momentum ignition
Breakout confirmation
Liquidity shifts
Stop runs & displacement moves
Trend acceleration
High-impact expansions before news or volatility events
Rather than watching charts all day, BT Spike allows traders to receive
instant alerts whenever the market enters an abnormal volatility regime.
---
■ What BT Spike Measures
1. ATR Spike
Detects sudden expansion in true range (micro-volatility).
This often marks the beginning of a displacement candle.
2. Volume Spike
Identifies candles where volume exceeds typical market participation.
3. Combined Spike
A powerful signal triggered only when both conditions occur together:
ATR Spike AND Volume Spike
4. Spike Score (0–100)
A normalized measure of spike intensity.
• Higher score → Stronger anomaly
• 90+ → Extreme event (liquidity shifts, stop runs, institutional activity)
---
■ Visual Elements
• True Range Line
Shows per-candle volatility relative to baseline ATR.
• Volume Bars (Color-Scaled)
Volume bars turn:
Green for bullish spikes
Red for bearish spikes
Intensity based on Spike Score
Gray during normal activity
This creates a clear volatility heatmap directly in the volume panel.
• Spike Score Histogram
Helps visually identify:
Minor spikes
Major volatility clusters
Extreme anomalies
• Threshold Lines
Yellow = Minor
Orange = Major
Red = Extreme
---
■ Why BT Spike Is Useful
Spike-based analysis helps traders:
Catch large moves early
Confirm breakouts and avoid fake ones
Identify when smart money enters the market
Find the start of momentum legs
Monitor many charts with alerts instead of manual watching
A spike is often the first footprint of a meaningful move.
---
■ Practical Trading Uses
1. Breakout Confirmation
A breakout with no spike is often weak.
A breakout with a spike is typically genuine and sustained.
2. Reversal Detection
Extreme spike after a sweep often signals a reversal event.
3. Trend Ignition
Spikes frequently occur at the beginning of:
Trend legs
News-driven surges
Momentum continuation moves
4. Divergence With Price
High-volume, high-ATR spikes with little price movement can indicate:
Absorption
Trap conditions
Exhaustion
5. Alert-Driven Market Monitoring
Set alerts for:
ATR Spike
Volume Spike
Combined Spike
Major Spike (Score ≥ threshold)
Extreme Spike (Score ≥ threshold)
This allows traders to walk away while still catching every volatility event.
---
■ Spike Score Guide
0–30 → Mild noise
30–60 → Minor shift
60–80 → Strong volatility expansion
80–95 → Major spike (high-impact)
95–100 → Extreme event (institutional presence, sweeps, stop runs)
---
■ Final Summary
BT Spike gives traders:
Early detection of volatility expansion
Bull/Bear intensity visualization
Powerful alert automation
A universal signal layer that fits any strategy
Cleaner insight into where major moves originate
BT Spike = Your volatility radar .
It tells you when to look at a chart—before the move happens.
Kinetic EMA & Volume with State EngineKinetic EMA & Volume with State Engine (EMVOL)
1. Introduction & Concept
The EMVOL indicator converts a dense family of EMA signals and volume flows into a compact “state engine”. Instead of looking at individual EMA lines or simple crossovers, the script treats each EMA as part of a kinetic vector field and classifies the market into interpretable states:
- Trend direction and strength (from a grid of prime‑period EMAs).
- Volume regime (expansion, contraction, climax, dry‑up).
- Order‑flow bias via delta (buy versus sell volume).
- A combined scenario label that summarises how these three layers interact.
The goal is educational: to help traders see that moving averages and volume become more meaningful when observed as a structure, not as isolated lines. EMVOL is therefore designed as a real‑time teaching tool, not as an automatic signal generator.
2. Volume Settings
Group: “Volume Settings”
A. Calculation Method
- Geometry (Source File) – Default mode.
Buy and sell volume are estimated from each candle’s geometry: the close is compared to the high/low range and the bar’s total volume is split proportionally between buyers and sellers. This approximation works on any TradingView plan and does not require lower‑timeframe data.
- Intrabar (Precise) – Reconstructs buy/sell volume using a lower timeframe via requestUpAndDownVolume(). The script asks TradingView for historical intrabar data (e.g., 15‑second bars) and builds buy/sell volume and delta from that stream. This mode can produce a more accurate view of order flow, but coverage is limited by your account’s history limits and the symbol’s available lower‑timeframe data.
B. Intrabar Resolution (If Precise)
- Intrabar Resolution (If Precise) – Selected only when the calculation method is “Intrabar (Precise)”. It defines which lower timeframe (for example 15S, 30S, 1m) is used to compute up/down volume. Smaller intrabar timeframes may give smoother and more granular deltas, but require more historical depth from the platform.
When “Intrabar (Precise)” is active, the dashboard’s extended section shows the resolution and the number of bars for which precise volume has been successfully retrieved, in the format:
- Mode: Intrabar (15S) – where N is the count of bars with valid high‑resolution volume data.
In Geometry mode this counter simply reflects the processed bars in the current session.
3. Kinetic Vector Settings
Group: “Kinetic Vector”
A. Vector Window
- Vector Window – Controls the temporal smoothing applied to the aggregated vectors (trend, volume, delta, etc.). Internally, each bar’s vector value is averaged with a simple moving window of this length.
- Shorter windows make the state engine more reactive and sensitive to local swings.
- Longer windows make the states more stable and better suited to higher‑timeframe structure.
B. Max Prime Period
- Max Prime Period – Sets the largest prime number used in the EMA grid. The engine builds a family of EMAs on prime lengths (2, 3, 5, 7, …) up to this limit and converts their slopes into angles.
- A higher limit increases the number of long‑horizon EMAs in the grid and makes the vectors sensitive to broader structure.
- A lower limit focuses the analysis on short- and medium‑term behaviour.
C. Price Source
- Price Source – The price series from which the kinetic EMA grid is built (e.g., Close, HLC3, OHLC4). Changing the source modifies the context that the state engine is reading but does not change the core logic.
4. State Engine Settings
Group: “State Engine Settings”
These inputs define how the continuous vectors are translated into discrete states.
A. Trend Thresholds
- Strong Trend Threshold – Value above which the trend vector is treated as “extreme bullish” and below which it is “extreme bearish”.
- Weak Trend Threshold – Inner boundary between neutral and directional conditions.
Roughly:
- |trend| < weak → Neutral trend state.
- weak < |trend| ≤ strong → Bullish/Bearish.
- |trend| > strong → Extreme Bullish/Extreme Bearish.
B. Volume Thresholds
- Volume Climax Threshold – Upper bound at which volume is considered “climax” (unusually expanded participation).
- Volume Expansion Threshold – Boundary for normal expansion versus contraction.
Conceptually:
- Volume above “expansion” indicates increasing activity.
- Volume near or above “climax” marks extreme participation.
- Negative values below the symmetric thresholds map to contraction and extreme dry‑up (liquidity vacuum) states.
C. Delta Thresholds
- Strong Delta Threshold – Cut‑off for extreme buying or selling dominance in delta.
- Weak Delta Threshold – Threshold for mild buy/sell bias versus neutral order flow.
Combined with the sign of the delta vector, these thresholds classify order flow as:
- Extreme Buy, Buy‑Dominant, Neutral, Sell‑Dominant, Extreme Sell.
D. State Hysteresis Bars
- State Hysteresis Bars – Minimum number of bars for which a new state must persist before the engine commits to the change. This prevents the dashboard from flickering during fast spikes and emphasises persistent market behaviour.
- Smaller values switch states quickly; larger values demand more confirmation.
5. Visual Interface
Group: “Visual Interface”
A. Ribbon Base Color
- Ribbon Base Color – Base hue for the multi‑layer EMA ribbon drawn around price. The script plots a dense grid of hidden EMAs and fills the gaps between them to form a semi‑transparent band. Narrow, overlapping bands hint at compression; wider separation hints at dispersion across EMA horizons.
B. Show Dashboard
- Show Dashboard – Toggles the on‑chart table which summarises the current state engine output. Disable this if you only want to keep the EMA ribbon and volume‑based structure on the price chart.
C. Color Theme
- Color Theme – Switch between a dark and light style for the dashboard background and text colours so that the table matches your chart theme.
D. Table Position
- Table Position – Places the dashboard at any corner or edge of the chart (Top / Middle / Bottom × Left / Centre / Right).
E. Table Size
- Table Size – Changes the dashboard’s text size (Tiny, Small, Normal, Large). Use a larger size on high‑resolution screens or when streaming.
F. Show Extended Info
- Show Extended Info – Adds diagnostic rows under the main state summary:
- Mode / Primes / Vector – Shows the current calculation mode (Geometry / Intrabar), the selected intrabar resolution and coverage in bars ( ), how many prime periods are active, and the vector window.
- Values – Displays the current aggregated vectors:
- P: price vector
- V: volume vector
- B: buy‑volume vector
- S: sell‑volume vector
- D: delta vector
Values are bounded between ‑1 and +1.
- Volume Stats – Prints the last bar’s raw buy volume, sell volume and delta as formatted numbers.
- Footer – A final row with the symbol and current time: #SYMBOL | HH:MM.
These extended rows are meant for inspecting how the engine is behaving under the hood while you scroll the chart and compare different assets or timeframes.
6. Language Settings
Group: “Language Settings”
- Select Language – Switches the entire dashboard between English and Turkish.
The underlying calculations and scenario logic are identical; only the labels, titles and comments in the table are translated.
7. Dashboard Structure & Reading Guide
The table summarises the current situation in a few rows:
1. System Header – Shows the script name and the active calculation method (“Geometry” or “Intrabar”).
2. Scenario Title – High‑level description of the current combined scenario (e.g., “Trending Buy Confirmed”, “Sideways Balanced”, “Bull Trap”, “Blow‑Off Top”). The background colour is derived from the scenario family (trending, compression, exhaustion, anomaly, etc.).
3. Bias / Trend Line – States the dominant trend bias derived from the trend vector (Extreme Bullish, Bullish, Neutral, Bearish, Extreme Bearish).
4. Signal / Consideration Line – A short sentence giving qualitative guidance about the current state (for example: continuation risk, exhaustion risk, trap‑like behaviour, or compression). This is deliberately phrased as a consideration, not as a direct trading signal.
5. Trend / Volume / Delta Rows – Three separate rows explain, in plain language, how the trend, volume regime and delta are classified at this bar.
6. Extended Info (optional) – Mode / primes / vector settings, current vector values, and last‑bar volume statistics, as described above.
Together, these rows are meant to be read as a narrative of what price, volume and order‑flow are doing, not as mechanical instructions.
8. State Taxonomy
The state engine organizes market behaviour in three stages.
8.1 Trend States (from the Price Vector)
- Extreme Bullish Trend – The prime‑grid price vector is strongly upward; most EMAs are aligned to the upside.
- Bullish Trend – Upward bias is present, but less extreme.
- Neutral Trend – EMAs are mixed or flat; price is effectively sideways relative to the grid.
- Bearish Trend – Downward bias, with the EMA grid sloping down.
- Extreme Bearish Trend – Strong downside alignment across the grid.
8.2 Volume Regime States (from the Volume Vector)
- Volume Climax (Buy‑Side) – Strong positive volume vector; participation is unusually high in the current direction.
- Volume Expansion – Activity above normal but below the climax threshold.
- Neutral Volume – No major expansion or contraction versus recent history.
- Volume Contraction – Activity is drying up compared with the past.
- Extreme Dry‑Up / Liquidity Vacuum – Very low participation; the market is thin and prone to slippage.
8.3 Delta Behaviour States (from the Delta Vector)
- Extreme Buy Delta – Buying pressure dominates strongly.
- Buy‑Dominant Delta – Buy volume exceeds sell volume, but not at an extreme.
- Neutral Delta – Buy and sell flows are roughly balanced.
- Sell‑Dominant Delta – Selling pressure dominates.
- Extreme Sell Delta – Aggressive, one‑sided selling.
8.4 Combined Scenario State s
EMVOL uses the three base states above to generate a single scenario label. These scenarios are designed to be read as context, not as entry or exit signals.
Trending Scenarios
1. Trending Buy Confirmed
- Bullish or extreme bullish trend, supported by expanding or climax volume and buy‑side delta.
- Educational idea: a healthy uptrend where both participation and order flow agree with the direction.
2. Trending Buy – Weak Volume
- Bullish trend, but volume is neutral, contracting or in dry‑up while delta is still buy‑side.
- Educational idea: price is advancing, yet participation is thinning; trend continuation becomes more fragile.
3. Trending Sell Confirmed
- Bearish or extreme bearish trend, with expanding or climax volume and sell‑side delta.
- Educational idea: strong downtrend with both volume and order‑flow confirmation.
4. Trending Sell – Weak Volume
- Bearish trend, but volume is neutral, contracting or very low while delta remains sell‑side.
- Educational idea: downside continues but with limited participation; vulnerable to short‑covering.
Sideways / Range Scenarios
5. Sideways Balanced
- Neutral trend, neutral delta, neutral volume.
- Classic range environment; low directional edge, suitable for observation and context rather than trend trading.
6. Sideways with Buy Pressure
- Neutral trend, but buy‑side delta is dominant or extreme.
- Range with latent accumulation: price may still appear sideways, but buyers are quietly more active.
7. Sideways with Sell Pressure
- Neutral trend with dominant or extreme sell‑side delta.
- Distribution‑like environment where price chops while sellers are gradually more aggressive.
Exhaustion & Volume Extremes
8. Exhaustion – Buy Risk
- Extreme bullish trend, volume climax and strong buy‑side delta.
- Educational idea: very strong up‑move where both participation and delta are already stretched; risk of exhaustion or blow‑off.
9. Exhaustion – Sell Risk
- Extreme bearish trend, volume dry‑up and strong sell‑side delta.
- Suggests one‑sided selling into increasingly thin liquidity.
10. Volume Climax (Buy)
- Neutral trend, neutral delta, but volume at climax levels.
- Often associated with a “big event” bar where participation spikes without a clear directional commitment.
11. Volume Climax (Sell / Dry‑Up)
- Neutral trend and neutral delta, while the volume vector indicates an extreme dry‑up.
- Highlights a stand‑still episode: very limited interest from both sides, increasing the sensitivity to future impulses.
Divergences
12. Divergence – Bullish Context
- Bullish or extreme bullish trend, but delta has faded back to neutral.
- Price trend continues while order‑flow conviction softens; can precede pauses or complex corrections.
13. Divergence – Bearish Context
- Bearish or extreme bearish trend with a neutral delta.
- Downtrend persists, but selling pressure no longer dominates as clearly.
Consolidation & Compression
14. Consolidation
- Default state when no specific pattern dominates and the market is broadly balanced.
- Educational use: treat this as a “no strong edge” label; focus on structure rather than direction.
15. Breakout Imminent
- Neutral trend with contracting volume.
- Compression phase where energy is building up; often precedes transitions into trending or shock scenarios.
Traps & Hidden Divergences
16. Bull Trap
- Bullish trend, with neutral or contracting volume and sell‑side delta.
- Price appears strong, but order‑flow shifts against it; often seen near fake breakouts or failing rallies.
17. Bear Trap
- Bearish trend, neutral or contracting volume, but buy‑side delta.
- Downtrend “looks” intact, while buyers become more aggressive underneath the surface.
18. Hidden Bullish Divergence
- Bullish trend, contracting volume, but strong buy‑side delta.
- Educational idea: price dips or slows while aggressive buyers step in, often inside an ongoing uptrend.
19. Hidden Bearish Divergence
- Bearish trend, volume expansion and strong sell‑side delta.
- Reinforced downside pressure even if price is temporarily retracing.
Reversal & Transition Patterns
20. Reversal to Bearish
- Neutral trend, volume climax and strong sell‑side delta.
- Suggests that heavy selling appears at the top of a move, turning a previously neutral or rising context into potential downside.
21. Reversal to Bullish
- Neutral trend, extreme volume dry‑up and strong buy‑side delta.
- Often associated with selling exhaustion where buyers start to take control.
22. Indecision Spike
- Neutral trend with extreme volume (climax or dry‑up) but neutral delta.
- Crowd participation changes sharply while order‑flow remains undecided; treat as an informational spike rather than a direction.
Extended Compression & Acceleration
23. Coiling Phase
- Neutral trend, contracting volume, and delta that is neutral or only mildly one‑sided.
- Extended compression where price, volume and delta all contract into a tightly coiled range, often preceding a strong move.
24. Bullish Acceleration
- Bullish trend with volume expansion and strong buy‑side delta.
- Uptrend not only continues but gains kinetic strength; educationally, this illustrates how trend, volume and delta align in the strongest phases of a move.
25. Bearish Acceleration
- Bearish trend with volume expansion and strong sell‑side delta.
- Mirror image of Bullish Acceleration on the downside.
Trend Exhaustion & Climax Reversal
26. Bull Exhaustion
- Bullish or extreme bullish trend, with contraction or dry‑up in volume and buy‑side or neutral delta.
- The move has already travelled far; participation fades while price is still elevated.
27. Bear Exhaustion
- Bearish or extreme bearish trend, with volume climax or contraction and sell‑side or neutral delta.
- Down‑move may be approaching a point where additional selling pressure has diminishing impact.
28. Blow‑Off Top
- Extreme bullish trend, volume climax and extreme buy delta all at once.
- Classic blow‑off behaviour: price, volume and order‑flow are simultaneously stretched in the same direction.
29. Selling Climax Reversal
- Extreme bearish trend with extreme volume dry‑up and extreme sell‑side delta.
- Marks a very aggressive capitulation phase that can precede major rebounds.
Advanced VSA / Anomaly Scenarios
30. Absorption
- Typically neutral trend with expanding or climax volume and extreme delta (either buy or sell).
- Educational focus: large participants are aggressively absorbing liquidity from the opposite side, while price remains relatively contained.
31. Distribution
- Scenario where volume remains elevated while directional conviction weakens and the trend slows.
- Represents potential “selling into strength” or “buying into weakness”, depending on the active side.
32. Liquidity Vacuum
- Combination of thin liquidity (extreme dry‑up) with a directional trend or strong delta.
- Highlights environments where even small orders can move price disproportionately.
33. Anomaly / Shock Event
- Triggered when the vector z‑scores detect rare combinations of price, volume and delta behaviour that deviate from their own historical distribution.
- Intended as a warning label for unusual events rather than a specific tradeable pattern.
9. Educational Usage Notes
- EMVOL does not produce mechanical “buy” or “sell” commands. Instead, it classes each bar into an interpretable state so that traders can study how trends, volume and order‑flow interact over time.
- A common exercise is to overlay your usual EMA crossovers, support/resistance or price patterns and observe which EMVOL scenarios appear around entries, exits, traps and climaxes.
- Because the vectors are normalized (bounded between ‑1 and +1) and then discretized, the same conceptual states can be compared across different symbols and timeframes.
10. Disclaimer & Educational Purpose
This indicator is provided strictly as an educational and analytical tool. Its purpose is to help visualise how price, volume and order‑flow interact; it is not designed to function as a stand‑alone trading system.
Please note:
1. No Automated Strategy – The script does not implement a complete trading strategy. Scenario labels and dashboard messages are descriptive and should not be followed as unconditional entry or exit signals.
2. No Financial Advice – All information produced by this indicator is general market analysis. It must not be interpreted as investment, financial or trading advice, or as a recommendation to buy or sell any instrument.
3. Risk Warning – Trading and investing involve substantial risk, including the risk of loss. Always perform your own analysis, use appropriate position sizing and risk management, and consult a qualified professional if needed. You are solely responsible for any decisions made using this tool.
4. Data Precision & Platform Limits – The “Intrabar (Precise)” mode depends on the availability of high‑resolution historical data at the chosen intrabar timeframe. If your TradingView plan or the symbol’s history does not provide sufficient depth, this mode may only partially cover the visible chart. In such cases, consider switching to “Geometry (Source File)” for a fully populated view.

Bullish Volume RatioBullish Volume Ratio (BVR) Indicator
The Bullish Volume Ratio (BVR) is a sophisticated momentum oscillator designed to measure the true intensity of buying pressure versus selling pressure in the market. It provides a unique, statistically-driven view of market conviction, making it an essential tool for traders who seek to confirm trend health and anticipate major shifts.
BVR achieves its precision by not only assessing net volume but also using proprietary volume weighting logic to gauge the quality of participation in each candle, filtering out market noise to present a clear picture of underlying demand.
Key Features
Statistically-Driven Conviction: The indicator utilizes a Z-Score to measure how far the current BVR reading deviates from its historical average, providing an objective measure of whether buying or selling is truly exceptional or just noise.
Clear Visual Signals: The oscillator plot is designed for clear interpretation on a separate pane, helping you identify regime shifts without cluttering the main price chart.
Real-Time Data Dashboard (Optional): A customizable table on the chart displays the current BVR, Z-score, and other critical volume metrics at a glance.
Simplified Trading Guide
The BVR indicator simplifies volume analysis into clear, actionable signals that can be used for trend confirmation and reversal anticipation.
1. Trend Confirmation
Use the BVR to confirm the momentum of an existing trend:
Bullish Confirmation: When price is trending up, look for the BVR line to be rising and consistently above the center line. This signals that buyers are in firm control and the uptrend has strong volume conviction.
Bearish Confirmation: When price is trending down, look for the BVR line to be falling and deep below the center line. This indicates sellers are dominating the volume profile, confirming the strength of the downtrend.
2. Identifying Trade Entry/Exit Zones
The indicator's Z-Score component is key to spotting extremes that often precede a reversal:
Potential Long Entry: Look for a sustained negative Z-Score followed by a sharp crossover back towards the center line or into positive territory. This can signal that selling pressure has reached an exhaustion point and accumulation (buying) is beginning.
Potential Short Entry: Look for a sustained positive Z-Score followed by a sharp crossover back towards the center line or into negative territory. This suggests that buying momentum is exhausted and distribution (selling) is commencing.
3. The Volume Spike Filter
The indicator also alerts you to candles with significantly high volume relative to the recent average. Use this as a filter:
Breakout Validation: A price breakout is more likely to be legitimate if it is accompanied by a high volume spike confirmed by a strong BVR reading in the direction of the breakout.
Reversal Warning: A high volume spike at a key support or resistance level, particularly one that leads to a sharp turn in the BVR, can strongly signal a climactic reversal in progress.

Volume essential parameters overlayVolume EPO – Essential Volume Parameters Overlay
1. Motivation and design philosophy
Volume EPO is designed as a conceptual overlay rather than a self contained trading system. The main idea behind this script is to take complex, foundational market concepts out of heavy, menu driven strategies and express them as lightweight, independent layers that sit on top of any chart or indicator.
In many TradingView scripts, a single strategy tries to handle everything at once: signal logic, risk settings, visual cues, multi timeframe controls, and conceptual explanations. This usually leads to long input menus, performance issues, and difficult maintenance. The architectural approach behind Volume EPO is the opposite: keep the core strategy lean, and move the explanation and measurement of key concepts into dedicated overlays.
In this framework, Volume EPO is the base layer for the concept of volume. It does not decide anything about entries or exits. Instead, it exposes and clarifies how different definitions of volume behave candle by candle. Other layers or strategies can then build on top of this understanding.
2. What Volume EPO does
Volume EPO focuses on four essential volume parameters for each bar:
- Buy volume - Sell volume - Total volume - Delta volume (the difference between buy and sell volume)
The script presents these parameters in a compact heads up display (HUD) table that can be positioned anywhere on the chart. It is designed to be visually minimal, language aware, and usable on top of any other indicator or price action without cluttering the view.
The indicator does not output signals, alerts, arrows, or strategy entries. It is a descriptive and educational tool that shows how volume is distributed, not a prescriptive tool that tells the trader what to do.
3. Two definitions of volume
A central theme of this script is that there is more than one way to define and interpret “volume” inside a single candle. Volume EPO implements and clearly separates two different approaches:
- A geometric, candle based approximation that uses only OHLC and volume of the current bar. - An intrabar, data driven definition that uses lower timeframe up and down volume when it is available.
The user can switch between these modes via the calculation method input. The mode is prominently shown inside the on chart table so that the context is always explicit.
3.1 Geometry mode (Source File, approximate)
In Geometry mode, Volume EPO works only with the current bar’s OHLC values and total volume. No lower timeframe data is required.
The candle’s range is defined as high minus low. If the range is positive, the position of the close inside that range is used as a simple model for how volume might have been distributed between buyers and sellers:
- The closer the close is to the high, the more of the total volume is attributed to the buying side. - The closer the close is to the low, the more of the total volume is attributed to the selling side. - In a rare case where the bar has no price range (for example a flat or doji bar), total volume is split evenly between buy and sell volume.
From this model, the script derives:
- Buy volume (approximated) - Sell volume (approximated) - Total volume (as reported by the bar) - Delta volume as the difference between buy and sell volume
This approach is intentionally labeled as “Geometry (Approx)” in the HUD. It is a theoretical reconstruction based solely on the candle’s geometry and total volume, and it is always available on any market or timeframe that provides OHLCV data.
3.2 Intrabar mode (Precise)
In Intrabar mode, Volume EPO uses the TradingView built in library for up and down volume on a user selected lower timeframe. Instead of inferring volume from the shape of the candle, it reads the underlying lower timeframe data when that data is accessible.
The script requests up and down volume from a lower timeframe such as 15 seconds, using the official TA library functions. The results are then interpreted as follows:
- Buy volume is taken as the absolute value of the up volume. - Sell volume is taken as the absolute value of the down volume. - Total volume is the sum of buy and sell volume. - Delta volume is provided directly by the library as the difference between up and down volume.
If valid lower timeframe data exists for a bar, the bar is counted as covered by Intrabar data. If not, that bar is marked as invalid for this precise calculation and is excluded from the covered count.
This mode is labeled “Precise” in the HUD, together with the selected lower timeframe, because it is anchored in actual intrabar data rather than in a geometric model. It provides a closer view of how buying and selling pressure unfolded inside the bar, at the cost of requiring more data and being dependent on the availability of that data.
4. Coverage, lookback, and what the numbers mean
The top part of the HUD reports not only which volume definition is active, but also an additional line that describes the effective coverage of the data.
In Intrabar (Precise) mode, the script displays:
- “Scanned: N Bars”
Here, N counts how many bars since the indicator was loaded have successfully received valid lower timeframe delta data. It is a measure of how much of the visible history has been truly covered by intrabar information, not a lookback window in the sense of a rolling calculation.
In Geometry mode, the script displays:
- “Lookback: L Bars”
In this extracted layer, the lookback value L is purely descriptive. It does not change how the current bar’s volume is computed, and it is not used in any iterative or statistical calculation inside this script. It is meant as a conceptual label, for example to keep the volume layer consistent with a broader framework where lookback length is a structural parameter.
Summarizing these two fields:
- Scanned tells you how many bars have been processed using real intrabar data. - Lookback is a descriptive parameter in Geometry mode in this specific overlay, not a direct driver of the computations.
5. The HUD layout on the chart
The on chart table is intentionally compact and structured to be read quickly:
- Header: a title identifying the overlay as Volume EPO. - Mode line: explicitly states whether the script is in Precise or Geometry mode, and for Precise mode also shows the lower timeframe used. - Coverage line: - In Precise mode, it shows “Scanned: N Bars”. - In Geometry mode, it shows “Lookback: L Bars”. - Volume block: - A line for buy and sell volume, marked with clear directional symbols. - A line for total volume and the absolute delta, accompanied by the sign of the delta. - Numeric formatting uses human friendly suffixes (for example K, M, B) to keep the display readable. - Footer: the current symbol and a time stamp, adjusted by a user selectable timezone offset so that the HUD can be aligned with the trader’s local time reference.
The table can be positioned anywhere on the chart and resized via inputs, and it supports multiple color themes and languages in order to integrate cleanly into different chart layouts.
6. How to use Volume EPO in practice
Volume EPO is meant to be read together with price action and other tools, not in isolation. Typical uses include:
- Studying how often a strong directional candle is actually supported by dominant buy or sell volume. - Comparing the behavior of delta volume between Geometry and Intrabar definitions. - Building a personal intuition for how intrabar data refines or contradicts the simple candle based approximation. - Feeding these insights into separate, lean strategy scripts that do not need to carry the full explanatory logic of volume inside them.
Because it is an overlay layer, Volume EPO can be stacked with other custom indicators without adding new signals or complexity to their logic. It simply adds a clear and consistent view of volume behavior on top of whatever the trader is already watching.
7. Educational and non signalling nature
Finally, it is important to stress that Volume EPO is not a trading system, not a signal generator, and not financial advice. The script does not tell the user when to enter or exit. It only reports how different definitions of volume describe the current bar.
Deciding whether to trade, how to trade, and which risk parameters to use remains entirely with the user and with their own strategy. Volume EPO provides context and clarity around the concept of volume so that those decisions can be informed by a better understanding of how buying and selling pressure is structured inside each candle.
Note: Even on lower timeframes, every reconstruction of volume remains an approximation, except at the true single tick level. However, the closer the chosen lower timeframe is to a one tick stream, the more accurately it can reflect the underlying order flow and balance between buying and selling pressure.

EMA 12-26-100 Momentum Strategy# Triple EMA Multi-Signal Momentum Strategy
## 📊 Overview
**Triple EMA Multi-Signal** is a comprehensive trend-following momentum strategy designed specifically for cryptocurrency markets. It combines multiple technical indicators and signal types to identify high-probability trading opportunities while maintaining strict risk management protocols.
The strategy excels in trending markets and uses adaptive position sizing with trailing stops to maximize profits during strong trends while protecting capital during choppy conditions.
## 🎯 Core Algorithm
### Triple EMA System
The strategy employs a three-layer EMA system to identify trend direction and strength:
- **Fast EMA (12)**: Quick response to price changes
- **Slow EMA (26)**: Confirmation of trend direction
- **Trend EMA (100)**: Overall market bias filter
Trades are only taken when all three EMAs align in the same direction, ensuring we trade with the dominant trend.
### Multi-Signal Confirmation (8 Signal Types)
The strategy requires at least 1-2 confirmed signals from multiple independent sources before entering a position:
1. **EMA Crossover** - Fast EMA crossing Slow EMA (primary signal)
2. **MACD Cross** - MACD line crossing signal line (momentum confirmation)
3. **RSI Reversal** - RSI bouncing from oversold/overbought zones
4. **Price Action** - Strong bullish/bearish candles (>60% of range)
5. **Volume Spike** - Above-average volume confirmation
6. **Breakout** - Price breaking 20-period high/low with volume
7. **Pullback to EMA** - Trend continuation after healthy retracement
8. **Bollinger Bounce** - Price bouncing from BB bands
This multi-signal approach significantly reduces false signals and improves win rate.
## 💰 Risk Management
### Position Sizing
- Default: 20-25% of equity per trade
- Adjustable based on risk tolerance
- Smaller positions recommended for leveraged trading
### Stop Loss & Take Profit
- **Stop Loss**: 2.0% (tight control of risk)
- **Take Profit**: 5.5% (2.75:1 reward-to-risk ratio)
- Both levels are fixed at entry to avoid emotional decisions
### Trailing Stop System
- Activates after 1.8% profit
- Trails at 1.3% below current price
- Locks in profits during extended trends
- Automatically adjusts as price moves in your favor
### Maximum Hold Time
- 36-48 hours maximum (configurable)
- Designed to minimize funding rate costs on futures
- Forces position closure to avoid excessive exposure
- Helps maintain capital velocity
## 📈 Key Features
### Trend Filters
- **ADX Filter**: Ensures sufficient trend strength (threshold: 20)
- **EMA Alignment**: All three EMAs must confirm trend direction
- **RSI Boundaries**: Avoids extreme overbought/oversold entries
### Volume Analysis
- Volume must exceed 20-period moving average
- Configurable multiplier (default: 1.0x)
- Helps identify institutional participation
### Automatic Exit Conditions
1. Take Profit target reached
2. Stop Loss triggered
3. Trailing stop activated
4. Trend reversal (EMA cross in opposite direction)
5. Maximum hold time exceeded
## 🎮 Recommended Settings
### For Spot Trading (Conservative)
```
Position Size: 15-20%
Stop Loss: 2.5%
Take Profit: 6.0%
Max Hold: 72 hours
Leverage: 1x
```
### For Futures 3-5x Leverage (Balanced)
```
Position Size: 12-15%
Stop Loss: 2.0%
Take Profit: 5.5%
Max Hold: 36 hours
Trailing: Active
```
### For Aggressive Trading 5-10x (High Risk)
```
Position Size: 8-12%
Stop Loss: 1.5%
Take Profit: 4.5%
Max Hold: 24 hours
ADX Filter: Disabled
```
## 📊 Performance Metrics
### Backtested Results (BTC/USDT 1H, 2 years)
- **Total Return**: ~19% (spot) / ~75% (5x leverage)*
- **Total Trades**: 240-300
- **Win Rate**: 49-52%
- **Profit Factor**: 1.25-1.50
- **Max Drawdown**: ~18-22%
- **Average Trade**: 0.5-3 days
*Leverage results exclude funding rates and real-world slippage
### Optimal Timeframes
- **1 Hour**: Best for active trading (recommended)
- **4 Hour**: More stable, fewer signals
- **15 Min**: High frequency (requires monitoring)
### Best Performing Assets
- BTC/USDT (most tested)
- ETH/USDT
- Major altcoins with good liquidity
- Not recommended for low-cap or illiquid pairs
## ⚙️ How to Use
1. **Add to Chart**: Apply strategy to 1H BTC/USDT chart
2. **Adjust Settings**: Configure risk parameters based on your preference
3. **Review Signals**: Green = Long, Red = Short, labels show signal count
4. **Monitor Performance**: Check strategy tester for detailed statistics
5. **Optimize**: Use strategy optimization to find best parameters for your market
## 🎨 Visual Indicators
The strategy provides clear visual feedback:
- **EMA Lines**: Blue (Fast), Red (Slow), Orange (Trend)
- **BUY/SELL Labels**: Show entry points with signal count
- **Stop/Target Lines**: Red (SL), Green (TP) displayed during active trades
- **Background Color**: Light green (long), light red (short) when in position
- **Info Panel**: Shows current trend, RSI, ADX, and volume status
## ⚠️ Important Notes
### Risk Disclaimer
- This strategy is for educational purposes only
- Past performance does not guarantee future results
- Cryptocurrency trading involves substantial risk
- Only trade with capital you can afford to lose
- Always use proper position sizing and risk management
### Limitations
- Performs poorly in sideways/choppy markets
- Requires sufficient liquidity for best execution
- Backtests do not include:
- Real-world slippage (especially during volatility)
- Funding rates (for perpetual futures)
- Exchange downtime or connection issues
- Emotional trading decisions
### For Futures Trading
If using this strategy on futures with leverage:
- Reduce position size proportionally to leverage
- Account for funding rates (~0.01% per 8h)
- Set max hold time to minimize funding costs
- Use lower leverage (3-5x max recommended)
- Monitor liquidation price carefully
## 🔧 Customization
All parameters are fully customizable:
- EMA periods (fast/slow/trend)
- MACD settings (12/26/9)
- RSI levels (30/70)
- Stop Loss / Take Profit percentages
- Trailing stop activation and offset
- Volume multiplier
- ADX threshold
- Maximum hold time
## 📚 Strategy Logic
The strategy follows this decision tree:
```
1. Check Trend Direction (EMA alignment)
↓
2. Scan for Entry Signals (8 types)
↓
3. Confirm with Filters (ADX, Volume, RSI)
↓
4. Enter Position with Fixed SL/TP
↓
5. Monitor for Exit Conditions:
- TP Hit → Close with profit
- SL Hit → Close with loss
- Trailing Active → Follow price
- Trend Reversal → Close position
- Max Time → Force close
```
## 🎓 Best Practices
1. **Start Conservative**: Use smaller position sizes initially
2. **Track Performance**: Monitor actual vs backtested results
3. **Optimize Regularly**: Market conditions change, adapt parameters
4. **Combine with Analysis**: Don't rely solely on automated signals
5. **Manage Emotions**: Stick to the system, avoid manual overrides
6. **Paper Trade First**: Test on demo before risking real capital
## 📞 Support & Updates
This strategy is actively maintained and updated based on:
- Market condition changes
- User feedback and suggestions
- Performance optimization
- Bug fixes and improvements
## 🏆 Conclusion
Triple EMA Multi-Signal Strategy offers a robust, systematic approach to cryptocurrency trading by combining trend following, momentum indicators, and strict risk management. Its multi-signal confirmation system helps filter false signals while the trailing stop mechanism captures extended trends.
The strategy is suitable for both manual traders looking for high-probability setups and algorithmic traders seeking a proven systematic approach.
**Remember**: No strategy wins 100% of the time. Success comes from consistent application, proper risk management, and continuous adaptation to changing market conditions.
---
*Version: 1.0*
*Last Updated: November 2025*
*Tested on: BTC/USDT, ETH/USDT (1H, 4H timeframes)*
*Recommended Capital: $5,000+ for optimal position sizing*

High Volume Bars (Advanced)High Volume Bars (Advanced)
High Volume Bars (Advanced) is a Pine Script v6 indicator for TradingView that highlights bars with unusually high volume, with several ways to define “unusual”:
Classic: volume > moving average + N × standard deviation
Change-based: large change in volume vs previous bar
Z-score: statistically extreme volume values
Robust mode (optional): median + MAD, less sensitive to outliers
It can:
Recolor candles when volume is high
Optionally highlight the background
Optionally plot volume bands (center ± spread × multiplier)
⸻
1. How it works
At each bar the script:
Picks the volume source:
If Use Volume Change vs Previous Bar? is off → uses raw volume
If on → uses abs(volume - volume )
Computes baseline statistics over the chosen source:
Lookback bars
Moving average (SMA or EMA)
Standard deviation
Optionally replaces mean/std with robust stats:
Center = median (50th percentile)
Spread = MAD (median absolute deviation, scaled to approx σ)
Builds bands:
upper = center + spread * multiplier
lower = max(center - spread * multiplier, 0)
Flags a bar as “high volume” if:
It passes the mode logic:
Classic abs: volume > upper
Change mode: abs(volume - volume ) > upper
Z-score mode: z-score ≥ multiplier
AND the relative filter (optional): volume > average_volume * Min Volume vs Avg
AND it is past the first Skip First N Bars from the start of the chart
Colors the bar and (optionally) the background accordingly.
⸻
2. Inputs
2.1. Statistics
Lookback (len)
Number of bars used to compute the baseline stats (mean / median, std / MAD).
Typical values: 50–200.
StdDev / Z-Score Multiplier (mult)
How far from the baseline a bar must be to count as “high volume”.
In classic mode: volume > mean + mult × std
In z-score mode: z ≥ mult
Typical values: 1.0–2.5.
Use EMA Instead of SMA? (smooth_with_ema)
Off → uses SMA (slower but smoother).
On → uses EMA (reacts faster to recent changes).
Use Robust Stats (Median & MAD)? (use_robust)
Off → mean + standard deviation
On → median + MAD (less sensitive to a few insane spikes)
Useful for assets with occasional volume blow-ups.
⸻
2.2. Detection Mode
These inputs control how “unusual” is defined.
• Use Volume Change vs Previous Bar? (mode_change)
• Off (default) → uses absolute volume.
• On → uses abs(volume - volume ).
You then detect jumps in volume rather than absolute size.
Note: This is ignored if Z-Score mode is switched on (see below).
• Use Z-Score on Volume? (Overrides change) (mode_zscore)
• Off → high volume when raw value exceeds the upper band.
• On → computes z-score = (value − center) / spread and flags a bar as high when z ≥ multiplier.
Z-score mode can be combined with robust stats for more stable thresholds.
• Min Volume vs Avg (Filter) (min_rel_mult)
An extra filter to ignore tiny-volume bars that are statistically “weird” but not meaningful.
• 0.0 → no filter (all stats-based candidates allowed).
• 1.0 → high-volume bar must also be at least equal to average volume.
• 1.5 → bar must be ≥ 1.5 × average volume.
• Skip First N Bars (from start of chart) (skip_open_bars)
Skips the first N bars of the chart when evaluating high-volume conditions.
This is mostly a safety / cosmetic option to avoid weird behavior on very early bars or backfill.
⸻
2.3. Visuals
• Show Volume Bands? (show_bands)
• If on, plots:
• Upper band (upper)
• Lower band (lower)
• Center line (vol_center)
These are plotted on the same pane as the script (usually the price chart).
• Also Highlight Background? (use_bg)
• If on, fills the background on high-volume bars with High-Vol Background.
• High-Vol Bar Transparency (0–100) (bar_transp)
Controls the opacity of the high-volume bar colors (up / down).
• 0 → fully opaque
• 100 → fully transparent (no visible effect)
• Up Color (upColor) / Down Color (dnColor)
• Regular bar colors (non high-volume) for up and down bars.
• Up High-Vol Base Color (upHighVolBase) / Down High-Vol Base Color (dnHighVolBase)
Base colors used for high-volume up/down bars. Transparency is applied on top of these via bar_transp.
• High-Vol Background (bgHighVolColor)
Background color used when Also Highlight Background? is enabled.
⸻
3. What gets colored and how
• Bar color (barcolor)
• Up bar:
• High volume → Up High-Vol Color
• Normal volume → Up Color
• Down bar:
• High volume → Down High-Vol Color
• Normal volume → Down Color
• Flat bar → neutral gray
• Background color (bgcolor)
• If Also Highlight Background? is on, high-volume bars get High-Vol Background.
• Otherwise, background is unchanged.
⸻
4. Alerts
The indicator exposes three alert conditions:
• High Volume Bar
Triggers whenever is_high is true (up or down).
• High Volume Up Bar
Triggers only when is_high is true and the bar closed up (close > open).
• High Volume Down Bar
Triggers only when is_high is true and the bar closed down (close < open).
You can use these in TradingView’s “Create Alert” dialog to:
• Get notified of potential breakout / exhaustion bars.
• Trigger webhook events for bots / custom infra.
⸻
5. Recommended presets
5.1. “Classic” high-volume detector (closest to original)
• Lookback: 150–200
• StdDev / Z-Score Multiplier: 1.0–1.5
• Use EMA Instead of SMA?: off
• Use Robust Stats?: off
• Use Volume Change vs Previous Bar?: off
• Use Z-Score on Volume?: off
• Min Volume vs Avg (Filter): 0.0–1.0
Behavior: Flags bars whose volume is notably above the recent average (plus a bit of noise filtering), same spirit as your initial implementation.
⸻
5.2. Volatility-aware (Z-score) mode
• Lookback: 100–200
• StdDev / Z-Score Multiplier: 1.5–2.0
• Use EMA Instead of SMA?: on
• Use Robust Stats?: on (if asset has huge spikes)
• Use Volume Change vs Previous Bar?: off (ignored anyway in z-score mode)
• Use Z-Score on Volume?: on
• Min Volume vs Avg (Filter): 0.5–1.0
Behavior: Flags bars that are “statistically extreme” relative to recent volume behavior, not just absolutely large. Good for assets where baseline volume drifts over time.
⸻
5.3. “Wake-up bar” (volume acceleration)
• Lookback: 50–100
• StdDev / Z-Score Multiplier: 1.0–1.5
• Use EMA Instead of SMA?: on
• Use Robust Stats?: optional
• Use Volume Change vs Previous Bar?: on
• Use Z-Score on Volume?: off
• Min Volume vs Avg (Filter): 0.5–1.0
Behavior: Emphasis on sudden increases in volume rather than absolute size – useful to catch “first active bar” after a quiet period.
⸻
6. Limitations / notes
• Time-of-day effects
The script currently treats the entire chart as one continuous “session”. On 24/7 markets (crypto) this is fine. For regular-session assets (equities, futures), volume naturally spikes at open/close; you may want to:
• Use a shorter Lookback, or
• Add a session-aware filter in a future iteration.
• Illiquid symbols
On very low-liquidity symbols, robust stats (Use Robust Stats) and a non-zero Min Volume vs Avg can help avoid “everything looks extreme” problems.
• Overlay behavior
overlay = true means:
• Bars are recolored on the price pane.
• Volume bands are also drawn on the price pane if enabled.
If you want a dedicated panel for the bands, duplicate the logic in a separate script with overlay = false.

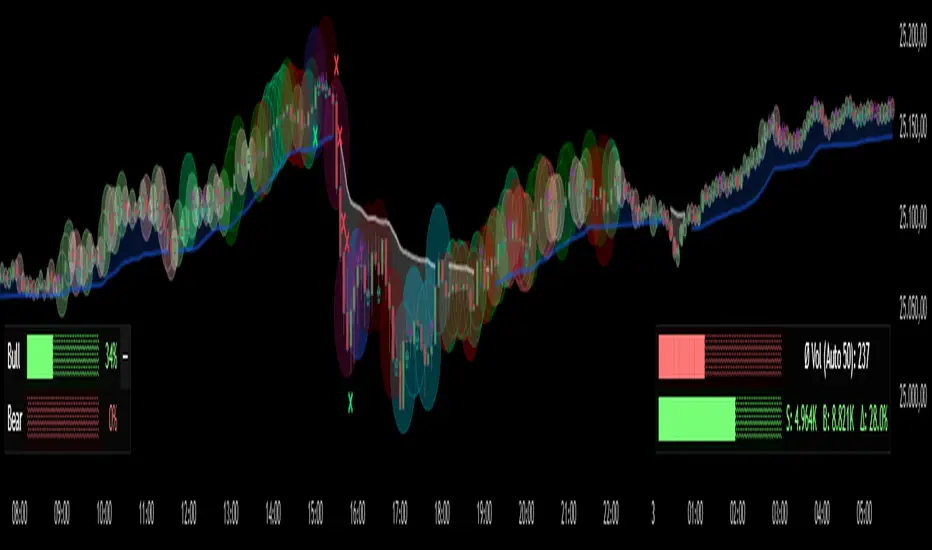
Bubbles VolumeBubbles Volume Indicator
Overview
The Bubbles Volume Indicator is an advanced volume visualization tool that transforms traditional volume analysis into an intuitive, visual experience. By representing volume as dynamically-sized bubbles directly on your price chart, this indicator helps traders quickly identify significant volume events, potential support/resistance levels, and shifts in market sentiment.
Key Features
🔵 Visual Volume Representation
Displays volume as circular bubbles at the midpoint of each candle
Bubble size scales proportionally to volume significance
Instant visual identification of unusual volume activity
Clean, uncluttered chart presentation
📊 Dual Volume Modes
Total Volume Mode: Displays complete trading volume for each bar
Volume Delta Mode: Shows the difference between buying and selling pressure, helping identify market direction and strength
🎨 Advanced Coloring Systems
Simple Mode: Clear green/red coloring for buy/sell pressure
HeatMap Mode: Gradient coloring that intensifies with volume strength, providing instant visual feedback on volume intensity
📍 Significant Level Detection
Automatically identifies and marks price levels with exceptional volume
These levels often act as future support or resistance zones
Historical volume levels remain visible for reference
How to Use
For Day Traders
Identify volume climaxes that may signal reversals
Spot accumulation/distribution patterns through Volume Delta
Confirm breakouts with significant volume bubbles
For Swing Traders
Mark important support/resistance levels based on historical high-volume areas
Identify institutional activity through unusual volume patterns
Validate trend strength using volume confirmation
For Scalpers
Quick visual identification of liquidity pockets
Real-time volume delta for order flow analysis
Filter out low-volume noise with minimum contract settings
Parameter Settings
Volume Settings
Volume Type
Total Volume: Shows all traded volume for each bar - ideal for general volume analysis
Volume Delta: Displays the difference between buying and selling pressure - perfect for order flow analysis
Minimum Contracts
Filters out bubbles below a specified volume threshold
Set to 0 to disable filtering
Helps remove noise during low-volume periods
For Volume Delta: Filters based on absolute delta value
Bubble Display
Show Bubbles
Toggle the visibility of volume bubbles on/off
Bubbles appear at the middle price point (HL2) of each bar
Threshold
Statistical threshold measured in standard deviations
Controls sensitivity of volume significance detection:
1.0 = Shows top ~32% of volumes (more bubbles, common events)
2.0 = Shows top ~5% of volumes (significant events)
3.0 = Shows top ~0.3% of volumes (rare, extreme events)
Higher values display only the most significant volume spikes
HeatMap
OFF: Simple coloring scheme (green for buying, red for selling in Delta mode)
ON: Gradient coloring that intensifies with volume strength
Provides additional visual dimension to volume analysis
Volume Levels
Significant Levels
Draws horizontal lines at price levels where extreme volume occurred
Volume must exceed 3x the threshold setting to qualify
These levels often become important support/resistance zones
Levels Qty
Maximum number of significant volume level lines to display
Older lines are automatically removed when limit is exceeded
Keeps chart clean while maintaining relevant historical levels
Visual Indicators
Bubble Sizes (in order of significance)
Tiny: Minimal volume above baseline
Small: Low significant volume
Normal: Moderate volume activity
Medium: Above-average volume
Large: High volume activity
Huge: Exceptional volume
Labeled: Extreme volume with numeric display
Color Coding
Green: Buying pressure (in Volume Delta mode) or rising prices
Red: Selling pressure (in Volume Delta mode) or falling prices
Gradient Intensity: Stronger colors indicate higher relative volume
Information Display
The indicator includes a real-time information table showing:
Current operating mode (Total Volume or Volume Delta)
Live delta values with directional arrows (in Volume Delta mode)
Active minimum contracts filter setting
Best Practices
Start with default settings to familiarize yourself with the indicator
Adjust threshold based on your trading timeframe (lower for scalping, higher for position trading)
Use Volume Delta mode when analyzing order flow and market sentiment
Enable Significant Levels for swing trading to identify key support/resistance
Apply Minimum Contracts filter to reduce noise in low-volume markets
Technical Notes
The indicator requires volume data to function (not available on all symbols)
Volume Delta calculations use intrabar data for enhanced accuracy
Historical significant levels are preserved for technical analysis
Optimized for both light and dark chart themes
Trading Applications
Breakout Confirmation: Large bubbles during breakouts confirm strength
Reversal Detection: Extreme volume at tops/bottoms may signal reversals
Trend Analysis: Increasing bubble sizes confirm trend strength
Support/Resistance: High-volume levels often become future pivots
Order Flow: Volume Delta reveals real-time buying/selling pressure
GC-Volume Spike (골드크로스 볼륨스파이크) . V2RSI + Volume + GoldenCross + OBV + Inst + Heart
업데이트 기능추가
7일선에 봉위치에따른 색상추가
상승 하락시그널에따른 색상 다변화
시각화 기반사항 개선 등
Updated features:
Added colors based on candlestick positions to the 7-day moving average.
Diversified colors for rising and falling signals.
Improved visualization.

HTF Order Blocks [TradeWithRon]HTF Order Blocks is a clean, multi-timeframe order-flow tool that maps bullish/bearish order blocks and optional breaker blocks from higher timeframes onto your current chart. It’s built for clarity and speed: minimal clutter, configurable labels, and optional Fibonacci extensions for quick projection work.
What it does
Identifies Order Blocks (OBs) using swing structure (configurable lookback).
Marks Breaker Blocks when an OB is breached and market structure flips.
Projects HTF zones from up to two higher timeframes (HTF1 & HTF2), with separate color themes.
Clean visuals: open lines, and smart label placement.
Optional Fibonacci extensions from each OB for quick confluence checks.
Alert-ready: receive alerts on creation of Bullish/Bearish OBs and Breakers.
Key Features
Multi-Timeframe Mapping
Enable HTF1 and/or HTF2 and project their OBs on your active chart.
Uses request.security() with lookahead_off to avoid future-bar leakage.
Fibonacci Add-On (optional)
How it works (logic overview)
Swing detection: Finds recent pivots using a lookback window.
OB creation:
Bullish OB: Created after price closes above a prior swing high, then scans the upswing for the most meaningful base candle range (high/low/open/close).
Bearish OB: Created after price closes below a prior swing low, with symmetric logic.
Breaker state:
A bullish OB turns breaker if price later closes below its base;
A bearish OB turns breaker if price closes above its base.
Cleanup: Breakers are removed if price subsequently recovers past the opposing OB boundary.
HTF OBs are detected on their native timeframe and projected to the active chart; confirmation occurs on the HTF bar’s close.
Volume-Confirmed Reversal Engine [AlgoPoint]Volume-Confirmed Reversal Engine v2.0
Overview
A price pattern alone is not enough to signal a high-probability reversal. True market turning points—moments of capitulation or euphoria—are almost always confirmed by a significant spike in volume.
The Volume-Confirmed Reversal Engine is designed to identify these exact moments. It filters out low-conviction price movements and focuses only on reversal patterns that are backed by meaningful volume activity.
How It Works
The indicator's logic is based on a sequential confirmation process:
- High-Volume Anchor Candle: The engine first scans for an "Anchor Candle"—a candle that makes a new high or low over a user-defined look_back period. Critically, this candle's volume must also be significantly higher than the recent average. Low-volume breakouts are ignored.
- Setup Activation & Visualization: When a valid Anchor Candle is detected, the indicator enters a "setup" phase. It visually marks this on your chart by drawing a Setup Box around the high and low of the Anchor Candle, extending it forward for the duration of the confirm_in window.
- Confirmation & Signal: A final signal is only triggered if the price breaks out of the opposite side of the Setup Box within the confirmation window. This action, combined with the initial volume spike, confirms the reversal.
- Setup Box Visualization: See exactly which candle the indicator is watching and the key price levels (the box boundaries) that need to be broken for a signal.
Signal Strength Score (1-4): Every signal now comes with a score, providing insight into its quality based on four factors:
- The base price pattern is met.
- The initial Anchor Candle had high volume.
- The final Confirmation Candle also had high volume.
- The signal is aligned with the long-term macro trend (e.g., a BUY signal above the 200 EMA).
Status Dashboard: A simple panel on your chart tells you what the indicator is doing in real-time ("Scanning for Setups," "Watching Bullish Setup," etc.) and displays a countdown for how many bars are left for a confirmation.
How to Interpret & Use
- The Box: When a colored box appears, it's an early warning that a reversal setup is active. Watch the boundaries of the box for a potential breakout.
- The Score: Use the score to gauge the quality of a signal. A 3/4 or 4/4 score represents a very high-conviction setup where multiple technical factors are aligned.
- The Dashboard: Use the panel to understand the indicator's current state and the time-sensitivity of an active setup.
- The BUY/SELL Labels: These are the final, actionable triggers, appearing only after the full price and volume confirmation process is complete.

Project Pegasus ChronosDescription
Project Pegasus Chronos is the flagship volume-intelligence overlay of the Pegasus suite, built for traders who read the tape. It spots where the tape gets hit, where moves get absorbed, and when pressure flips — in real time, without repainting. Chronos blends high-signal volume spikes, absorption, pure-delta mismatches, and two crisp market-pressure HUDs into one surgical visualization that stays readable even on noisy charts.
What’s unique
Layered volume intelligence that cuts through noise: spikes, absorption, delta traps, trend bias, and pressure — at a glance.
Absorption Engine – Proprietary scoring of wick/body/delta context to flag “hit & hold” moments where moves stall.
Pure-Delta Mismatch Bubbles – Instantly reveal fake strength or weakness when the candle fights the tape.
Mirage Filters (Add-on) – Smart VolSpike & PriceClamp regime tags (squeeze vs. burst) for clean entries and exits.
Pegasus TrendDynamic – Adaptive bias band with one-look flips and optional shadow fill for context.
Dual HUDs – Buy/Sell Volume HUD and Market Pressure HUD with a Shock badge for sudden impulses.
Readable by Design – Color presets, clustering, absolute filters, and performance scopes (12/24/48/72H) keep charts fast & clean.
Non-repainting – Signals are produced only on confirmed bars; no lookahead.
How it works
Chronos aggregates recent market behavior into simple, decisive visuals:
Bubbles scale by spike tier and direction to highlight initiative participation.
Absorption marks flag bars where flow hits and fails to push through.
Pure-delta markers expose liquidity traps (delta vs. candle color).
TrendDynamic provides a smooth, adaptive bias rail.
HUDs quantify who’s pressing harder and when a shock event fires.
How to use
Stalk large bubbles near key levels; pair them with absorption marks to time fades or continuations.
Treat pure-delta mismatches as early trap signals — especially near session highs/lows or FVGs.
Trade in alignment with the TrendDynamic bias; use Market Pressure HUD & Shock to time adds or cuts.
Refine visuals via clustering and absolute-volume filters on fast instruments.
Notes & limitations
Built for intraday futures, crypto, and FX — but works across assets and timeframes.
If visuals get heavy, use scope, clustering, and filters to keep it buttery smooth.
Analysis and visualization tool — not a signal service.
Disclaimer
For educational and informational purposes only. Not financial advice.
Volume Stress Level V2Volume Stress Level V2, is designed to provide a nuanced view of "RECENT" trading volume by identifying different levels of volume stress relative to a smoothed average.
Key Features:
Dynamic Volume Stress Calculation: The indicator calculates volume stress based on a Simple Moving Average (SMA) of volume and its standard deviation. The length of the SMA and the multiplier for the standard deviation are fully customizable, allowing you to adapt the indicator to different market conditions and trading styles.
Visual Volume Zones: The script visually categorizes volume into distinct zones:
Low Volume Zone: Represented by a white background, indicating periods of lower-than-average trading activity.
Normal Volume Zone: Highlighted in blue, signifying typical trading volume.
Medium Volume Zone: Displayed in yellow, denoting a moderate increase in volume.
High Volume Zone: Shown in orange, indicating significant volume spikes.
Spike Volume Zone: Marked in black, representing extreme volume events.
Customizable Background: You have the option to enable or disable the colored background fill for these volume zones, providing flexibility in how you visualize the data.
Bar Coloring: The volume bars themselves are color-coded according to the identified volume stress level, offering an immediate visual cue on your chart.
Adjustable Parameters:
VSL Length: Controls the lookback period for the SMA and standard deviation calculations.
Multiplier: Adjusts the sensitivity of the standard deviation bands, thereby influencing the width of the volume zones.
How to Use:
This indicator can be valuable for identifying potential shifts in market sentiment, confirming breakouts, or spotting periods of accumulation and distribution. By observing the transitions between volume zones, traders can gain insights into the conviction behind price movements.
Volume Spikes + Daily VWAP SD BandsVolume Spikes + Daily VWAP SD Bands
This indicator combines volume spike detection to help traders identify potential absorption zones with daily VWAP and standard deviation bands , key price levels, continuation opportunities, and possible institutional bias.
Features:
Volume Spike Detection
Highlights candles with unusually high volume relative to a configurable SMA.
Optional filters:
Local highs/lows only (Only Use Valid Highs & Lows)
Candle shapes: Hammer / Shooter only
Candle color match: bullish spikes on green, bearish on red
Plots small circles above/below bars for bullish and bearish volume spikes.
Alerts available for both bullish and bearish spikes.
Interpretation: Volume spikes at local highs/lows can indicate absorption, where one side absorbs aggressive buying/selling pressure.
Daily VWAP
Calculates volume-weighted average price (VWAP) for the current day.
Optionally shows previous day’s VWAP for reference.
Plot lines are customizable with optional circles on lines for visual clarity.
Labels on the last bar show exact VWAP values.
Institutional Bias Insight: Price above both current and previous VWAPs may indicate bullish positioning; price below both VWAPs may indicate bearish positioning. Many professional traders consider this a clue to institutional bias, but it’s not guaranteed. Always confirm with volume, delta, or orderflow analysis.
Standard Deviation Bands
Optional x1 and x2 SD bands around the daily VWAP.
Visual fill between bands shows price volatility zones.
Can be used to identify potential support/resistance or absorption zones.
Use Case: Price bounces off first SD band may indicate continuation signals, especially when volume spikes occur at those levels.
Customizable Visuals
Colors for bullish and bearish volume spikes
VWAP and SD band colors and thickness
Optional circles and filled bands for better readability
Alerts
Bullish / Bearish Volume Spikes
Supports TradingView alert system for automated notifications
Advanced Use Cases:
Combine with Cumulative Delta or Orderflow tools to confirm true absorption zones.
Identify high-volume rejection candles signaling possible trend continuation.
Use VWAP positioning relative to price to assess potential institutional bias, keeping in mind it is probabilistic, not guaranteed.
Visualize intraday VWAP levels and volatility with SD bands for better trade timing.
Settings: Fully customizable, including volume multiplier, SMA length, session filter, candle shape, color options, and VWAP/SD display preferences.

Smarter Money Concepts - Wyckoff Springs & Upthrusts [PhenLabs]📊Smarter Money Concepts - Wyckoff Springs & Upthrusts
Version: PineScript™v6
📌Description
Discover institutional manipulation in real-time with this advanced Wyckoff indicator that detects Springs (accumulation phases) and Upthrusts (distribution phases). It identifies when price tests support or resistance on high volume, followed by a strong recovery, signaling potential reversals where smart money accumulates or distributes positions. This tool solves the common problem of missing these subtle phase transitions, helping traders anticipate trend changes and avoid traps in volatile markets.
By combining volume spike detection, ATR-normalized recovery strength, and a sigmoid probability model, it filters out weak signals and highlights only high-confidence setups. Whether you’re swing trading or day trading, this indicator provides clear visual cues to align with institutional flows, improving entry timing and risk management.
🚀Points of Innovation
Sigmoid-based probability threshold for signal filtering, ensuring only statistically significant Wyckoff patterns trigger alerts
ATR-normalized recovery measurement that adapts to market volatility, unlike static recovery checks in traditional indicators
Customizable volume spike multiplier to distinguish institutional volume from retail noise
Integrated dashboard legend with position and size options for personalized chart visualization
Hidden probability plots for advanced users to analyze underlying math without chart clutter
🔧Core Components
Support/Resistance Calculator: Scans a user-defined lookback period to establish dynamic levels for Spring and Upthrust detection
Volume Spike Detector: Compares current volume to a 10-period SMA, multiplied by a configurable factor to identify significant surges
Recovery Strength Analyzer: Uses ATR to measure price recovery after breaks, normalizing for different market conditions
Probability Model: Applies sigmoid function to combine volume and recovery data, generating a confidence score for each potential signal
🔥Key Features
Spring Detection: Spots accumulation when price dips below support but recovers strongly, helping traders enter longs at potential bottoms
Upthrust Detection: Identifies distribution when price spikes above resistance but falls back, alerting to possible short opportunities at tops
Customizable Inputs: Adjust lookback, volume multiplier, ATR period, and probability threshold to match your trading style and market
Visual Signals: Clear + (green) and - (red) labels on charts for instant recognition of accumulation and distribution phases
Alert System: Triggers notifications for signals and probability thresholds, keeping you informed without constant monitoring
🎨Visualization
Spring Signal: Green upward label (+) below the bar, indicating strong recovery after support break for accumulation
Upthrust Signal: Red downward label (-) above the bar, showing failed breakout above resistance for distribution
Dashboard Legend: Customizable table explaining signals, positioned anywhere on the chart for quick reference
📖Usage Guidelines
Core Settings
Support/Resistance Lookback
Default: 20
Range: 5-50
Description: Sets bars back for S/R levels; lower for recent sensitivity, higher for stable long-term zones – ideal for spotting Wyckoff phases
Volume Spike Multiplier
Default: 1.5
Range: 1.0-3.0
Description: Multiplies 10-period volume SMA; higher values filter to significant spikes, confirming institutional involvement in patterns
ATR for Recovery Measurement
Default: 5
Range: 2-20
Description: ATR period for recovery strength; shorter for volatile markets, longer for smoother analysis of post-break recoveries
Phase Transition Probability Threshold
Default: 0.9
Range: 0.5-0.99
Description: Minimum sigmoid probability for signals; higher for strict filtering, ensuring only high-confidence Wyckoff setups
Display Settings
Dashboard Position
Default: Top Right
Range: Various positions
Description: Places legend table on chart; choose based on layout to avoid overlapping price action
Dashboard Text Size
Default: Normal
Range: Auto to Huge
Description: Adjusts legend text; larger for visibility, smaller for minimal space use
✅Best Use Cases
Swing Trading: Identify Springs for long entries in downtrends turning to accumulation
Day Trading: Catch Upthrusts for short scalps during intraday distribution at resistance
Trend Reversal Confirmation: Use in conjunction with other indicators to validate phase shifts in ranging markets
Volatility Plays: Spot signals in high-volume environments like news events for quick reversals
⚠️Limitations
May produce false signals in low-volume or sideways markets where volume spikes are unreliable
Depends on historical data, so performance varies in unprecedented market conditions or gaps
Probability model is statistical, not predictive, and cannot account for external factors like news
💡What Makes This Unique
Probability-Driven Filtering: Sigmoid model combines multiple factors for superior signal quality over basic Wyckoff detectors
Adaptive Recovery: ATR normalization ensures reliability across assets and timeframes, unlike fixed-threshold tools
User-Centric Design: Tooltips, customizable dashboard, and alerts make it accessible yet powerful for all trader levels
🔬How It Works
Calculate S/R Levels:
Uses the highest high and the lowest low over the lookback period to set dynamic zones
Establishes baseline for detecting breaks in Wyckoff patterns
Detect Breaks and Recovery:
Checks for price breaking support/resistance, then recovering on volume
Measures recovery strength via ATR for volatility adjustment
Apply Probability Model:
Combines volume spike and recovery into a sigmoid function for confidence score
Triggers signal only if above threshold, plotting visuals and alerts
💡Note:
For optimal results, combine with price action analysis and test settings on historical charts. Remember, Wyckoff patterns are most effective in trending markets – use lower probability thresholds for practice, then increase for live trading to focus on high-quality setups.

Buy & Sell Volume (OWI)📊 Buy & Sell Volume (OWI) Indicator Guide
The Buy & Sell Volume (OWI) indicator is designed to provide a visual breakdown of buying and selling pressure in each candle, helping traders identify volume surges and potential market moves. It also includes a time filter to focus analysis during key trading hours.
⚙️ Setup & Inputs
When adding the indicator to your chart, you'll see several configurable inputs:
SMA Length : Sets the period for the Simple Moving Average (SMA) of total volume.
Enable Time Filter : Toggles whether to restrict analysis to US market hours (Eastern Time). |
Start Hour/Minute : Defines the beginning of the time filter window (default: 9:45 ET). |
End Hour/Minute : Defines the end of the time filter window (default: 16:15 ET). |
📈 How It Works
🔍 Volume Breakdown
Buy Volume: Estimated volume attributed to buyers, calculated based on candle position.
Sell Volume: Estimated volume attributed to sellers.
Total Volume SMA: A moving average of total volume to benchmark current activity.
⏰ Time Filter (Optional)
When enabled, the indicator only highlights volume spikes during the specified US market hours. This helps filter out noise from pre-market or after-hours trading.
🚨 Highlight Conditions
The indicator flags significant volume spikes with labels above the volume bars:
| Label | Condition |
| V+ | Volume is between 1.5× and 2× the SMA, during market hours (if enabled). |
| V++ | Volume exceeds 2× the SMA, during market hours (if enabled). |
💡 Tips
- Use shorter SMA lengths for more reactive volume analysis.
- Change the time filter if you're trading outside US market hours.
- Combine with candlestick patttern to confirm breakout or reversal signals.
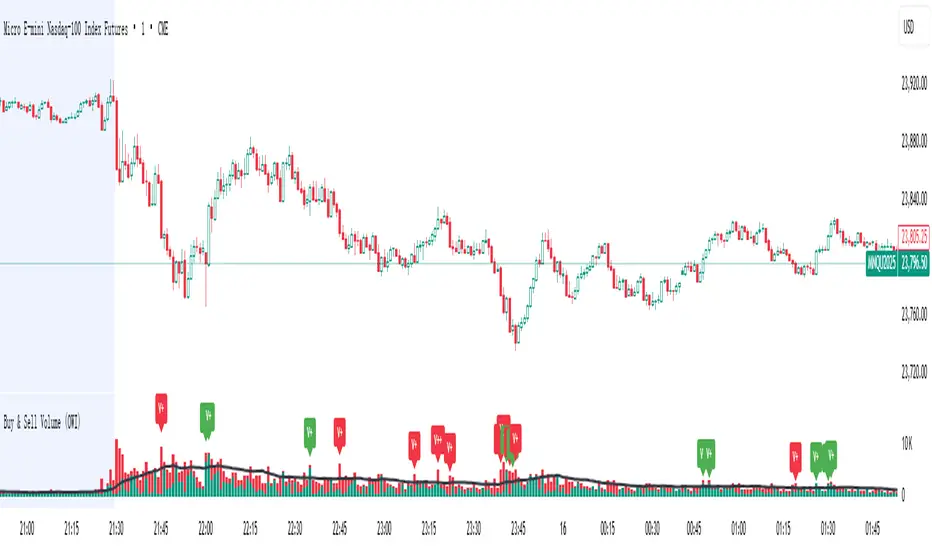
Up On Volume Screener [LevelUp]The Up On Volume Screener is a powerful scanner designed to identify stocks exhibiting strong bullish momentum, characterized by a higher close on the day or week accompanied by a significant spike in trading volume compared to the average. This screener allows traders to customize parameters such as moving average lengths, closing range requirements, and proximity to 52-week highs using multiples of the ATR (average true range).
By pinpointing stocks with robust buying pressure and high volume, the Up On Volume screener helps traders uncover potential breakout opportunities, early trend leaders, and stocks demonstrating relative strength, making it an essential tool for momentum, swing, and growth trading strategies.
🔹 Why Search For Up On Volume?
▪ Confirmation of Bullish Momentum: Stocks that close higher on the day/week signal buying pressure and bullish sentiment throughout the session. This helps traders and investors identify names that are attracting demand, possibly due to news, earnings, or sector strength.
▪ Volume Adds Conviction: When a stock closes up with increased volume, it suggests strong participation behind the move — not just a “head fake” or a thinly traded rally. High volume confirms that institutional players or multiple market participants are involved, which often leads to more reliable price trends.
▪ Early Stage Moves: Daily breakouts can often mark the beginning of a larger trend. Catching stocks on days they close up helps pinpoint emerging leaders and stocks transitioning from accumulation to bullish phases.
▪ Technical Strength: A bullish close (especially in the top half of the day’s price range) is a technical sign of demand. This is a favored criterion in many technical analysis strategies for swing trading, momentum trading, and even fundamental breakouts.
🔹 When Is Up On Volume Screen Most Helpful?
▪ After Market Close: Stocks that show strength and close up on high volume often show continued follow-through in the coming days/weeks.
▪ After Major News/Events: When stocks respond positively to news releases, earnings, or sector movements, searching for those that close up can help you catch momentum before it’s widely recognized.
▪ Trend Days: On days when the market is trending (not sideways or choppy), screening for stocks closing up helps you align with the strongest moves and avoid false signals.
▪ Early in Bullish Cycles: Searching for stocks closing up during the early stage of a market rally or sector rotation can help growth traders get in ahead of sustained upward moves.a
▪ Relative Strength Signals True Leadership: When most stocks decline in a weak market, those that hold firm or rise are showing clear relative strength. This means buyers are stepping in even when the broader mood is negative, often signaling institutional accumulation — these are the names likely to become tomorrow’s winners.
▪ Early Clues to New Cycles: Throughout history, the biggest winners in bull markets often began their runs during corrections and bear phases, not after the headlines turn positive. By focusing on stocks that close green on red days, you’re hunting for companies quietly building buying pressure, poised to break out when the tide turns.
▪ Faster Recoveries and Outperformance: Stocks that resist declines tend to rebound earlier and outpace the broader market once conditions improve. These resilient names frequently end up delivering outsized returns, often leading sector rallies or driving new market themes.
🔹 Screening Features - Setting Your Search Criteria
There are various search options that can be customized.
✓ Volume Gap Up %: Minimum volume percent change over the average volume.
✓ Moving Average: Set length for average volume calculations on daily and weekly timeframes.
✓ Closing Range %: Specify the preferred closing range on the day or week.
✓ Price With X ATR of 52-Week High: Filter for stocks within X ATRs of their 52-week highs.
🔹 Installation And Usage
▪ Mark this indicator as a Favorite.
▪ Use the Pine Screener to search for stocks.
▪ Save the search results to a watchlist.
▪ View the watchlist in TradingView.
🔹 Note
Some high-volume breakout scans rely on proprietary formulas. With this screener, every filter can be researched and verified - no black box! The only variables are price, volume % change, closing range and price within a specified ATR of the 52-week high.

Institutional HeatmapHeatmap Range - Volume Profile Visualization Indicator
What This Indicator Does
The Heatmap Range indicator provides a sophisticated volume profile visualization that displays price levels with the highest trading activity using color-coded heatmaps directly on your chart. Unlike traditional volume indicators, this tool shows WHERE the most significant trading occurred within specific price ranges over a customizable lookback period.
Advanced Volume Analysis
Volume-Weighted Price Levels: Calculates and displays up to 20 price levels based on actual trading volume
Customizable Time Period: Analyze volume distribution over 10-500 bars (default: 180 bars)
Smart Bin Sizing: Adjustable pip range (0.1-50 pips) for precise level identification
Peak Detection: Automatically identifies and centers display around highest volume areas
Visual Customization
3 Color Patterns:
Inverted Heat (Orange to Dark Red)
Inverted Cool (Orange to Dark Blue)
Inverted Purple (Light Pink to Dark Purple)
Transparency Control: 0-95% transparency for optimal chart readability
Adaptive Display: Shows most relevant levels centered around peak volume
Multi-Asset Support
Forex Pairs (EUR/USD, GBP/USD, etc.)
Precious Metals (Gold/XAUUSD, Silver/XAGUSD)
Futures (NQ, ES, YM, etc.)
Cryptocurrencies
Stock Indices
Customizable Parameters
Histogram Period (10-500, Default: 180) Bars to analyze for volume distribution
Bin Range (0.1-50 pips, Default: 5.0) Price range for each volume level
Color Pattern (1-3, Default: 1) Visual color scheme selection
Average Volume Period (10-200, Default: 100) Period for volume normalization
Max Display Levels (5-20, Default: 20) Maximum price levels to show
Transparency (0-95%, Default: 50%) Opacity of heatmap display
How to Use
For Day Traders
Identify key support/resistance levels based on actual volume
Spot high-probability reversal zones
Plan entries/exits around significant volume levels
For Swing Traders
Analyze longer-term volume distribution patterns
Identify major accumulation/distribution zones
Confirm breakout levels with volume validation
For Scalpers
Quick identification of intraday volume hotspots
Real-time volume level updates
Precise entry/exit timing around volume clusters
Visual Interpretation
Darker Colors: Higher volume concentration (stronger levels)
Lighter Colors: Lower volume concentration
Color Intensity: Directly correlates to volume strength at that price level
Level Positioning: Automatically centers around peak volume areas
Technical Specifications
Pine Script Version: v5
Chart Overlay: Yes
Max Bars Back: 1000
Performance Optimized: Limited to 200 bins for smooth operation
Real-time Updates: Dynamic calculation on each bar close
Getting Started
Add to Chart: Apply indicator to any supported timeframe
Adjust Period: Set histogram period based on your trading style
Choose Colors: Select color pattern that suits your chart theme
Fine-tune Levels: Adjust bin range and max levels for optimal display
Set Transparency: Balance visibility with chart clarity
Important Notes
Minimum Data Requirement: Needs at least 10 bars of history to function
Performance: Higher periods and smaller bin ranges require more processing
Volume Dependency: Most effective on instruments with consistent volume data
Timeframe Agnostic: Works on all timeframes from 1-minute to monthly
Status Information
The indicator includes a real-time information table showing:
Current settings (Period, Bin Range, Color Pattern, Transparency)
Indicator status (Active/Loading)
Disclaimer: This indicator is for educational and informational purposes only. Past performance does not guarantee future results. Always conduct your own analysis and risk management before making trading decisions.
Compatible with TradingView's Pine Script v5 | Optimized for all market conditions | Professional-grade volume analysis
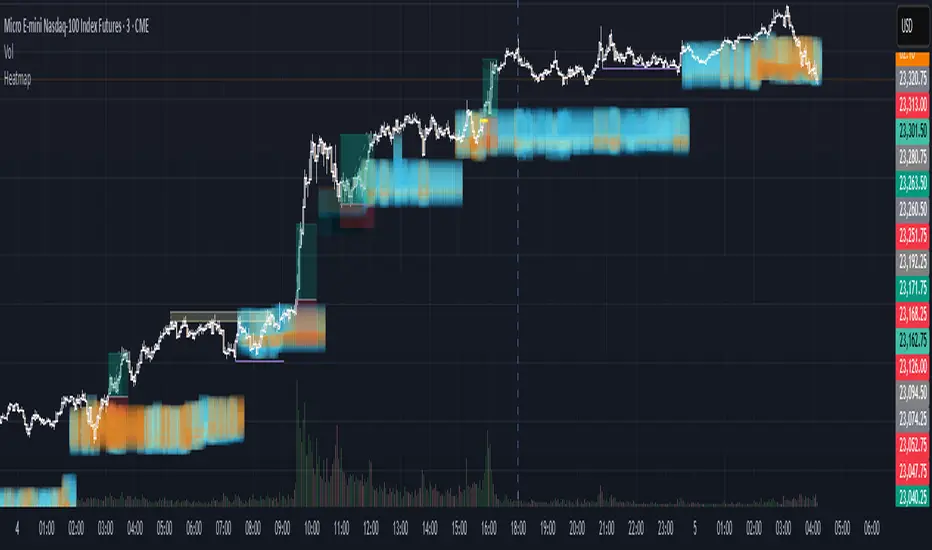
Heikin Ashi VolumeHeikin Ashi candles decrease market noise so that broader trends can be more easily visualized. In a typical chart utilizing Heikin Ashi candles, volume bars are colored in such a way that they also allow for the visualization of trends during a bullish/bearish move.
The Heikin Ashi Volume indicator allows the trader to continue to use the same volume bar coloring technique to visualize trends without having to utilize the Heikin Ashi candles, since a Heikin Ashi candle’s OHLC values are not true prices but instead based on calculations in order to provide the ‘denoising’ effect they are known for.
In addition to providing the Heikin Ashi Volume coloring effects, the Heikin Ashi Volume indicator also allows the user to set a volume threshold level where the bar colors will be darker unless volume is beyond that threshold, helping traders quickly determine if there is enough participation in the market at that time to justify taking risk in a trade when the market isn’t very active. The user has the option to show or hide the threshold line, change the colors of the bullish/bearish colors (for both above and below threshold volumes) and the option for the indicator to gradually brighten the bar colors are they approach the threshold instead of having a clear line of demarcation showing volume above or below the set threshold.

Volume Peak LineA fully configurable “Volume Peak Line” indicator that draws a horizontal threshold at the highest volume over the last X candles (default 5).
Custom lookback (X volume candles)
Optional alert when current volume exceeds that peak
Separate up/down volume bars (green/red) or hide them to use your own volume overlays
Use it to spot surges in trading activity on any timeframe—ideal for intraday or swing setups where a barn-burner volume bar can signal a reversal or the start of a new trend.
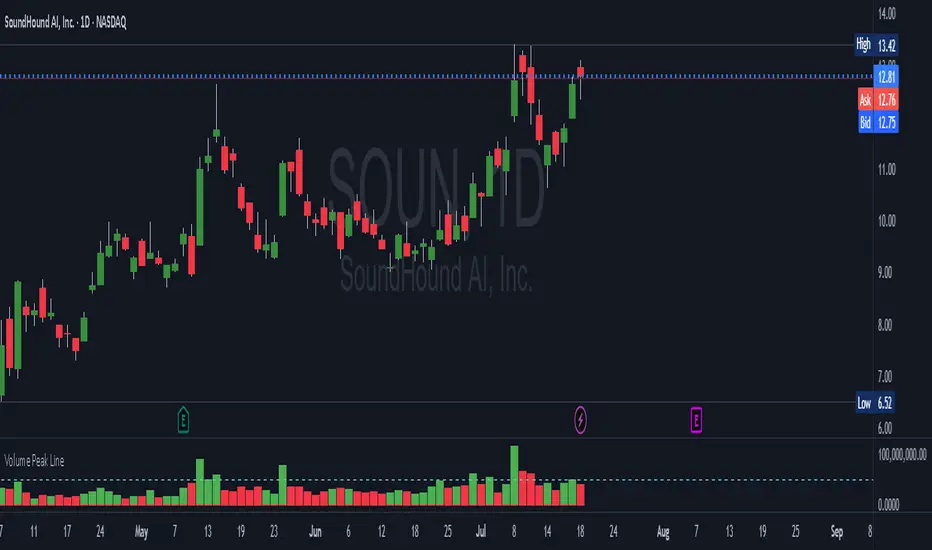
TRAPPER Volume Trigger + SMAs + Buy/Sell SplitThe TRAPPER TRIGGER is a precision-based volume spike indicator designed for intraday traders, scalpers, and swing traders who rely on key volume activity to anticipate sharp market movements. It operates on volume delta logic, detecting disproportionate buying or selling activity that signifies potential market reversals or breakouts.
How It Works:
Volume Spike Logic (Delta-Based)
The script calculates a dynamic volume threshold using a moving average of historical volume data.
It identifies a delta spike by comparing current volume against this threshold—when volume exceeds it significantly, it suggests abnormal activity.
If the candle closes higher than it opens (bullish), the script registers it as a Buy Spike ⚖️.
If the candle closes lower than it opens (bearish), it marks a Sell Spike 🏁.
These are not based on the candle’s body size but the volume differential (delta) between buy/sell pressure inferred from candle direction.
Trigger Labels
Only the most recent buy/sell spike is labeled for clarity, avoiding clutter.
Labels are color-coded to match the candle body (e.g., bright green for bullish, magenta for bearish).
Label style: ⚖️ for Buy Spikes, 🏁 for Sell Spikes.
SMA Suite (Fully Customizable):
Six SMAs: 5 (yellow), 10 (blue), 20 (green), 50 (orange), 100 (red), 200 (white).
Each can be toggled and customized in the script settings for visibility and styling.
Key Benefits
Clean, minimalistic charting — focuses only on high-probability events.
Provides delta-driven insights without requiring access to full L2 order book data.
Works across any timeframe — logic recalculates and resets zones per timeframe switch.
Designed for sniper-style entries—ideal for traders who prefer minimal noise and maximum signal clarity.
Easily extendable with SR zones, AVWAP, liquidity levels, or alerts if desired in future updates.
Who It’s For
Scalpers and intraday traders looking for clean triggers.
Swing traders wanting confirmation of institutional moves.
Volume profile enthusiasts who need a trigger alert system.
Developers who want a base volume framework to build more advanced tools on.
Disclaimer
This script is provided as-is and is intended for educational and informational purposes only. It does not constitute financial advice, investment recommendations, or a solicitation to buy or sell any security or asset.
All trading involves risk. Users should perform their own due diligence and consult with a qualified financial advisor before making any trading decisions. The author of this script assumes no liability for any losses or damages arising from the use or reliance on this tool.
By using this script, you acknowledge and agree that you are solely responsible for your own trading decisions and outcomes.
Smarter Money Flow Divergence Detector [PhenLabs]📊 Smarter Money Flow Divergence Detector
Version: PineScript™ v6
📌 Description
SMFD was developed to help give you guys a better ability to “read” what is going on behind the scenes without directly having access to that level of data. SMFD is an enhanced divergence detection indicator that identifies money flow patterns from advanced volume analysis and price action correspondence. The detection portion of this indicator combines intelligent money flow calculations with multi timeframe volume analysis to help you see hidden accumulation and distribution phases before major price movements occur.
The indicator measures institutional trading activity by looking at volume surges, price volume dynamics, and the factors of momentum to construct an overall picture of market sentiment. It’s built to assist traders in identifying high probability entries by identifying if smart money is positioning against price action.
🚀 Points of Innovation
● Advanced Smart Money Flow algorithm with volume spike detection and large trade weighting
● Multi timeframe volume analysis for enhanced institutional activity detection
● Dynamic overbought/oversold zones that adapt to current market conditions
● Enhanced divergence detection with pivot confirmation and strength validation
● Color themes with customizable visual styling options
● Real time institutional bias tracking through accumulation/distribution analysis
🔧 Core Components
● Smart Money Flow Calculation: Combines price momentum, volume expansion, and VWAP analysis
● Institutional Bias Oscillator: Tracks accumulation/distribution patterns with volume pressure analysis
● Enhanced Divergence Engine: Detects bullish/bearish divergences with multiple confirmation factors
● Dynamic Zone Detection: Automatically adjusts overbought/oversold levels based on market volatility
● Volume Pressure Analysis: Measures buying vs selling pressure over configurable periods
● Multi factor Signal System: Generates entries with trend alignment and strength validation
🔥 Key Features
● Smart Money Flow Period: Configurable calculation period for institutional activity detection
● Volume Spike Threshold: Adjustable multiplier for detecting unusual institutional volume
● Large Trade Weight: Emphasis factor for high volume periods in flow calculations
● Pivot Detection: Customizable lookback period for accurate divergence identification
● Signal Sensitivity: Three tier system (Conservative/Medium/Aggressive) for signal generation
● Themes: Four color schemes optimized for different chart backgrounds
🎨 Visualization
● Main Oscillator: Line, Area, or Histogram display styles with dynamic color coding
● Institutional Bias Line: Real time tracking of accumulation/distribution phases
● Dynamic Zones: Adaptive overbought/oversold boundaries with gradient fills
● Divergence Lines: Automatic drawing of bullish/bearish divergence connections
● Entry Signals: Clear BUY/SELL labels with signal strength indicators
● Information Panel: Real time statistics and status updates in customizable positions
📖 Usage Guidelines
Algorithm Settings
● Smart Money Flow Period
○ Default: 20
○ Range: 5-100
○ Description: Controls the calculation period for institutional flow analysis.
Higher values provide smoother signals but reduce responsiveness to recent activity
● Volume Spike Threshold
○ Default: 1.8
○ Range: 1.0-5.0
○ Description: Multiplier for detecting unusual volume activity indicating institutional participation. Higher values require more extreme volume for detection
● Large Trade Weight
○ Default: 2.5
○ Range: 1.5-5.0
○ Description: Weight applied to high volume periods in smart money calculations. Increases emphasis on institutional sized transactions
Divergence Detection
● Pivot Detection Period
○ Default: 12
○ Range: 5-50
○ Description: Bars to analyze for pivot high/low identification.
Affects divergence accuracy and signal frequency
● Minimum Divergence Strength
○ Default: 0.25
○ Range: 0.1-1.0
○ Description: Required price change percentage for valid divergence patterns.
Higher values filter out weaker signals
✅ Best Use Cases
● Trading with intraday to daily timeframes for institutional position identification
● Confirming trend reversals when divergences align with support/resistance levels
● Entry timing in trending markets when institutional bias supports the direction
● Risk management by avoiding trades against strong institutional positioning
● Multi timeframe analysis combining short term signals with longer term bias
⚠️ Limitations
● Requires sufficient volume for accurate institutional detection in low volume markets
● Divergence signals may have false positives during highly volatile news events
● Best performance on liquid markets with consistent institutional participation
● Lagging nature of volume based calculations may delay signal generation
● Effectiveness reduced during low participation holiday periods
💡 What Makes This Unique
● Multi Factor Analysis: Combines volume, price, and momentum for comprehensive institutional detection
● Adaptive Zones: Dynamic overbought/oversold levels that adjust to market conditions
● Volume Intelligence: Advanced algorithms identify institutional sized transactions
● Professional Visualization: Multiple display styles with customizable themes
● Confirmation System: Multiple validation layers reduce false signal generation
🔬 How It Works
1. Volume Analysis Phase:
● Analyzes current volume against historical averages to identify institutional activity
● Applies multi timeframe analysis for enhanced detection accuracy
● Calculates volume pressure through buying vs selling momentum
2. Smart Money Flow Calculation:
● Combines typical price with volume weighted analysis
● Applies institutional trade weighting for high volume periods
● Generates directional flow based on price momentum and volume expansion
3. Divergence Detection Process:
● Identifies pivot highs/lows in both price and indicator values
● Validates divergence strength against minimum threshold requirements
● Confirms signals through multiple technical factors before generation
💡 Note: This indicator works best when combined with proper risk management and position sizing. The institutional bias component helps identify market sentiment shifts, while divergence signals provide specific entry opportunities. For optimal results, use on liquid markets with consistent institutional participation and combine with additional technical analysis methods.

Volume Spike Alert & Overlay"Volume Spike Alert & Overlay" highlights unusually high trading volume on a chart. It calculates whether the current volume exceeds a user-defined percentage above the historical average and triggers an alert if it does. The information is also displayed in a customizable on-screen table.
What It Does
Monitors volume for each bar and compares it to an average over a user-defined lookback period.
Supports multiple smoothing methods (SMA, EMA, WMA, RMA) for calculating the average volume.
Triggers an alert when current volume exceeds the threshold percentage above the average.
Displays a table on the chart with:
Current Volume
Average Volume
Threshold Percentage
Optional empty row for spacing/formatting
How It Works
User Inputs:
lookbackPeriods: Number of bars used to calculate the average volume.
thresholdPercent: % above the average that triggers a volume spike alert.
smoothingType: Type of moving average used for volume calculation.
textColor, bgColor: Formatting for the display table.
tablePositionInput: Where the table appears on the chart (e.g., Bottom Right).
Toggles for showing/hiding parts of the table.
Volume Calculations:
Calculates current bar's volume.
Calculates average volume using the selected smoothing method.
Computes the threshold: avgVol * (1 + thresholdPercent / 100).
Compares current volume to threshold.
Table Display:
Dynamically creates a table with volume stats.
Adds rows based on user preferences.
Alerts:
alertcondition fires when currentVol crosses above the calculated threshold.
Message: "Volume Threshold Exceeded"
Usage Examples
Example 1: Spotting High Activity
Apply the script to a stock like AAPL on a 5-minute chart.
Set lookbackPeriods to 20 and thresholdPercent to 30.
Use EMA for more reactive volume tracking.
When volume spikes more than 30% above the 20-period EMA, an alert triggers.
Example 2: Day Trading Filter
For scalpers, apply it to a 1-minute crypto chart (e.g., BTC/USDT).
Set thresholdPercent to 50 to catch only strong surges.
Position the table at the top left and reduce visible info for a clean layout.
Example 3: Long-Term Context
On a daily chart, use SMA and set lookbackPeriods to 50.
Helps identify breakout moves supported by strong volume.
How this is different from Trading View's Volume indicator:
The standard volume plot from trading view allows users to set a alert when the average line is crossed, but it does not allow you to set a custom percentage at which to trigger an alert. This indicator will allow you to set any percentage you wish to monitor and above that percentage threshold will trigger your alert.
===== ORIGINAL DESCRIPTION =====
Volume Spike Alert & Overlay
This indicator will display the following as an overlay on your chart:
Current volume
Average Volume
Threshold for Alert
Description:
This indicator will display the current bar volume based on the chart time frame,
display the average volume based on selected conditions,
allow user selectable threshold over the average volume to trigger an alert.
Options:
Average lookback period
Smoothing type
Alert Threshold %
Enable / Disable Each Value
Change Text Color
Change Background Color
Change Table location
Add/Remove extra row for placement in top corner
Usage Example:
I use this indicator to alert when the current volume exceeds the average volume by a specified percentage to alert to volume spikes.
Set the threshold to 25% in the settings
Create an alert by clicking on the 3 dots on the right of the indicator title on the chart
When the threshold is exceeded the alert will trigger
