AutoLevelsAuto Levels is a Work in progress.
It is based on the previous days ATR and the current days opening tick.
It takes that info and uses Fibonacci to automatically draw key levels for the day.
I have added the BULL BAR ( Green bar ) and Bear Bar ( Red Bar ) to signal as a Go Long / Go Short line in the sand.
The Tan bars are also proven key "Take Profit" levels.
These are, on average, major points of reversals, dip buys or consolidation.
I use this on the 5min timeframe and a close above or below a key level is my signal and direction. Auto Levels have proven to be a great indicator of major support and resistance.
Volumespike

Outliers Detector with N-Sigma Confidence Intervals (TG fork)Display outliers in either value change, volume or volume change that significantly deviate from the past.
This uses the standard deviation calculation and the n-sigmas statistical rule of significance, with 2-sigma (a value of 2) signifying that the observed value is stronger than 95% of past values, and 3-sigma 98.5% of past values, and so on for higher sigma values.
Outliers in price action or in volume can indicate a strong support for the move, and hence potentially more moves in the same direction in the future. Inversely, an insignificant move is less likely to be supported. And of course the stronger, the more support.
This indicator also doubles as a standard volume indicator if volume is selected as the source, but with the option of highlighting outliers.
Bars below significance can be uncolored (gray) to unclutter the visuals.
Differently to almost all other similar indicators, the background highlighting is dynamical, so that all values will be highlighted differently, not just 2-sigma or 3-sigma, but also 4-sigma, 5-sigma, etc, with a different value of transparency.
The dynamical transparency value can be calculated in two ways: either statically proportionally to the n-sigma but capped at 10-sigma, or either as a ratio relative to the highest observed sigma value over the defined lookback period (default: 300).
If you like this indicator, which is an extension of previously published indicators, please give some love to the original authors:
* tvjvzl :
* vnhilton :
This extension, authored by Tartigradia, extends tvjvzl's indi, implements vnhilton's idea of highlighting the background, and go further by adding dynamical background highlighting for any value of sigma, add support for volume and volume change (VolumeDiff) as inputs, add option to uncolor insignificant bars, allow plotting in both directions and more.

Volume composition / quantifytools— Overview
While net volume is useful information, it can be a blunt data point. Volume composition breaks down the content of volume, allowing a more detailed look inside each volume node. Volume composition consists of the following information:
Total volume (buy and sell). By default gray node.
Dominating volume (buy or sell). By default dark green/dark red node.
Dominating active volume (buy or sell). By default light green/light red node.
Dominating volume as percentage of total volume.
Dominating active volume as percentage of total active volume.
Buy and sell volume is defined by volume associated with lower timeframe up/down moves. This classification is further broken down to passive/active, standing for decreasing/increasing volume, e.g. a move up with volume higher than previous bar volume = active buy volume, a move up with volume lower than previous bar volume = passive buy volume.
Volume data is fetched from a lower timeframe that is automatically adjusted to fit the timeframe you're using. By default, the following settings are applied:
Charts <= 30 min: 1 minute timeframe
Charts > 30 min & <= 3 hours : 5 minute timeframe
Charts > 3 hours & <= 8 hours : 15 minute timeframe
Charts > 8 hours & <= 1D: 1 hour timeframe
Charts > 1D & <= 3D : 2 hour timeframe
Charts > 3D: 4 hour timeframe
Timeframe settings can be changed via input menu. The lower the timeframe, the more precision you get but with the cost of less historical data and slower loading time. Users can also choose which source to use for determining buy/sell volume, e.g. using close as source, a close that is higher than previous close would be considered as buy volume. This could be replaced with OHLC4 for example, resulting in a volume direction based on OHLC average.
Volume composition of current chart can also be replaced with any other chart volume composition:
— Visuals
Breakdown of visual elements:
1. Symbol and timeframe used for volume composition calculations. By default the chart that is viewed and automatically selected lower timeframe.
2. Dominating volume threshold exceeded. Can be defined via input menu, 70% of total volume by default.
3. Dominating volume as percentage of total volume. Plotted below volume nodes, without % symbol.
4. Dominating active volume, + or - symbol, standing for buy and sell. Plotted below dominating volume percentage. When dominating volume and dominating active volume sides are in a disagreement (e.g. dominating volume is on buy side while dominating active volume is on sell side) this symbol will appear inside brackets, (+) or (-).
5. Dominating active volume as percentage of total active volume. Plotted below +/- symbol.
6. Dominating active volume threshold exceeded. Can be defined via input menu, 70% by default.
Dominating volume & active volume percentages can be rounded to single numbers to avoid clutter caused by overlapping values. The percentage values will be rounded to closest single number value, e.g. dominating volume percentage at 54% = 5, dominating volume percentage at 55% = 6.
Volume anomalies can be highlighted on the chart with a color for studying the events and their past implications in greater detail. Available anomalies for highlights are the following:
Buy volume threshold exceeded
Sell volume threshold exceeded
Active buy volume threshold exceeded
Active sell volume threshold exceeded
Volume & active volume divergence
— Practical guide
Volume is arguably one of the most important data points as it directly relates to liquidity. High volume can be an indication of strength (price likely to continue moving) or absorption (price likely to halt/turn). Same applies to active volume, but with an element of aggression. High active volume serves as an indication of exuberance or otherwise forceful transacting, like stop losses triggering. With these principles in mind, the composition of volume allows distinguishing potentially important events.
Example #1 : Identifying areas of trapped market participants
Often when volume spikes distinctively, we can make the case that price has found sufficient liquidity to halt/turn. Since we know which side was absorbed, in what quantity and type (passive/active), we can identify areas of trapped market participants. In such scenarios, the higher the dominant active volume and volume spike itself, the better.
Example #2 : Identifying a healthy trend
A healthy trend is one that has an active and consistent bid driving it. When this is the case, it can be seen in consistently supportive active volume.
Example #3 : Identifying inflection points
When dominant side of volume and dominant side of active volume diverge, something is up. A divergence often marks an area of indecision, hinting an imminent move one way or the other.

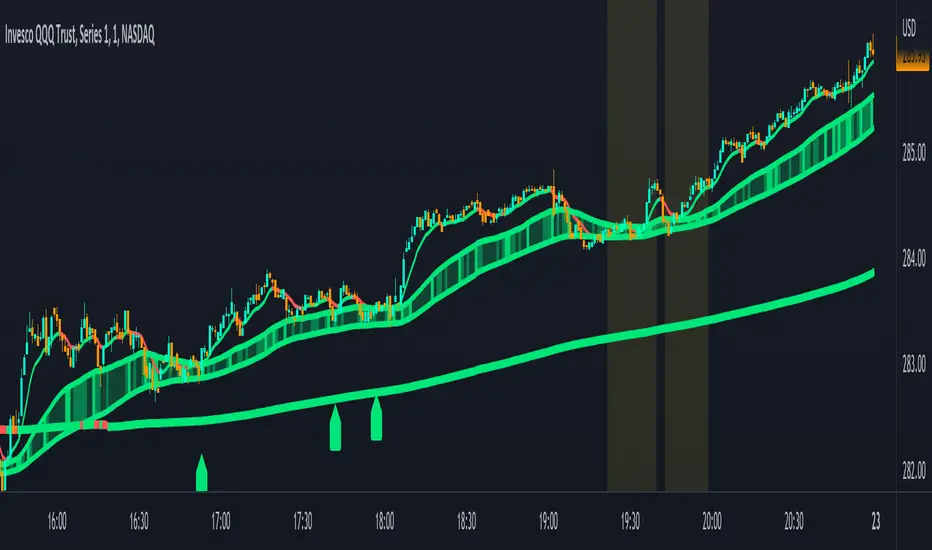
Combined Moving Averages + Squeeze & Volume Spike SignalsThis is a set of 4 combined moving averages. Each moving average is a combination of an EMA, SMA, HMA, RMA, WMA and VWMA with the same length as set in your input settings. All 6 of them are added together and then divided by 6 for an average of all of them. This is based on the theory that most traders use their own preference of moving averages, so combining them all should give us a better idea of where price should actually react since we are using the average of what most traders are using on their charts. It also smooths the moving averages out as well so you get a much easier to read moving average than any of them on their own which should help you hold positions longer and time your entries better.
The default lengths used for this indicator are as follows: 10, 50, 100 and 500. These lengths can be updated in the settings. The 10 and 500 will change colors when the individual moving average is less than or greater than its previous value. Price above or below the moving average does not affect the colors. The 50 and 100 are colored based on whether the 50 is greater/less than the 100.
The two middle length moving averages by default are the 50 and 100. This has been turned into a cloud because it is the area where price typically bounces, since tons of traders use the 50 and 100 moving averages. This should be your long/short zone when price is trending.
Each moving average can be set to use a different source such as close, open, high, low, ohlc4, etc. You can also adjust the length of each moving average. Default settings work well, but feel free to customize them to your liking. You can also change the colors of the lines in the settings.
Beware that changing the lengths of MA #2 and MA #3 will change the signals, squeezes and the cloud.
VOLUME SPIKES
The cloud will change to a brighter color when a volume spike is detected. When a major volume spike is detected, it will turn very bright colored green/red according to the direction of the cloud. This notifies you of volume spikes so you have a better idea of how strong the trend is. If the cloud is a dark green/red then that means that volume is less than or equal to the recent median volume.
SIGNALS
There are also signals that will be given when the current candle is in the cloud, the candle is going in the same direction as the cloud, the MA #2 and MA #3 is going in the same direction and a volume spike is detected. These help you identify good entries when markets are trending. Be cautious of these signals when the trend is sideways and not clearly moving in one direction. The signals can be turned on or off in the settings.
SQUEEZE
Many times when moving averages squeeze together, a big move happens shortly after. Because of this I added a yellow background color when a squeeze is detected. It looks at the median value difference of the MA #2 and MA #3 and if the current value difference is less than the median multiplied by the multiplier in the settings then it will change the background color to notify you. The default value of the multiplier is .6, meaning the squeeze signal will only show if the current value difference of the cloud is less than .6 of the median difference. The multiplier can be adjusted in the settings to suit your preferences. Lower values will only show tighter squeezes.
MARKETS
This indicator can be used on all markets including stocks, crypto, futures and forex.
TIMEFRAMES
This indicator can be used on all timeframes.
PAIRINGS
We recommend pairing this combined moving average with Trend Friend Swing Trade And Scalp Signals for extra confluence. Look for price to bounce in the cloud with good volume and a confirming signal from Trend Friend for highly probable moves.
Inducement / Stop Hunt [TFO]This indicator shows inducement / stop hunts accompanied by volume spikes. The idea is inspired by ICT (Inner Circle Trader) concepts where price is always seeking "liquidity" by reaching for trivial pivots where the average retail trader would put their stop loss. When price seeks these levels and stops out these traders, you might expect an influx of volume due to the high number of shares/contracts being exchanged. And when there is an above-average spike in volume at these prices, it's possible to assume "smart money" may be buying retail's sell stops and vice versa. This is just my interpretation - I'm aware that ICT doesn't use volume as part of his analysis, and often advocates against using volume altogether, however I personally find it to be a great analytical tool in this context.
In my opinion this works best on 1m and smaller timeframes. Volume gets very diluted on timeframes greater than 1-3 minutes. It's easier to find volume spikes on very small timeframes like the 15s.

Volume SpikesShows volume spikes over a certain threshold, using a symbol's volume moving average as the baseline. Offers a few different filters regarding candle shapes and types, in an attempt to catch quick moves on extremely low timeframes (sub-1m).
Ultimately I would like to integrate this logic into an indicator that contains automated stop raid/inducement detection.

Volume ROC and 2nd Derivative by ianhThe purpose of this code is to graph a volume simple moving average (sma) and it's first and second derivatives to provide traders with additional information that might determine if volume is converging or diverging with price. The yellow line represents the volume sma, the red line represents the first derivative or the rate of change of the volume and the green line represents the second derivative or acceleration of volume. For long term trading, if the yellow line is "trending" upwards with higher highs and higher lows it means that volume is supporting the over all long term price trend. If the volume is decreasing over the long term then it is not supporting the current price trend. The first and second derivatives may help short term weekly traders confirm price movements. There are several different conditions to look for:
First (Red) ++ Second (Green) --, Trading volume at the current price has "peaked" and the price may reverse soon.
First (Red) -- Second (Green) ++, Trading volume at the current price has "troughed" and the price may reverse soon.
First (Red) + Second (Green) +, Trading volume is not only increasing but it's accelerating which might confirm a large price movement.
First (Red) - Second (Green) -, Trading volume is not only decreasing but it's decelerating which might indicate little to no price movement.

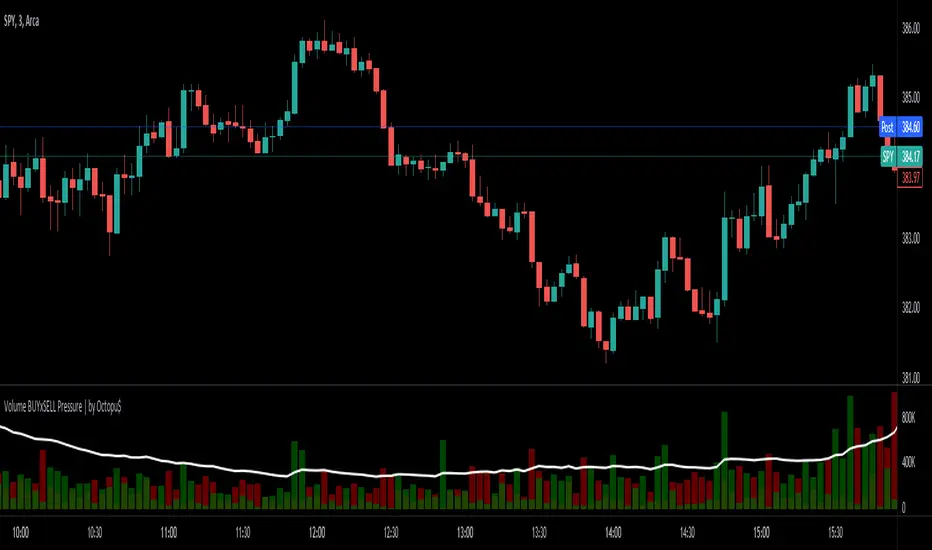
⚖ Volume BUYxSELL Pressure | by Octopu$⚖ Volume BUYxSELL Pressure | by Octopu$
Volume is the number of shares traded in a particular stock, index, or other investment over a specific period of time.
It can indicate market strength, as rising markets on increasing volume are typically viewed as strong and healthy.
In fact, the more, the better. Institutions tend to get more involved in a stock with daily dollar volume in the hundreds of millions or more
But also, when prices fall on increasing volume, the trend is gathering strength to the downside.
That's where BUYxSELL Pressure | by Octopu$ comes in.
Typically, Volume bars follow the candles.
If the Candle is Green (Close > Open), the Volume Bar is also Green.
Now if the Candle is Red (Close < Open) the Volume Bar is also Red.
You never know if it is being Bought or Sold.
This changes the game: along with Price Action, Trend Direction, and other factors. This is possible!
This indicator is composed of:
Volume itself (all of it), displayed by Gray bars;
Identifies Buying Pressure on Green Bars;
And Selling Pressure with Red Bars.
Volume Average as a White Line, for the last "X" Days
Additionally,
It presents a Yellow Triangle as and indication of when the Volume is above the Average in the current TF you are in.
Additionally, this can be set up via an Input: Means if you like to watch it 10% above Average, you got it. 25%? 50%?... You name it.
On top of that,
Includes an indication for Volume Spike as well. So if informs you visually on the Volume Bars of any surges on the TF you are in.
For example: 2x the Volume from the last Candle. Or maybe 3x? 5x... The way you like it the best.
This way, with the combination of your understanding as well as other Indicator and Factor as Confluence, you can improve your analysis and figure out what is going on.
www.tradingview.com
(SPY 5m as an example only)
SPY
Features:
• Total Volume
• Average Volume
• Buying Pressure
• Selling Pressure
• % Above Average
• Volume Spike/Surge (Multiplier)
• Custom Settings
Options:
• Show/Hide Average Line
• Change Length of Average (Days)
• Select/Personalize % of Above Avg
• Add Personalized X Multiplier
• Fully customizable on Style and Colors
• Change shapes and Location
Notes:
v1.0
Indicator release.
Changes and updates can come in the future for additional functionalities or per requests. Follow and Stay Tuned!
Did you like it? Please Support and Shoot me a message! I'd appreciate if you dropped by to say thanks! Thank you.
- Octopu$
🐙
High volume zone█ OVERVIEW
Show high volume zone in a lower timeframe.
█ CONCEPTS
1- Choose an amount of volume (1 000 by default)
2- Choose a timeframe (1 minute by default)
3- It highlight every zone where volume was > 1000 in less than one minute
█ OTHER SECTIONS
Limitation:
- Unfortunately, I didn't find a way to make it in a lower timeframe than 1 minute with Pinescript
- It is truncate by minute so a high volume between two lower tf candles may not be count
If you have a solution for these, glad to hear it.

Auto Support & Resistance Volume Based + ScannerThis indicator tracks large marker maker orders and draws support & resistance levels based on where those orders came in. It allows you to track what the market makers are doing and place your trades in line with them. Look for the lines to suck up to the price and that will show you where large orders are coming in which is where reversals will happen or trend continuation will happen at an accelerated rate. The fat lines are higher timeframe volume spikes and major volume spikes. Look for bounces off of these fat lines. The fatter the line, the bigger the volume spike. The skinny lines are minor volume spikes over shorter time periods. These can be viewed as short term support and resistance levels and consolidation zones.
***HOW TO USE***
Look for bounces off of the fat lines and place trades accordingly. Those levels are where the market makers placed their orders and you will notice how well price reacts to these levels.
Look for the lines to suck up/down to the price. This shows you where volume is coming in which typically means a reversal is about to happen. If a reversal doesn’t happen, then the trend will continue its original direction, but usually move faster. Wait for these lines to suck up to price before trying to buy the bottoms or sell the tops. If you can have the patience to wait for this to happen, it will keep you out of a lot of choppy price action and give you very good places to take trades that move quickly.
When all the levels suck up to the price and all the colors change to red from green or green from red, it is an indication of market sentiment changing and the trend will likely reverse.
For best results, use this on charts for exchanges that have the highest volume and the most institutional buyers as those will give better levels since there are more market makers on those exchanges. Use exchanges such as NYSE, ARCA and NASDAQ for stocks and use COINBASE, BINANCE, MEXC perpetual futures charts or PEPPERSTONE for crypto.
If price breaks out or down from the group of levels and no lines suck up to the price, then it is a low volume breakout and price usually comes right back to the support and resistance levels so beware when this happens.
If there are no levels near the current price, look at the previous levels in that price range as those are still very relevant areas.
You can also draw trendlines from recent high and low points of the lines where they changed, which works very well for finding tops/bottoms in confluence with the real time s&r levels.
I recommend looking at higher timeframes and drawing horizontal lines where the fat lines are that extend for a long period of time. Then you will have those levels on your lower timeframe charts so you don’t miss any major levels that price will likely bounce off of.
Make sure you spend some time looking back at historical data so you can get a feel for how this indicator reacts to volume spikes before using it.
***HIGHER TIMEFRAMES***
This indicator scans higher timeframes for volume spikes, so make sure you update the higher timeframes used when looking at anything higher than the 1 minute timeframe as that is what the settings are optimized for. You can create new chart layouts for each timeframe you use frequently and save your settings on each chart so that you don’t have to update those settings when you switch timeframes.
***SCANNER***
The table at the bottom of the screen scans 8 other tickers for volume spikes. When a volume spike is detected, the color of that ticker will change from blue to orange to notify you. You can customize which tickers the indicator scans within the indicator settings. Make sure to save your chart layout with your updated tickers so you don’t have to change them frequently. Input all tickers from a certain sector to see how that sector is performing overall which can help give you a good idea of the sector as a whole. Save a different chart layout with each different sector you want to scan so you don’t have to switch the tickers frequently.
***ALERTS***
This indicator is set up with alerts that can be turned on to notify you of volume spikes on the ticker that the chart is set to.
***CUSTOMIZATION***
You can customize the colors of the lines and backgrounds in the indicator style tab. You can also turn off the scanner if you want to within the indicator input tab. The tickers to scan can be customized to suit your preferences within the indicator input tab. The higher timeframes used can also be adjusted within the indicator input tab.
***MARKETS***
This indicator can be used on all markets that have volume data, including stocks, crypto, futures and forex.
***TIMEFRAMES***
This indicator can be used on all timeframes as long as there is enough data for the session used.
***TIPS***
Try using numerous indicators of ours on your chart so you can instantly see the bullish or bearish trend of multiple indicators in real time without having to analyze the data. Some of our favorites are our Trend Friend Signals, Volume Profile with Buy & Sell Pressure, RSI Scalper Ribbon and Auto Support & Resistance with Wick Signals to find those major levels that are not associated with volume spikes in combination with this volume based auto support and resistance indicator.

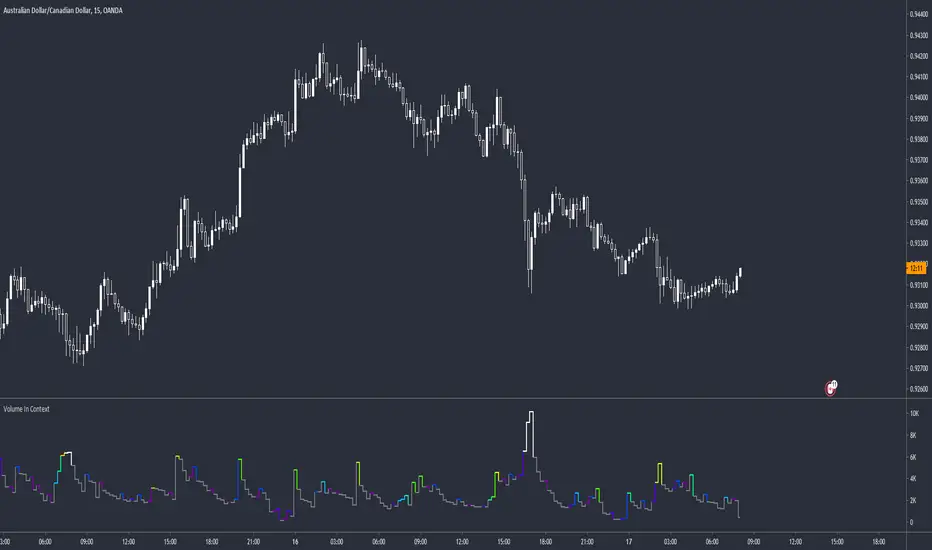
PulseVolume can help confirm signals we might discover using other methods of technical analysis .
This indicator's logic spots above-average turnover and then tests against the price change. Pulse highlights sessions with heavy volume and directional moves. This can help take out the noise and help confirm the trend.

Volume Spikes & Growing Volume Signals With Alerts & ScannerVOLUME SPIKES & GROWING VOLUME SIGNALS WITH ALERTS & SCANNER
This indicator shows arrows when there is a volume spike. It also paints the background when volume is growing. There is also a volume scanner for 8 tickers that will change color in real time when your other favorite tickers see volume growth and spikes.
You can customize the length of DMI, the number of bars to calculate the current volume average from, the number of bars back to get the overall volume average from, the multiple that needs to be hit to give a signal, the position of the scanner table and which tickers are used in the scanner. There are detailed directions as tooltips in the indicator settings you can read to understand exactly what each input does.
All features are customizable as well as which tickers the screener uses.
***HOW TO USE***
Watch for volume to pick up before placing trades as this will help you stay out of the markets when price is choppy. Volume usually brings volatility so watch for the volume signals to show up on the chart. Typically when price has made a big move one direction or is consolidating and you see the volume indicator start giving signals, the market is ready to reverse or continue its current trend but move faster in that direction.
Volume Spikes
When there is a volume spike that is larger than the average of volume over the last 100+ bars(depending on your settings) multiplied by the volume amount multiplier(in your settings) then an arrow will show up on the chart. This arrow will be green if DMI is bullish and red if DMI is bearish.
Volume Growth
A Background color will appear when the average volume over the last 5 bars(depending on your settings) is higher than the average volume over the last 100+ bars(depending on your settings) and is greater than your multiple. It will also paint the background when the volume moving average has increased over the last 3 bars consecutively. The background colors will be red or green depending on buy & sell pressure(DMI). If the background color appears, then you know volume is growing and volatility is near.
Volume Scanner
The scanner can be customized to have all of your favorite tickers by changing the tickers used in the indicator settings at the bottom. When no volume growth or spikes are detected, the ticker will show as light blue. When volume spikes or growth is detected, the ticker will turn orange to notify you.
Alerts
You can set up alerts as well when there is volume growth, bullish volume spikes and bearish volume spikes on any chart or timeframe.
Indicator Settings
Settings will need to be adjusted across different tickers as some have large swings in volume and some stay pretty even, so make sure to set up different chart layouts with settings that work for each ticker and save them individually so you don’t have to reset these values every time you switch charts.
***MARKETS***
This indicator can be used as a signal on all markets, including stocks, crypto, futures and forex as long as Tradingview has volume and DMI data for that ticker.
***TIMEFRAMES***
This volume spike indicator can be used on all timeframes as long as there is enough data for Tradingview to use for calculations.
***TIPS***
Try using numerous indicators of ours on your chart so you can instantly see the bullish or bearish trend of multiple indicators in real time without having to analyze the data. Some of our favorites are our Auto Fibonacci, Volume Profile, Momentum, Auto Support And Resistance and Money Flow Index in combination with this Volume Growth indicator. They all have real time Bullish and Bearish labels as well so you can immediately understand each indicator's trend.

WhaleCrew VolumeThis indicator aims to provide a deeper insight into market events by using volume data.
Features
Aggregating volume data across multiple exchanges (only for built-in crypto pairs, e.g. BTC and ETH)
Detection of volume spikes (customizable size)
Alerts for volume spikes (breakouts/mass liquidation events)
Configurable moving average type
Custom moving average multiplier
Usage
The composition of the aggregated volume data can be visualized to show the respective volume of each exchange.
Identify which exchanges (and their traders) fueled price movement. Was their share in the total aggregated volume higher/lower than previously?
Pay attention to exchanges that are notorious for a lot of beginner/retail traders to make more informed decisions.
The volume spike detection is ideal for getting alerted whenever a breakout (in price action and/or volume) or mass liquidation takes place.
(Spikes are detected relative to the set moving average.)
Access to this indicator can be obtained through our website.

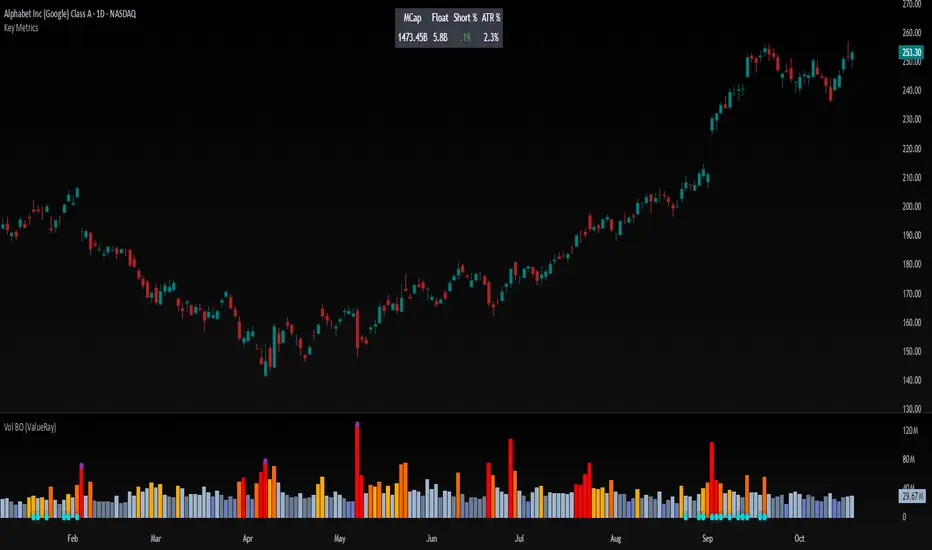
Volume Breakout (ValueRay)Easy visuals on, if volume is way over average. Good for Mean Reverting. Higher Volume tends to higher breakout chances.
Please whisper me for for ideas how to make this better. Its a very simple script, but got some alpha. If you know how to improve, let me know and i will code it into.
Intraday Volume Spikes HeatmapHello friends,
Here's something truly special for intraday traders: this script identifies and visualizes abnormal volume activity clusters throughout the trading day, giving you an instant overview of when the market gets unusually active. It's designed specifically for intraday charts with volume data available.
No setups, no guesswork — just plug it in and see where volume truly spikes.
🛠 How It Works
The indicator divides the trading session into a 60×24 grid — minutes across the horizontal axis and hours down the vertical one.
It tracks each bar's volume (or price spread, or relative change — depending on your selected metric) and highlights the frequency of abnormal activity using a smooth color heatmap.
You can analyze the full chart history or focus on a specific date range.
All the data is neatly displayed in a customizable on-chart table, allowing you to instantly spot intraday periods with heightened trading activity.
🔥 Key Features
Pine Script V6 — optimized and refactored for performance and maintainability
Detects abnormal volume activity — instantly see where volume spikes most often within the day
4 analytical modes — Volume Amount, Volume % Change, High/Low Spread, and Price % Change
Configurable analysis window — use entire chart history or a specific date range
Overlay Mode — display the heatmap directly on your chart or in a separate panel
Customizable appearance — fine-tune colors, borders, text, and layout
17 professional color palettes — including Viridis, Inferno, Magma, and Plasma
Time zone offset support — align analysis with your local time if needed
📸 Visual Examples
Viridis palette
Inferno palette
If you'd like access or have any questions, feel free to reach out to me directly via DM.
👋 Good luck and happy trading!
Skrip berbayar

Relative Volume & RSI PopThis is a basic idea/script designed to take a breakout trade by taking advantage of volume spikes when price/strength is extended (either long or short).
The script only utilises two indicators, the Relative Volume (RV) and the Relative Strength Index (RSI). The script allows the user to select a RSI value between 69 up to 100 for a long trade and between 35 down to 0 for short trade and then pair this with RV from 0 - 10. The period for both the RSI and RV can also be amended by the user but I found in most cases there was no benefit gained by changing away from normal "14" period lookback. The script typically only has small draw downs as the script is designed to exit the trade when the RSI returns back to "normalised" level, therefore the trades are generally quite short. The exit condition for a long trade is when RSI crosses back below 69 (which is why you cannot enter a long below this value) and for a short the, trade will close when RSI crosses back above 35 (which is why you cannot enter a short above this value). These exit values are locked.
By allowing RSI value to go all the way up to "100" on the long side and "0" on the short side this in effect is a way of eliminating the script from taking either longs or shorts if lets say you wanted to back test the script for long only spikes or short only spike. E.G. By setting RSI upper value to "75" the RV to "1" and RSI lower value to "0" then no short trades will not be taken in your back test as the RSI never really gets down to zero.
I put this together with meme stocks in mind and back tested it on day charts for AMC and then a few trending style stocks too. It typically worked best as long only and with RSI settings between 71 - 75 and RV at 1 or 1.5. I also found it had okay results on some lower 1hr timeframe futures markets and weekly time frames too (albeit trades were few and far between on weekly timeframe).
The beauty of such a basic script you could easily set up a trading view screener to look for these opportunities everyday and perhaps even add in an ADX filter on the screener to see if the trend is increasing. Then use this script to run a back test on the stocks that you've selected from the screener.

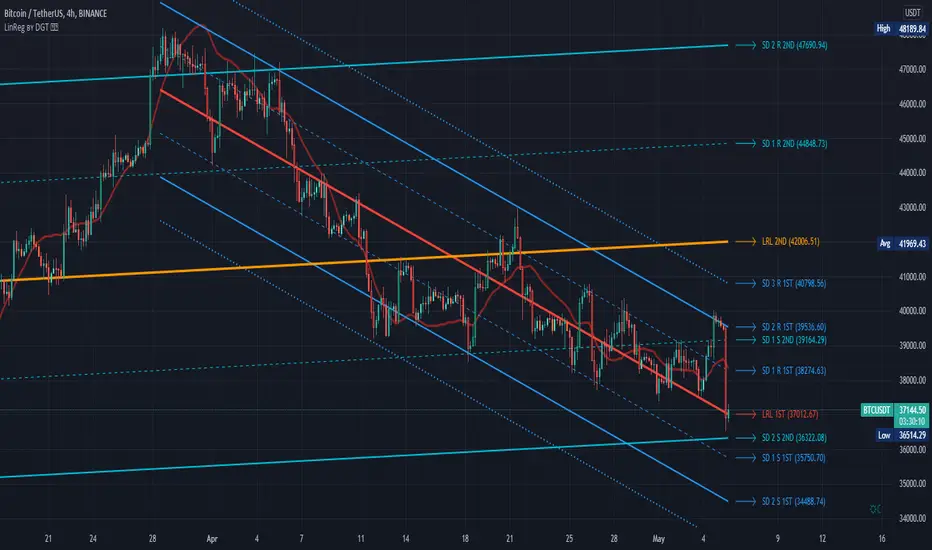
Linear Regression Channel / Curve / Slope by DGTTʜᴇ Lɪɴᴇᴀʀ Rᴇɢʀᴇꜱꜱɪᴏɴ Cʜᴀɴɴᴇʟꜱ
Linear Regression Channels are useful measure for technical and quantitative analysis in financial markets that help identifying trends and trend direction. The use of standard deviation gives traders ideas as to when prices are becoming overbought or oversold relative to the long term trend
The basis of a linear regression channel
Linear Regression Line – is a line drawn according to the least-squares statistical technique which produces a best-fit line that cuts through the middle of price action, a line that best fits all the data points of interest. The resulting fitted model can be used to summarize the data, to predict unobserved values from the same system. Linear Regression Line then present basis for the channel calculations
The linear regression channel
2. Upper Channel Line – A line that runs parallel to the Linear Regression Line and is usually one to two standard deviations above the Linear Regression Line.
3. Lower Channel Line – This line runs parallel to the Linear Regression Line and is usually one to two standard deviations below the Linear Regression Line.
Unlike Fibonacci Channels and Andrew’s Pitchfork, Linear Regression Channels are calculated using statistical methods, both for the regression line (as expressed above) and deviation channels. Upper and Lower channel lines are presenting the idea of bell curve method, also known as a normal distribution and are calculated using standard deviation function.
A standard deviation include 68% of the data points, two standard deviations include approximately 95% of the data points and any data point that appears outside two standard deviations is very rare.
It is often assumed that the data points will move back toward the average, or regress and channels would allow us to see when a security is overbought or oversold and ready to revert to the mean
please note : Over time, the price will move up and down, and the linear regression channel will experience changes as old prices fall off and new prices appear
█ Linear Regression Study Features
Linear Regression Channel
- Linear regression line as basis
- Customizable multiple channels based on Standard Deviation
- ALERTs for the channel levels
Linear Regression Curve
- Linear regression curve as basis
- Optional : Bands based on Standard Deviation or Volatility (ATR). Bands are applied with fixed levels 1, 2 and 3 times StdDev or ATR away from the curve
Linear Regression Slope
- Optional : Up/Down slope arrows for a used defined period
█ Volume / Volatility Add-Ons
High Volatile Bar Indication
Volume Spike Bar Indication
Volume Weighted Colored Bars
Price Action - Support & Resistance by DGTSᴜᴘᴘᴏʀᴛ ᴀɴᴅ Rᴇꜱɪꜱᴛᴀɴᴄᴇ , is undoubtedly one of the key concepts of technical analysis
█ Sᴜᴘᴘᴏʀᴛ ᴀɴᴅ Rᴇꜱɪꜱᴛᴀɴᴄᴇ Dᴇꜰɪɴɪᴛɪᴏɴ
Support and Resistance terms are used by traders to refer to price levels on charts that tend to act as barriers, preventing the price of an financial instrument from getting pushed in a certain direction.
A support level is a price level where buyers are more aggressive than sellers. This means that the price is more likely to "bounce" off this level rather than break through it. However, once the price has breached this level it is likely to continue falling until meeting another support level.
A resistance level is the opposite of a support level. It is where the price tends to find resistance as it rises. Again, this means that the price is more likely to "bounce" off this level rather than break through it. However, once the price has breached this level it is likely to continue rising until meeting another resistance level.
A previous support level will sometimes become a resistance level when the price attempts to move back up, and conversely, a resistance level will become a support level as the price temporarily falls back.
█ Iᴅᴇɴᴛɪꜰʏɪɴɢ Sᴜᴘᴘᴏʀᴛ ᴀɴᴅ Rᴇꜱɪꜱᴛᴀɴᴄᴇ
Support and resistance can come in various forms, and the concept is more difficult to master than it first appears. Identification of key support and resistance levels is an essential ingredient to successful technical analysis.
If the price stalls and reverses in the same price area on minimum of two different occasions, then a horizontal line is drawn to show that the market is struggling to move past that area. Those areas are static barriers, one of the most popular forms of support/resistance and are highlighted with horizontal lines.
Repeated test , the more often a support/resistance level is "tested" over an extended period of time (touched and bounced off by price), the more significance is given to that specific level
High volume , the more buying and selling that has occurred at a particular price level, the stronger the support or resistance level is likely to be
Market psychology , plays a major role as traders and investors remember the past and react to changing conditions to anticipate future market movement.
Psychological levels , is a price level that significantly affects the price of an underlying financial instrument. Typically, near round numbers often serve as support and resistance
The following support and resistance related topics are beyond the scope of this study, so they will be mentioned roughly only as a reference for support and resistance concept
Trendlines , Support and resistance levels in trends are dynamic. Throughout an uptrend, levels of support tend to look like a trendline, usually clustering around higher lows. As the price rises, the price where buyers consider the stock to be “too cheap” also changes, which creates new support levels on the way up. The same is also true for resistance levels. In an uptrend, a stock is continuously breaking through perceived resistance levels and making new highs
Moving Averages , is a constantly changing line that smooths out past price data while also allowing the trader to identify support and resistance. In the example Notice how the price of the asset finds support at the moving average when the trend is up, and how it acts as resistance when the trend is down
The Fibonacci Retracement/Extension tool , is a favorite among many short-term traders because it clearly identifies levels of potential support and resistance
Pivot Point Calculations , is another common technical analysis technique, where pivot point is calculated based on the high, low, and closing prices of previous trading session/day and support & resistance levels are projected based on the pivot point, different calculation techniques are available, as presented in this example of an pivot point indicator : PVTvX by DGT
█ Tʀᴀᴅɪɴɢ Bᴀꜱᴇᴅ ᴏɴ Sᴜᴘᴘᴏʀᴛ ᴀɴᴅ Rᴇꜱɪꜱᴛᴀɴᴄᴇ
Once an area or "zone" of support or resistance has been identified, those price levels can serve as potential entry or exit points because, as a price reaches a point of support or resistance, it will do one of two things—bounce back away from the support or resistance level (trading ranges), or violate the price level and continue in its direction (trading breakouts) —until it hits the next support or resistance level
The basic trading method for using support and resistance is to buy near support in uptrends or the parts of ranges or chart patterns where prices are moving up and to sell/sell short near resistance in downtrends or the parts of ranges and chart patterns where prices are moving down. Buying near support or selling near resistance can pay off, but there is no assurance that the support or resistance will hold. Therefore, consider waiting for some confirmation that the market is still respecting that area
Trading breakouts, a breakout is a potential trading opportunity that occurs when an asset's price moves above a resistance level or moves below a support level on increasing volume. The first step in trading breakouts is to identify current price trend patterns along with support and resistance levels in order to plan possible entry and exit points. Once the asset trades beyond the price barrier, volatility tends to increase and prices usually trend in the breakout's direction. Breakouts are such an important trading strategy since these setups are the starting point for future volatility increases, large price swings and, in many circumstances, major price trends. When trading breakouts, it is important to consider the underlying asset's support and resistance levels. The more times an asset price has touched these areas, the more valid these levels are and the more important they become. At the same time, the longer these support and resistance levels have been in play, the better the outcome when the asset price finally breaks out. Asset prices will often move slightly further than we expect them to. This doesn't happen all the time, but when it does it is called a false breakout. Therefore it is important to consider waiting for some confirmation while trading breakouts. It’s also popular for traders to sell 50% of their positions at the resistance level, and hold the rest in anticipation of a breakout above resistance
█ Pʀɪᴄᴇ Aᴄᴛɪᴏɴ - Sᴜᴘᴘᴏʀᴛ & Rᴇꜱɪꜱᴛᴀɴᴄᴇ ʙʏ DGT Sᴛᴜᴅʏ
This experimental study attempts to identify the support and resistance levels. Assumes a simple logic to discover moments where the price is rising or falling consecutively for minimum 3 bars with the condition volume increases on each bar and the last bar’s volume should be bigger than the long term volume moving average. A line will be drawn at the end of the move (highest or lowest, depending on the move direction), the line will be drawn at minimum on the 3rd bar and if condition holds for other consecutive bars the line will switch to 4th, 5th etc bar.
Lines will not be deleted so the historical ones will remain and will emphasis the levels significance when they overlap in feature. Strong levels are more likely to hold and cause the price to move in the other direction, whereas the minor levels may only cause the price to pause and keep moving in the same direction. Determining future levels of support and resistance can drastically improve the returns of a short-term investing strategy
Bar colors will be painted based on the volume of the specific bar to its long term volume moving average. This will help identifying the support and resistance levels significance and emphasis the sings of breakouts
Finally, Volume spikes will be marked on top of the price chart. A high volume usually indicates more interest in the security and the presence of institutional traders. However, a rapidly rising price in an uptrend accompanied by a huge volume may be a sign of exhaustion. Traders usually look for breaks of support and resistance to enter positions. When security break critical levels without volume , you should consider the breakout suspect and prime for a reversal off the highs/lows. Volume spikes are often the result of news-driven events. Volume spike will often lead to sharp reversals since the moves are unsustainable due to the imbalance of supply and demand
A good example with many support and resistance concepts observed on a stock chart and detected by the study
Settings:
Length of volume moving average, where volume moving average is used to detect support and resistance levels, is used as reference to compare with threshold values for volume spikes and colors of the bars
Hint, to get more historical lines scrolling chart to left will enable visualization of them. Please note they may appear to much all 500 line limit is used 😉
Special thanks to @HEMANT Telegram user, for his observations and suggestions
Disclaimer:
Trading success is all about following your trading strategy and the indicators should fit within your trading strategy, and not to be traded upon solely
The script is for informational and educational purposes only. Use of the script does not constitute professional and/or financial advice. You alone have the sole responsibility of evaluating the script output and risks associated with the use of the script. In exchange for using the script, you agree not to hold dgtrd TradingView user liable for any possible claim for damages arising from any decision you make based on use of the script

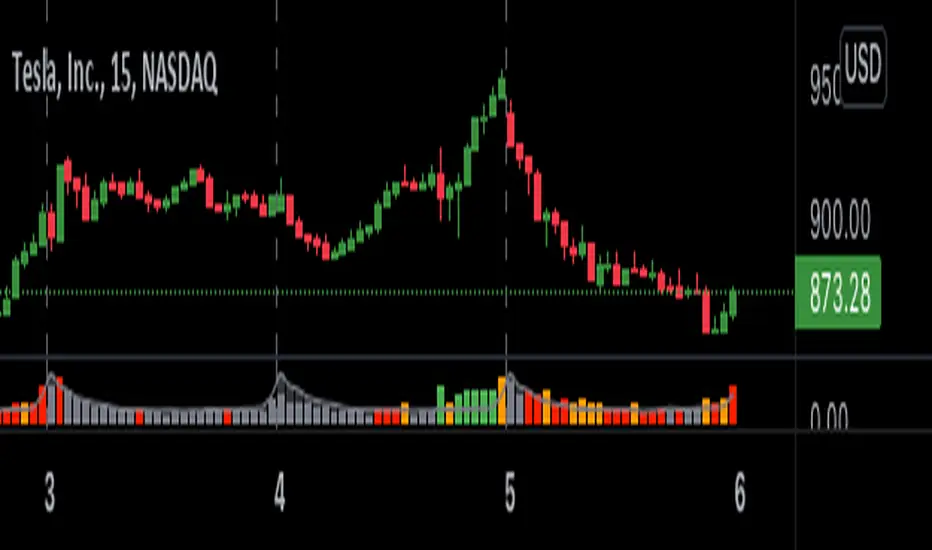
OPINICUS VOLUME DATA - Time Of Day Relative Volume (RVOL)This tool calculates the relative volume (RVOL) based on the normal average volume at that particular time of day.
Relative volume is a powerful piece of information because it offers a gauge as to whether a stock is in play or not. If RVOL is less than 1 it is not in play on this trading day or during this timeframe. If RVOL is above 2, it IS in play and can potentially be traded.
This script allows you to determine if relative volume is average, above average, 2x, or 3x via different color volume bars, at that particular time of day.
There are 2 different settings on this volume indicator.
The first setting is "Gradient." This is the preferred setting, and the one I personally use. Gradient is going to show you different color volume bars based on the RVOL multiple.
The color scheme is as follows:
Gray for average volume
Red if RVOL is between 1.0 and 1.5
Orange if RVOL is between 1.5 and 2
Green if RVOL is between 2.0 and 3.0
Lime green (bright green) if RVOL is greater than 3.
The second setting is "Price." This setting simply shows you the color of the candlestick. This is useful if you find the gradient setting to be too distracting, but still want to see if there is increased relative volume.
There is an alerts setting, which I find to be useful but can also be very distracting. If you leave the "Alert At RVOL %" setting at 0, then alerts will only be triggered if the current candle exceeds the 1.0 (100%) RVOL level. This happens far too frequently, so I prefer to put the alert at 2 or 3. If you change the "Alert At RVOL %" setting then alerts will be triggered if the RVOL percentage (blue number) exceeds your given value. The blue number is a percentage of the average, so if it’s at 1, then it’s 100% of the average.
Note: This tool does not work if you have after-hours or pre-market data displayed. The preferred setting for this tool is the 15' chart, with a 21 day look back period. It is also very useful on the daily chart when doing higher timeframe research.
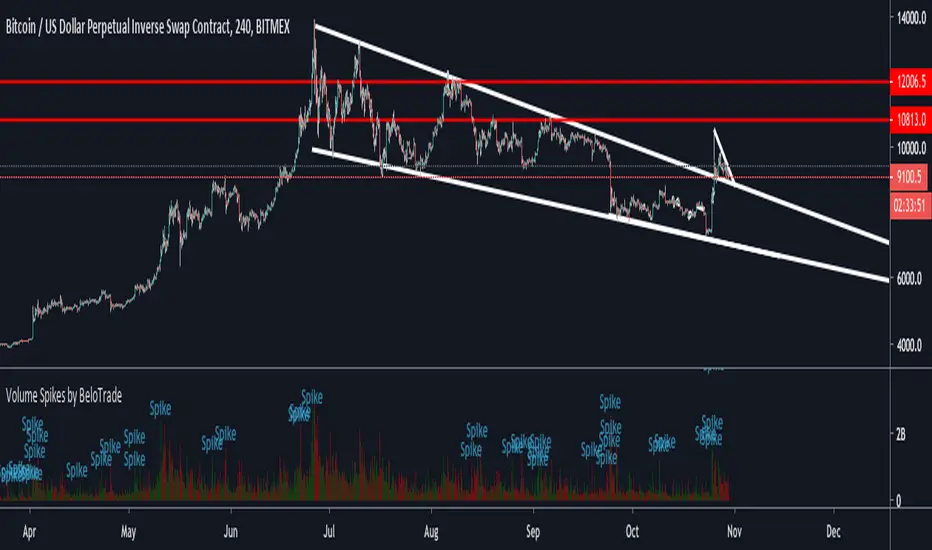
Volume peak visualizerVery simple indicator to show how relatively large a volume is, in comparison to previous volumes. IMHO it's clearer than the default version.

Volume Spikes by BeloTradeBitcoin: 3 Times Bigger / 20 Period
Big Altcoins: 4 Times Bigger / 20 Period
Small Altcoins 5 Times Bigger / 20 Period
Always apply this settings with the price context.