Trend Finder - Buy/Sell (Anuj Edition)Renko Trend Finder – Anuj Edition is a powerful trend-following tool designed to detect market direction using Renko logic instead of traditional candlesticks.
Renko filtering removes market noise, making trends clearer and reversals easier to identify.
This indicator internally builds Renko-style price movement and generates clean, high-quality Buy and Sell signals without repainting.
Wick

DWM HLOC, Mid & WicksSimple, yet effective.
1. Automatically calculate and projects key price levels from a previous period (Yesterday, OR Last Week / Month) onto the current trading session. It acts as an immediate Support & Resistance map based on historical price action.
2. Multi-Timeframe Logic
Modes --
Daily Mode: Projects yesterday's data onto today.
Weekly Mode: Projects last week's data onto the current week.
3. Key Levels Visualized The script calculates seven distinct price levels:
OHLC: Previous Open, High, Low, and Close.
Equilibrium (Mid): The exact 50% mark between the previous High and Low.
Wick Midpoints (New):
Upper Wick 50%: The midpoint between the High and the top of the body.
Lower Wick 50%: The midpoint between the Low and the bottom of the body.
4. Smart "Gap" Visualization The script uses unique starting points to help traders visualize market gaps:
Standard Levels (High, Low, Open, Mids): These lines originate from the Previous Period's Open, showing the full context of the level relative to time.
Close Level: This line originates from the Current Period's Open. This visually highlights the "Gap" (the jump in price between where the market closed previously and where it opened today).
5. Full Customization
Aesthetics: Every line can be individually toggled on/off.
Styling: Users can independently change the color, line style (Solid, Dotted, Dashed), and thickness for every specific level.

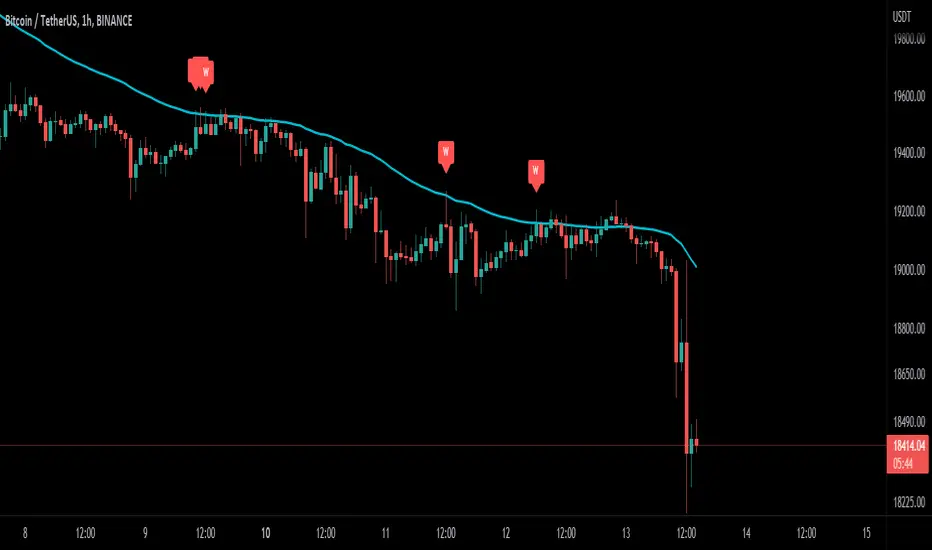
Smart Wick AnalyzerSmart Wick Analyzer (SWA)
Purpose: Highlight potential liquidity‑grab candles (long wicks) and turn them into actionable, rule‑based buy/sell signals with trend, volume, and cooldown filters.
Type: Indicator (not a strategy). Educational tool to contextualize wick events.
🧠 What This Script Does
SWA looks for candles where the wick is large relative to its body—a common signature of liquidity sweeps / rejection. It then adds three confirmations before marking a trade signal:
1. Wick Event
• Upper‑wick event (possible rejection from above)
• Lower‑wick event (possible rejection from below)
• Condition: wick length > body × Wick‑to‑Body Ratio
2. Context Filters
• Trend filter : closing price vs. SMA of lookbackBars
• Volume filter : current volume vs. average volume × volumeThreshold
3. Signal Hygiene
• Cooldown : prevents clustering; a minimum number of bars must pass before a new signal is allowed.
If a candle passes these checks:
• Buy Signal (triangle up): long lower wick + price above SMA + relative‑high volume + cooldown passed
• Sell Signal (triangle down): long upper wick + price below SMA + relative‑high volume + cooldown passed
The signal candle is also bar‑colored black for quick visual focus.
⸻
✳️ What the Dotted Lines Mean (including the green one)
On every signal bar the script draws two dotted horizontal levels, extended to the right:
• Open line of the signal candle
• Close line of the signal candle
• They use the signal color: green for Buy, red for Sell.
How to interpret (example: green = Buy signal):
• The green dotted close line represents the momentum validation level. If subsequent candles close above this line, it indicates follow‑through after the wick rejection (buyers defended into the close).
• The green dotted open line is a risk context / invalidation reference. If price falls back below it soon after the signal, the wick event may have failed or devolved into chop.
In your annotated chart: the candle initially looked constructive (“closing above could be positive momentum”), but later price failed and rotated down—hence a sell signal interpreted when an upper‑wick event occurred under down‑trend conditions.
⸻
⚙️ Inputs & What They Control
• Wick‑to‑Body Ratio (wickThreshold): how “extreme” a wick must be to count as a liquidity‑grab.
• Lookback Period (lookbackBars):
• SMA period for trend context
• Volume MA for relative‑volume check
• Volume Multiplier (volumeThreshold): strengthens/loosens volume confirmation.
• Cooldown Bars (cooldownBars): minimum spacing between consecutive signals.
• Enable Alerts (showAlerts): turns on alert conditions.
⸻
🔔 Alerts (exact titles)
• “SWA Buy Alert” — potential reversal / Buy signal detected
• “SWA Sell Alert” — potential reversal / Sell signal detected
⸻
📌 How to Use (practical guide)
1. Scan for the black‑colored signal candle and its dotted lines.
2. For Buy signals (green): Prefer continuation if price closes above the green close line within the next few bars. Manage risk using the open line or your own level.
3. For Sell signals (red): Prefer continuation if price closes below the red close line.
4. Avoid chasing during low‑volume / counter‑trend signals; the filters help, but structure (HTF trend, S/R, session context) still matters.
5. Use the cooldown to reduce noise on fast time frames.
⸻
✅ Why This Isn’t Just “Another Wick Indicator”
• The script does not flag every long‑wick; it requires trend alignment and relative volume to suggest participation.
• The two reference lines (open/close) provide post‑signal state tracking—a simple, visual framework to judge follow‑through vs. failure without additional tools.
• Cooldown logic discourages clustered, low‑quality repeats around the same zone.
⸻
⚠️ Notes & Limitations
• Works across markets/time frames, but wick behavior varies by instrument and session. Parameters may need adjustment.
• Signals are contextual, not guarantees. Consolidation and news spikes can invalidate wick reads.
• This indicator is not a strategy; it does not backtest performance on its own.
⸻
📄 Disclaimer
This tool is for educational purposes only and should be combined with personal analysis and risk management. Markets are uncertain; past behavior does not guarantee future results.

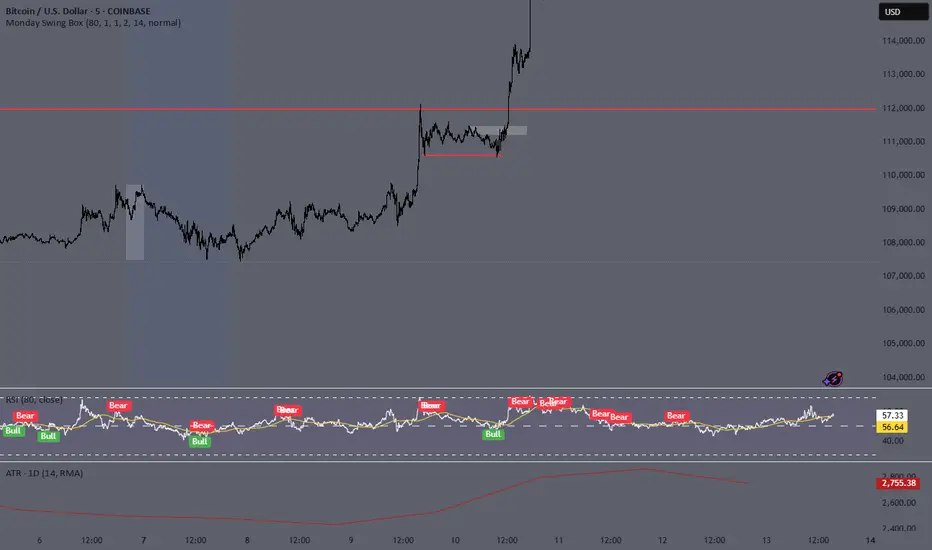
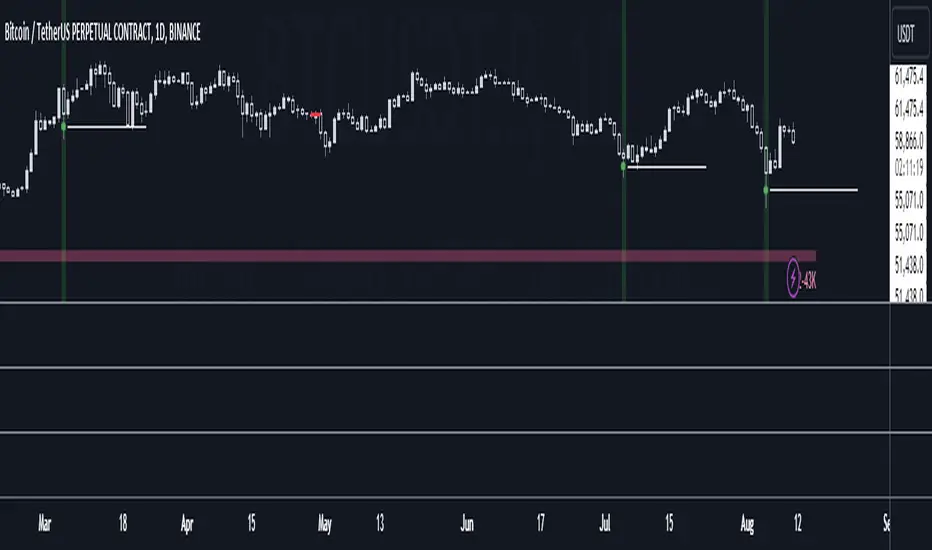
Monday Swing Box# Monday Swing Box Indicator - Trading Applications
This "Monday Swing Box" indicator can be very useful in trading for several strategic reasons:
## 1. **"Monday Effect" Analysis**
* **Concept**: Mondays often have particular characteristics in the markets (opening gaps, weekend catch-up, different volumes)
* **Utility**: Allows visualization and quantification of these Monday-specific movements
* **Application**: Helps identify recurring patterns in your strategy
## 2. **Relative Volatility Measurement with ATR**
* **The ATR percentage tells you**:
* **< 50%**: Low volatility Monday (possible consolidation)
* **50-100%**: Normal volatility
* **> 100%**: Very volatile Monday (important event, potential breakout)
* **Advantage**: Contextualizes the movement relative to historical volatility
## 3. **Practical Trading Applications**
### **For Day Trading**:
* **Entry**: A Monday with >150% ATR may signal a strong movement to follow
* **Stop Loss**: Adjust stop sizes according to Monday's volatility
* **Targets**: Calibrate targets according to the movement's magnitude
### **For Swing Trading**:
* **Support/Resistance**: Monday's high/low often become key levels
* **Breakout**: Breaking above/below Monday's box may signal continuation
* **Retracement**: Return to Monday's box = support/resistance zone
### **For Risk Management**:
* **Sizing**: Adapt position sizes according to measured volatility
* **Timing**: Avoid trading abnormally volatile Mondays if you prefer stability
## 4. **Specific Possible Strategies**
### **"Monday Breakout"**:
* Wait for a break above/below Monday's box
* Enter in the direction of the breakout
* Stop at the other end of the box
### **"Monday Reversal"**:
* If Monday shows >200% ATR, look for a reversal
* The box becomes a resistance/support zone
### **"Monday Range"**:
* Trade bounces off the box limits
* Particularly effective if ATR % is normal (50-100%)
## 5. **Visualization Advantages**
* **Historical**: See past patterns across multiple Mondays
* **Comparison**: Compare current volatility to previous Mondays
* **Anticipation**: Prepare your strategy according to the type of Monday observed
## 6. **Limitations to Consider**
* Monday patterns can vary according to markets and periods
* Don't trade solely on this indicator, but use it as a complement
* Consider macroeconomic context and news
This indicator is therefore particularly useful for traders who want to exploit Monday's specificities and have an objective measure of this day's relative volatility compared to normal market conditions.
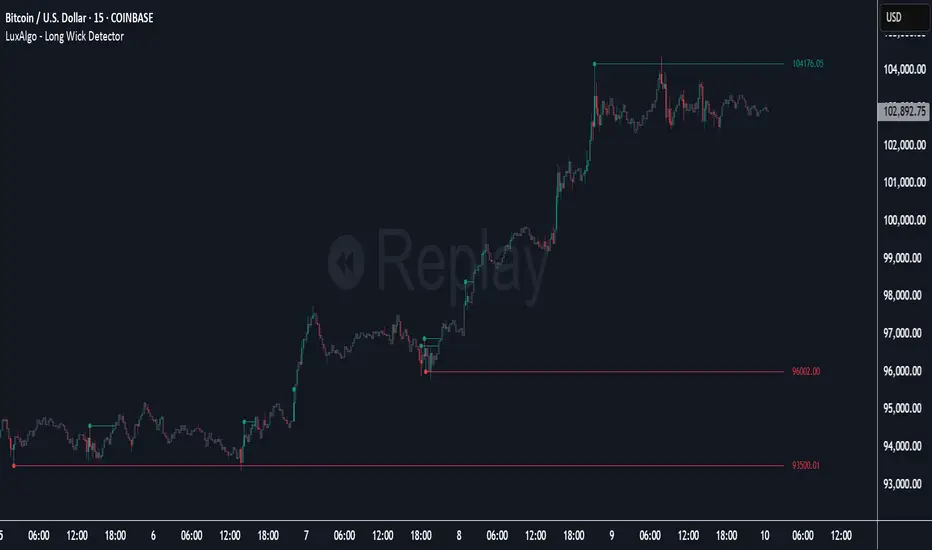
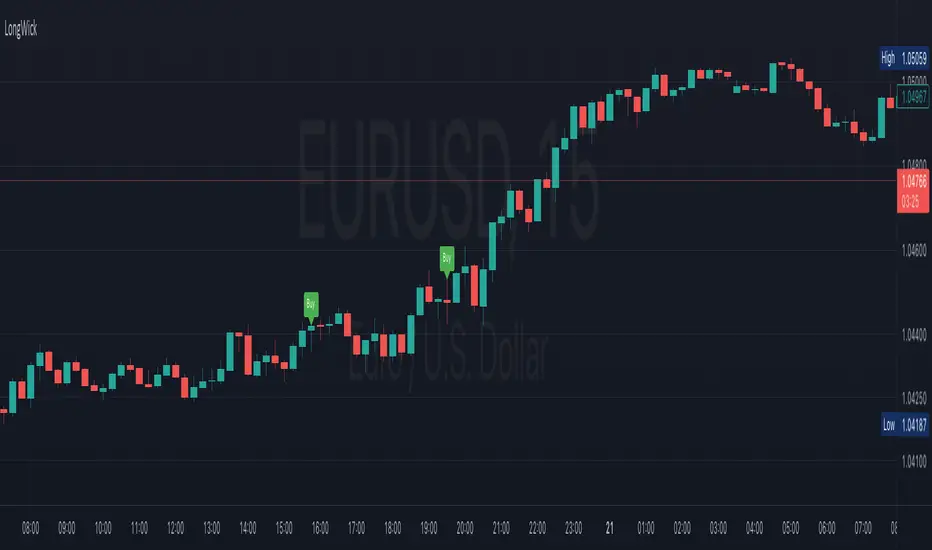
Long Wick Detector [LuxAlgo]The Long Wick Detector tool allows traders to identify candle wicks longer than a user-defined volatility threshold. This makes it useful for spotting zones with high supply or demand.
The tool displays mitigated and unmitigated levels and changes the color of the candles based on wick size and level breakouts.
🔶 USAGE
By default, the tool displays long mitigated and unmitigated candle wicks, with a maximum duration for an unmitigated long wick of 1,000 bars. What does all this mean?
🔹 Wick Threshold
Traders can adjust the volatility threshold to identify long wicks, with a higher threshold detecting more significant wicks.
As we can see in the image above, the tool detects more wicks with a smaller threshold compared to a higher one.
🔹 Level %
Traders can choose the percentage of the wick at which the level is located. By default, the level is displayed at the extremes of the wick. This parameter accepts values between 0 and 100.
100: extreme of the wick
50: middle of the wick
0: start of the wick
🔹 Max Duration
This parameter allows traders to specify the number of bars for the levels. The tool will only display mitigated or unmitigated levels up to the specified number of bars.
As shown in the above image, a longer duration allows more room for mitigation, displaying more levels.
🔹 Colored Candles
The tool allows for color customization using two parameters from the settings panel. The chart shows the different outputs.
The setting "Wick-Based Transparency" makes candles with smaller wicks less visible and candles with longer wicks more visible.
On the other hand, "Breakout-Based Color" changes the base color of the candles based on the mitigation of long wicks. When the price breaks above a detected top wick, the bullish color is used. When the price breaks below a detected bottom wick, the bearish color is used.
🔶 SETTINGS
Wick Threshold: The volatility threshold for wick detection. Use a smaller value to detect smaller wicks.
Level %: Placement of the plotted level relative to the wick.
Max Duration: The maximum duration in bars of mitigated wicks.
Mitigated Wicks: Enable or disable mitigated wicks.
🔹 Style
Wick Based Transparency: Make candles with smaller wicks more transparent and candles with longer wicks more solid.
Breakout Based Color: Change the base color based on wick mitigation.
Bullish & Bearish Colors
Levels by Touches (v2) [chingybrooks]Levels by Touches (v2)
This script scans the last N bars to identify significant support and resistance levels by counting wick-touches.
How it works:
1. Wick detection – marks a touch whenever upper or lower wick ≥ X% of candle body (or on doji)
2. Level grouping – merges touches within a tolerance of Y ticks
3. Touch weighting – recent touches (in the latter half of lookback) count Z× more
4. Filtering – only plots levels with ≥ M total touches
Inputs:
Bars to scan (N): lookback period (max 200 bars)
Min touches (M): minimum hits to qualify as a level
Tolerance (ticks): price “slop” for grouping nearby touches
Min wick %: wick size threshold as % of body
Recent touch weight (Z): multiplier for touches in the latest half
Use this indicator to spot high-probability S/R zones based on actual price rejections.

BBr1 Candle Range Volitility Gap IndicatorModified Candle Range Volatility Gap Indicator
1. Useful to analyze bars body and wicks and volatility of security.
2. Added a Percentage Option - easier to analyze across different securities.
2. Added a Standard Deviation ("1 std dev= 68.2%, 2 std dev=95.4%, 3 std dev=99.7%, etc") based upon user defined lookback period.
3. Added the ability to include Gaps in Analysis. (Gaps are when the prior closing cost does not equal opening price)
4. Possible Uses setting up stop losses, trailing entries/exits (inside range or outside range).
5. Use it with other indicators in determining if to make an entry or close entry.
Reposted Original Description by © ka66 Kamal Advani
Visually shows the Body Range (open to close) and Candle Range (high to low).
Semi-transparent overlapping area is the full Candle Range, and fully-opaque smaller area is the Body Range. For aesthetics and visual consistency, Candle Range follows the direction of the Body Range, even though technically it's always positive (high - low).
The different plots for each range type also means the UI will allow deselecting one or the other as needed. For example, some strategies may care only about the Body Range, rather than the entire Candle Range, so the latter can be hidden to reduce noise.
Threshold horizontal lines are plotted, so the trader can modify these high and low levels as needed through the user interface. These need to be configured to match the instrument's price range levels for the timeframe. The defaults are pretty arbitrary for +/- 0.0080 (80 pips in a 4-decimal place forex pair). Where a range reaches or exceeds a threshold, it's visually marked as well with a shape at the Body or Candle peak, to assist with quicker visual potential setup scanning, for example, to anticipate a following reversal or continuation.

Wick Order IndicatorThe script tells you what formed first in the wick, the high or the low.
If the high formed first, the upper wick would be labeled 1 and lower wick would be labeled 2.
If the low formed first, the lower wick would be labeled 1 and higher wick would be labeled 2.
If there's only one wick or no wicks, there would be no labels.

Bearish Wick Reversal█ STRATEGY OVERVIEW
The "Bearish Wick Reversal Strategy" identifies potential bullish reversals following significant bearish price rejection (long lower wicks). This counter-trend approach enters long positions when bearish candles show exaggerated downside wicks relative to closing prices, then exits on bullish confirmation signals. Includes optional EMA trend filtering for improved reliability.
█ What is a Bearish Wick?
A price rejection pattern where:
Bearish candle (close < open) forms with extended lower wick
Wick represents failed selloff: Low drops significantly below close
Measured as: (Low - Close)/Close × 100 (Negative percentage indicates downward extension)
█ SIGNAL GENERATION
1. LONG ENTRY CONDITION
Bearish candle forms with close < open
Lower wick exceeds user-defined threshold (Default: -1% of close price)
The signal occurs within the specified time window
If enabled, the close price must also be above the 200-period EMA (Exponential Moving Average)
2. EXIT CONDITION
A Sell Signal is generated when the current closing price exceeds the highest high of the previous seven bars (`close > _highest `). This indicates that the price has shown strength, potentially confirming the reversal and prompting the strategy to exit the position.
█ PERFORMANCE OVERVIEW
Ideal Market: Volatile instruments with frequent price rejections
Key Risk: False signals in sustained bearish trends
Optimization Tip: Test various thresholds
Filter Impact: EMA reduces trades but improves win rate and reduces drawdown

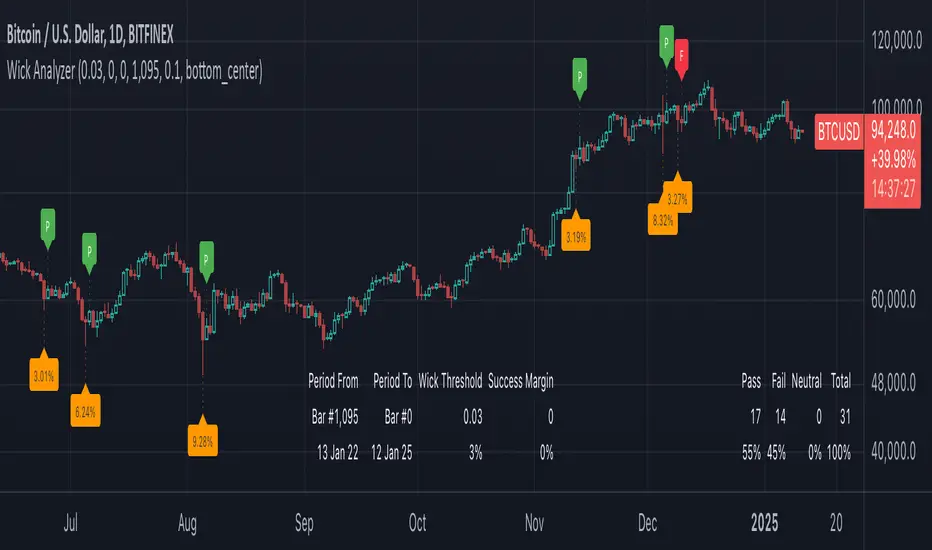
Wick Strategy AnalyzerOverview
This indicator analyzes candle wick patterns and evaluates their outcomes over a user-definable range (default is 1 year). Labels are rendered on the chart to mark events that meet the specified wick condition.
Features
Customizable Bar Range - users can specify the range of bars to include in the analysis. Default is 365 bars back from the most recent bar (bar 0)
Visual Indicators - labels are rendered to mark conditions & outcomes.
Wick Condition Met - an Orange label below the wick candle displaying the wick’s percentage size.
Outcome Labels - rendered above the candle after wick condition met candles
P (Green): Pass
F (Red): Fail
N (Navy): Neutral
I (Blue): Indicates the current candle has not yet closed, so the outcome is undetermined.
Input Parameters
Wick Threshold - minimum wick size required to qualify as a wick condition.
Success Margin - Defines the margin for classifying outcomes as Pass, Fail, or Neutral. E.g., a success margin of 0.01 requires the next candle's close to exceed the wick candle's close by 1% in order to be a Pass.
Bar Offset Start - starting offset from the last bar for analysis. A value of -1 will include all bars.
Bar Offset End - ending offset from the last bar for analysis. Bars outside this range are excluded.
Example Scenario
Goal: Analyze how candles with a wick size of at least 3.5% perform within a success margin of 1% over the past 540 days.
Setup:
Set Wick Threshold to 0.035
Set Success Margin to 0.01
Set Bar Range Start to 0
Set Bar Range End to 540.
Expected Output
Candles with a wick of at least 3.5% are labeled.
Outcome labels (P, F, or N) indicate performance.
LibyanSatoshi Wick FillThis is an indicator for wick fill strategy, It is an approach that focuses on the movement of price back into the 50% of a previous candle's wick. Here's an overview of this strategy:
The strategy is based on the idea that price often retraces to fill gaps or wicks left by strong moves in the market.
It particularly looks at candles with long wicks, which represent areas where price moved significantly but then reversed.
Long Wick Candles : These are candles where the wick (upper or lower shadow) is significantly longer than the body.
Trading Approach:
Entry: Traders enter a position when price starts moving back into the wick of a previous candle.
Stop Loss: Often placed beyond the end of the wick being filled.
Take Profit: Can be set at the opposite end of the candle whose wick is being filled, or at other significant levels.
Confluence:
Most effective when combined with other technical analysis tools or when the wick coincides with significant support/resistance levels.
Risks:
Not all wicks get filled, and price can reverse before reaching the full extent of the wick.
False signals can occur in choppy or ranging markets.
Benefits:
Provides clear entry and exit points.
Can be an effective way to enter trends or identify potential reversals.
Considerations:
Market sentiment is crucial; wick fills may have different implications in trending vs. ranging markets.
The size of the wick and the time frame it appears on can affect the reliability of the signal.
While the wick fill strategy can be a useful tool in a trader's arsenal, it's important to use it in conjunction with other forms of analysis and proper risk management. As with any trading strategy, it's not foolproof and requires practice and discretion to use effectively.
ATR Bands (Keltner Channel), Wick and SRSI Signals [MW]Introduction
This indicator uses a novel combination of ATR Bands, candle wicks crossing the ATR upper and lower bands, and baseline, and combines them with the Stochastic SRSI oscillator to provide early BUY and SELL signals in uptrends, downtrends, and in ranging price conditions.
How it’s unique
People generally understand Bollinger Bands and Keltner Channels. Buy at the bottom band, sell at the top band. However, because the bands themselves are not static, impulsive moves can render them useless. People also generally understand wicks. Candles with large wicks can represent a change in pattern, or volatile price movement. Combining those two to determine if price is reaching a pivot point is relatively novel. When Stochastic RSI (SRSI) filtering is also added, it becomes a genuinely unique combination that can be used to determine trade entries and exits.
What’s the benefit
The benefit of the indicator is that it can help potentially identify pivots WHEN THEY HAPPEN, and with potentially minimal retracement, depending on the trader’s time window. Many indicators wait for a trend to be established, or wait for a breakout to occur, or have to wait for some form of confirmation. In the interpretation used by this indicator, bands, wicks, and SRSI cycles provide both the signal and confirmation.
It takes into account 3 elements:
Price approaching the upper or lower band or the baseline - MEANING: Price is becoming extended based on calculations that use the candle trading range.
A candle wick of a defined proportion (e.g. wick is 1/2 the size of a full candle OR candle body) crosses a band or baseline, but the body does not cross the band or baseline - MEANING: Buyers and sellers are both very active.
The Stochastic RSI reading is above 80 for SELL signals and below 20 for BUY signals - MEANING: Additional confirmation that price is becoming extended based on the current cyclic price pattern.
How to Use
SIGNALS
Buy Signals - Green(ish):
B Signal - Potential pivot up from the lower band when using the preferred multiplier
B1 Signal - Potential pivot up from the lower band when using phi * multiplier
B2 Signal - Potential pivot up from the lower band when using 1/2 * multiplier
B3 Signal - Potential pivot up from baseline
Sell Signals - Red(ish):
S Signal - Potential pivot down from the upper band when using the preferred multiplier
S1 Signal - Potential pivot down from the upper band when using
S2 Signal - Potential pivot down from the upper band when using 1/2 * multiplier
S3 Signal - Potential pivot down from the baseline
DISCUSSION
During an uptrend or downtrend, signals from the baseline can help traders identify areas where they may enter the trending move with the least amount of drawdown. In both cases, entry points can occur with baseline signals in the direction of the trend.
For example, in an uptrend (when the price is forming higher highs and higher lows, or when the baseline is rising), price tends to oscillate between the upper band and baseline. In this case, the baseline BUY signal (B3) can show an entry point.
In a downtrend (when the price is forming lower highs and lower lows, or when the baseline is falling), price tends to oscillate between the baseline and the lower band. In this case, the baseline SELL signal (S3) can show an entry point.
During consolidation, when price is ranging, price tends to oscillate between the upper and lower bands, while crossing through the baseline unperturbed. Here, entry points can occur at the upper and lower bands.
When all conditions are met at the lower band during consolidation, a BUY signal (B), can occur. This signal may also occur prior to a break out of consolidation to the upside.
When all conditions are met at the upper band during consolidation, a SELL signal (S), can occur. This signal may also occur prior to a break out of consolidation to the downside.
Additional B1, B2, and S1, and S2 signals can be displayed that use the bands based on a multiplier that is half that of the primary one, and phi (0.618) times the primary multiplier as a way to quickly check for signals occurring along different, but related, bands.
Calculations
ATR Bands, or Keltner Channels, are a technical analysis tool that are used to measure market volatility and identify overbought or oversold conditions in the trading of financial instruments, such as stocks, bonds, commodities, and currencies. ATR Bands consist of three lines plotted on a price chart:
Middle Band, Basis, or Baseline: This is typically a simple moving average (SMA) of the closing prices over a certain period. It represents the intermediate-term trend of the asset's price.
Upper Band: This is calculated by adding a certain number of ATRs to the middle band (SMA). The upper band adjusts itself with the increase in volatility.
Lower Band: This is calculated by subtracting the same number of ATRs from the middle band (SMA). Like the upper band, the lower band adjusts to changes in volatility.
The candle wick signals occur if the wick is at the specified ratio compared to either the entire candle or the candle body. The upper band, lower band, and baseline signals happen if the wick is the specified ratio of the total candle size. For the major signals for upper and lower bands, these occur when the wick extends outside of the bands while closing a candle inside of the bands. For the baseline signals, they occur if a wick crosses a baseline but closes on the other side.
Settings
CHANNEL SETTINGS
Baseline EMA Period (Default: 21): Period length of the moving average basis line.
ATR Period (Default: 21): The number of periods over which the Average True Range (ATR) is calculated.
Basis MA Type (Default: SMA): The moving average type for the basis line.
Multiplier (Default: 2.5: The deviation multiplier used to calculate the band distance from the basis line.
ADDITIONAL CHANNELS
Half of Multiplier Offset (Default: True): Toggles the display of the ATR bands that are set a distance of half of the ATR multiplier.
Quarter of Multiplier Offset (Default: false): Toggles the display of the ATR bands that are set a distance of one quarter of the ATR multiplier.
Phi (Φ) Offset (Default: false): Toggles the display of the ATR bands that are set a distance of phi (Φ) times the ATR multiplier.
WICK SETTINGS FOR CANDLE FILTERS
Wick Ratio for Bands (Default: 0.4): The ratio of wick size to total candle size for use at upper and lower bands.
Wick Ratio for Baseline (Default: 0.4): The ratio of wick size to total candle size for use at baseline.
Use Candle Body (rather than full candle size) (Default: false): Determines whether wick calculations use the candle body or the entire candle size.
VISUAL PREFERENCES - SIGNALS
Show Signals (Default: true): Allows signal labels to be shown.
Show Signals from 1/2 Band Offset (Default: false): Toggle signals originating from 1/2 offset upper and lower bands.
Show Signals from Phi (Φ) Band Offset (Default: false): Toggle signals originating from phi (Φ) offset upper and lower bands.
Show Baseline Signals (Default: false): Toggle Baseline signals.
VISUAL PREFERENCES - BANDS
Show ATR (Keltner) Bands (Default: true): Use a background color inside the Bollinger Bands.
Fill Bands (Default: true): Use a background color inside the Bollinger Bands.
STOCHASTIC SETTINGS
Use Stochastic RSI Filtering (Default: False): This will only trigger some SELL signals when the stochastic RSI is above 80, and BUY signals when below 20.
K (Default: 3): The smoothing level for the Stochastic RSI.
RSI Length (Default: 14): The period length for the RSI calculation.
Stochastic Length (Default: 8): The period length over which the stochastic calculation is performed.
Other Usage Notes and Limitations
To understand future price movement, this indicator assumes that 3 things must be known:
Evidence of a change of market structure. This can be demonstrated by increased volatility, consolidation, volume spikes (which can be tracked with the MW Volume Impulse Indicator) or, in the case of this indicator, candle wicks.
The potential cause of the change. It could be a VWAP line (which can be tracked with the Multi VWAP , and Multi VWAP from Gaps indicators), an event, an important support or resistance level, a key moving average, or many other things. This indicator assumes the ATR bands can be a cause.
The current position in the price cycle. Oscillators like the RSI, and MACD, are typical measures of price oscillation (other oscillators like the Price and Volume Stochastic Divergence indicator can also be useful). This indicator uses the Stochastic RSI oscillator to determine overbought and oversold conditions.
When evidence of the change appears, and the potential cause of the change is identified, and the price oscillation is at a favorable position for the desired trading direction, this indicator will generate a signal.
ATR Bands (or Keltner Channels) are used to determine when price might “revert to the mean”. Crossing, or being near the upper or lower band, can indicate an overbought or oversold condition, which could lead to a price reversal. By tracking the behavior of candle wicks during these events, we can see how active the battle is between buyers and sellers.
If the top of a wick is large, it may indicate that sellers are aggressively attempting to bring the price down. Conversely, if the bottom wick is large, it can indicate that buyers are actively trying to counter the price action caused by selling pressure.
When this wicking action occurs at times when price is not near the upper band, lower band, or baseline, it could indicate the presence of an important level. That could mean a nearby VWAP line, a supply or demand zone, a round price number, or a number of other factors. In any case, this wick may be the first indication of a price reversal.
Shorter baseline periods may be better for short period trading like scalping or day trading, while longer period baselines can show signals that are better suited to swing trading, or longer term investing.
It's important for traders to be aware of the limitations of any indicator and to use them as part of a broader, well-rounded trading strategy that includes risk management, fundamental analysis, and other tools that can help with reducing false signals, determining trend direction, and providing additional confirmation for a trade decision. Diversifying strategies and not relying solely on one type of indicator or analysis can help mitigate some of these risks.
The TradingView platform allows a maximum of 500 labels per chart. This means that if your settings allow for a lot of signals, labels for earlier ones may not appear if the total number of labels exceeds 500 for the chart.

Bollinger Band Wick and SRSI Signals [MW]Introduction
This indicator uses a novel combination of Bollinger Bands, candle wicks crossing the upper and lower Bollinger Bands and baseline, and combines them with the Stochastic SRSI oscillator to provide early BUY and SELL signals in uptrends, downtrends, and in ranging price conditions.
How it’s unique
People generally understand Bollinger Bands and Keltner Channels. Buy at the bottom band, sell at the top band. However, because the bands themselves are not static, impulsive moves can render them useless. People also generally understand wicks. Candles with large wicks can represent a change in pattern, or volatile price movement. Combining those two to determine if price is reaching a pivot point is relatively novel. When Stochastic RSI (SRSI) filtering is also added, it becomes a genuinely unique combination that can be used to determine trade entries and exits.
What’s the benefit
The benefit of the indicator is that it can help potentially identify pivots WHEN THEY HAPPEN, and with potentially minimal retracement, depending on the trader’s time window. Many indicators wait for a trend to be established, or wait for a breakout to occur, or have to wait for some form of confirmation. In the interpretation used by this indicator, bands, wicks, and SRSI cycles provide both the signal and confirmation.
It takes into account 3 elements:
Price approaching the upper or lower band or the baseline - MEANING: Price is becoming extended based on calculations that use the candle trading range.
A candle wick of a defined proportion (e.g. wick is 1/2 the size of a full candle OR candle body) crosses a band or baseline, but the body does not cross the band or baseline - MEANING: Buyers and sellers are both very active.
The Stochastic RSI reading is above 80 for SELL signals and below 20 for BUY signals - MEANING: Additional confirmation that price is becoming extended based on the current cyclic price pattern.
How to Use
SIGNALS
Buy Signals - Green(ish):
B Signal - Potential pivot up from the lower band when using the preferred multiplier
B1 Signal - Potential pivot up from baseline
Sell Signals - Red(ish):
S Signal - Potential pivot down from the upper band when using the preferred multiplier
S1 Signal - Potential pivot down from the baseline
DISCUSSION
During an uptrend or downtrend, signals from the baseline can help traders identify areas where they may enter the trending move with the least amount of drawdown. In both cases, entry points can occur with baseline signals in the direction of the trend.
For example, in an uptrend (when the price is forming higher highs and higher lows, or when the baseline is rising), price tends to oscillate between the upper band and baseline. In this case, the baseline BUY signal (B3) can show an entry point.
In a downtrend (when the price is forming lower highs and lower lows, or when the baseline is falling), price tends to oscillate between the baseline and the lower band. In this case, the baseline SELL signal (S3) can show an entry point.
During consolidation, when price is ranging, price tends to oscillate between the upper and lower bands, while crossing through the baseline unperturbed. Here, entry points can occur at the upper and lower bands.
When all conditions are met at the lower band during consolidation, a BUY signal (B), can occur. This signal may also occur prior to a break out of consolidation to the upside.
When all conditions are met at the upper band during consolidation, a SELL signal (S), can occur. This signal may also occur prior to a break out of consolidation to the downside.
Additional, B1 and S1 signals can be displayed that use the baseline as the pivot level.
Settings
SIGNALS
Show Bollinger Band Signals (Default: True): Allows signal labels to be shown.
Hide Baseline Signals (Default: False): Baseline signals are on by default. This will turn them off.
Show Wick Signals (Defau
lt: True): Displays signals when wicking occurs.
BOLLINGER BAND SETTINGS
Period length for Bollinger Band Basis (Default: 21): Length of the Bollinger Band (BB) moving average basis line.
Basis MA Type (Default: SMA): The moving average type for the BB Basis line.
Source (Default: “close”): The source of time series data.
Standard Deviation Multiplier (Default: 2.5: The deviation multiplier used to calculate the band distance from the basis line.
WICK SETTINGS FOR BOLLINGER BANDS
Wick Ratio for Bands (Default: 0.3): The ratio of wick size to total candle size for use at upper and lower bands.
Wick Ratio for Baseline (Default: 0.3): The ratio of wick size to total candle size for use at baseline.
WICK SETTINGS FOR CANDLE SIGNALS
Upper Wick Threshold (Default: 50): The percent of upper wick compared to the full candle size or candle body size.
Lower Wick Threshold (Default: 50): The percent of lower wick compared to the full candle size or candle body size.
Use Candle Body (Default: false): Toggles the use of the full candle size versus the candle body size when calculating the wick signal.
VISUAL PREFERENCES
Fill Bands (Default: true): Use a background color inside the Bollinger Bands.
Show Signals (Default: true): Toggle the Bollinger Band upper band, lower band, and baseline signals.
Show Bollinger Bands (Default: true): Show the Bollinger Bands.
STOCHASTIC SETTINGS
Use Stochastic RSI Filtering (Default: False): This will only trigger some SELL signals when the stochastic RSI is above 80, and BUY signals when below 20.
K (Default: 3): The smoothing level for the Stochastic RSI.
RSI Length (Default: 14): The period length for the RSI calculation.
Stochastic Length (Default: 8): The period length over which the stochastic calculation is performed.
Calculations
Bollinger Bands are a technical analysis tool that are used to measure market volatility and identify overbought or oversold conditions in the trading of financial instruments, such as stocks, bonds, commodities, and currencies. Bollinger Bands consist of three lines plotted on a price chart:
Middle Band, Basis, or Baseline: This is typically a simple moving average (SMA) of the closing prices over a certain period. It represents the intermediate-term trend of the asset's price.
Upper Band: This is calculated by adding a certain number of standard deviations to the middle band (SMA). The upper band adjusts itself with the increase in volatility.
Lower Band: This is calculated by subtracting the same number of standard deviations from the middle band (SMA). Like the upper band, the lower band adjusts to changes in volatility.
The candle wick signals occur if the wick is at the specified ratio compared to either the entire candle or the candle body. The upper band, lower band, and baseline signals happen if the wick is the specified ratio of the total candle size. For the major signals for upper and lower bands, these occur when the wick extends outside of the bands while closing a candle inside of the bands. For the baseline signals, they occur if a wick crosses a baseline but closes on the other side.
Other Usage Notes and Limitations
To understand future price movement, this indicator assumes that 3 things must be known:
Evidence of a change of market structure. This can be demonstrated by increased volatility, consolidation, volume spikes (which can be tracked with the MW Volume Impulse Indicator) or, in the case of this indicator, candle wicks.
The potential cause of the change. It could be a VWAP line (which can be tracked with the Multi VWAP , and Multi VWAP from Gaps indicators), an event, an important support or resistance level, a key moving average, or many other things. This indicator assumes the ATR bands can be a cause.
The current position in the price cycle. Oscillators like the RSI, and MACD, are typical measures of price oscillation (other oscillators like the Price and Volume Stochastic Divergence indicator can also be useful). This indicator uses the Stochastic RSI oscillator to determine overbought and oversold conditions.
When evidence of the change appears, and the potential cause of the change is identified, and the price oscillation is at a favorable position for the desired trading direction, this indicator will generate a signal.
ATR Bands (or Keltner Channels) are used to determine when price might “revert to the mean”. Crossing, or being near the upper or lower band, can indicate an overbought or oversold condition, which could lead to a price reversal. By tracking the behavior of candle wicks during these events, we can see how active the battle is between buyers and sellers.
If the top of a wick is large, it may indicate that sellers are aggressively attempting to bring the price down. Conversely, if the bottom wick is large, it can indicate that buyers are actively trying to counter the price action caused by selling pressure.
When this wicking action occurs at times when price is not near the upper band, lower band, or baseline, it could indicate the presence of an important level. That could mean a nearby VWAP line, a supply or demand zone, a round price number, or a number of other factors. In any case, this wick may be the first indication of a price reversal.
Shorter baseline periods may be better for short period trading like scalping or day trading, while longer period baselines can show signals that are better suited to swing trading, or longer term investing.
It's important for traders to be aware of the limitations of any indicator and to use them as part of a broader, well-rounded trading strategy that includes risk management, fundamental analysis, and other tools that can help with reducing false signals, determining trend direction, and providing additional confirmation for a trade decision. Diversifying strategies and not relying solely on one type of indicator or analysis can help mitigate some of these risks.
The TradingView platform allows a maximum of 500 labels per chart. This means that if your settings allow for a lot of signals, labels for earlier ones may not appear if the total number of labels exceeds 500 for the chart.

Stophunt WickAcknowledgement
This indicator is dedicated to my friend Alexandru who saved me from one of these liquidation raids which almost liquidated me.
Alexandru is one of the best scalpers out there and he always nails his entries at the tip of these wicks.
This inspired me to create this indicator.
What's a Liquidation Wick?
It's that fast stop-hunting wick that stophunts everyone by triggering their stop-loss and liquidation.
Liquidity is the lifeblood of stock market and liquidation is the process that moves price.
This indicator will identify when a liquidity pool is getting raided to trigger buy or sell stops, they are also know as stop-hunts.
How does it work?
When market consolidates in one direction, it builds up liquidity zones.
Market maker will break out of these consolidation phases by having dramatic price action to either pump or dump to raid these liquidity zones.
This is also called stop-hunts or liquidity raids. After that it will start reversing back to the opposite direction.
This is most noticeable by the length of the wick of a given candle in a very short amount of time and the total size of the candle.
This indicator highlights them accordingly.
Settings
Wick and Candle ratio works with default values but finetune will enhance user experience and usability.
Wick Ratio: Size of the wick compared to body of a candle.
Adjust this to higher ratio on smaller timeframe or smaller ratio on bigger timeframe to your trading style to spot a trend reversal.
Candle Ratio: The size of the candle, by default it is 0.75% of the current price.
For example, if BTC is at 20,000 then the size of the candle has to be minimum 150.
This can be fine tuned to bigger candle size on higher time frames or smaller for shorter timeframe depending on the trade type.
How to use it?
This indicator will identify when a liquidity pool is getting raided to trigger buy or sell stops, they are also know as stop-hunts. It can be used of its own for scalping but there are also a good few indicators which would most definitely help to confluence bigger timeframe trades.
Scalp
This indicator shows the most chaotic moments in price action; therefore it works best on smaller timeframes, ideally 3 or 5 minute candle.
- Wait for the market to start pumping or dumping.
- Current candle will change colour (Bullish/Bearish).
- Enter trade as soon as price starts to reverse back.
- Place the stop-loss outside of the current candle.
- Wait for the Liquidation Wick to appear as confirmation.
Price is very chaotic during a liquidity stop-hunt raid but there is a saying:
"In the midst of chaos, there is also opportunity" - Sun-Tzu
Since this is a very high risk, high reward strategy; it is advised to practice on paper trade first.
Practice until perfection and this indicator would be the perfect bread and butter scalp confirmation.
Fair Value Gap
FVG strategy is the most accurate in conjunction with this indicator.
Normally price would reverse after consuming fair value gaps but often it's difficult to know when and where.
This indicator would identify those crucial entry points for reverse course direction of the price action.
Support and Resistance
This indicator can also be used in conjunction with support and resistance lines.
Generally the stophunt will go deep below the support or spike much further up the resistance lines to liquidate positions.
Bollinger Bands
Bolling Bands strategy would be to wait until the price breaks out of the band.
Once the wick is formed, it would be an ideal entry point.
Script change
This is an open-source script and feel free to modify according to your need and to amplify your existing strategy.

Wick Hunter MVWAP & RSIWick Hunter MVWAP & RSI to be used to produce quality reversal entries based on VWAP with added RSI Filtering.
The MVWAP allows our traders to utilize different timeframes in combination, and send alerts directly to Wick Hunter via the any alert function.
Wick Connect MVWAP & RSI was designed specifically to work with Wick Hunter, the lightning fast cryptocurrency trading robot that can trade for you 24/7. Simply input your UUID and start trading automatically with Wick Hunter!
Added additional logic for VWAP crosses, alert conditions and table for visualization which can be helpful to backtest VWAPS and plot current distance away from VWAP settings, in percent.
The VWAP is accurate across all timeframes and will show multiple VWAP Values (3 timeframes each with separate long and short VWAP values).
Default values of 1/5/15 Minute, 5 Period with "SAFE" VWAP Values for new users. Recommended for users to always plot and backtest VWAP Settings manually before running any alerts or active configurations.
Added alert condition on Short/Long crossing for each timeframe which can be fired to trigger trades to Wick Hunter.
Alerts are now fired using crossabove and crossbelow logic which avoids fake signals. Previous script versions would fire signals anytime above/below VWAP resulting in bagged trades. With the new crossing condition we are sure that the previous candle price was below/above the vwap and then price crossed on the current candle to fire the alert.
Alerts also now require a reset, meaning that the price must move above/below the VWAP after firing an alert to retrigger an alert. This will reduce entries however improve entry quality.
Alert repainting was improved as well, however you may still see alerts fire and repaint over. Generally speaking if price goes close to the Long or Short VWAP - expect a signal to fire if using once per bar.
Alerts will fire as soon as price crosses the VWAP Line if using "Once per bar", and may disappear after.
Alerts shown on the chart are confirmed via candle close, and as such, "Once per bar close" should be used if the user wants to only trade confirmed signals shown on the chart.
"Distance from VWAP Settings" table is now plotted across all timeframes which will allow users to see an accurate distance from their current VWAP Settings.
For instance if you are on the 1 Minute timeframe with a long VWAP of 1% the table will plot the current distance (in %) that price is away from the 1% VWAP .
During a market dump you would see the 1% VWAP near current price and its value in the table may be less than 1%.
The data in the table can be very useful for backtesting and checking VWAPS daily. The VWAP will move radically in volatile days and as such this may allow users to further tweak their VWAP Settings.
To use this script simply Favorite and add to your chart.
Happy Trading :)

Wick Hunter VWAP & RSIWick Hunter VWAP & RSI Script to be used to produce quality reversal entries based on VWAP with added RSI Filtering.
Wick Connect 2.0 was designed specifically to work with Wick Hunter, the lightning fast cryptocurrency trading robot that can trade for you 24/7.
Simply input your UUID and start trading automatically with Wick Hunter!
The indicator first starts with VWAP entries, with user selectable user selectable inputs to plot percentages above and below current VWAP line.
Percentage Above VWAP = Short Entry
Percentage Below VWAP = Long Entry.
Alerts will fire as soon as price crosses the VWAP Line if using "Once per bar", and may disappear after.
Alerts shown on the chart are confirmed via candle close, and as such, "Once per bar close" should be used if the user wants to only trade confirmed signals.
RSI Filtering has been added with separate RSI Values for both long and shorts which can used to filter entries.
RSI Long Min: Minimum RSI value to fire alerts.
RSI Long Max: Maximum RSI value to fire alerts.
RSI Short Min: Minimum RSI value to fire alerts.
RSI Short Max: Maximum RSI value to fire alerts.
Happy Trading.

Gaps + Imbalances + Wicks (MTF) - By LeviathanThis script will identify and draw price gaps, wicks and imbalances with customizable fill conditions, multi-timeframe function, zone size filtering, volume comparison, lookback filtering, as well as highly customizable appearance and settings.
I’ve made this indicator to combine the three similar but different elements that occur in price movements and serve as significant zones of interest or way of PA interpretation in various different strategies.
Imbalances (or Fair Value Gap/FVG/Inefficiency/whatever)
- The Imbalance “pattern” consists of 3 candles (1- candle before the sharp move, 2 - sharp move candle and 3- candle after the sharp move). When price makes a move downwards, the imbalance zone is defined as the area between the low of 1 and the high of 3 When price makes a move upwards, the imbalance zone is defined as the area between the high of 1 and the low of 3.
Gaps
A price gap is an area on a chart where no trading activity has taken place. A gap up means that the low of the current candle is higher than the high of the previous candle and a gap down means that the high of the current candle is lower than the low of the previous candle.
Wicks (or shadows/tails/whatever)
Wicks are used to indicate where the price has fluctuated relative to the opening and closing price of the candle. An upper wick is the zone between candle high and candle close/open (whichever is higher) and a lower wick is the zone between candle’s low and candle’s close/open (whichever is lower).
Settings Overview
“Zone Type” - This input lets you decide which zones should the script plot and on which timeframe. You should always pick a timeframe higher than your chat’s.
“Middle Line, Top Line, Bottom Line” - Show or hide the Middle Line (horizontal level in the middle of each zone), Show or hide Top Line (horizontal level at the top of the zone), Show or hide Bottom Line (horizontal level at the bottom of the zone)
“UP/DOWN Zones" - This input lets you show/hide UP Zones or DOWN Zones an pick their color, border color and label color.
”Fill Condition” - If turned ON, the zones will end drawing when your prefered Fill Condition is met (Full Filll = price mitigates the whole zone, Half Fill = zone is at least halfway mitigated and Touch = zone is touched by price). If turned OFF, the zones will only be plotted for the amount of bars defined it “Zone Length”.
”Lookback (D)” - This input lets you limit the amount of zones plotted on the chart by choosing how many days back in time should the script go to find and plot zones. For example, input 1 will only show you the zones of the past day, input 7 will only show you the zones of the past week.
”Hide Filled Zones” - If turned ON, the zones that have been filled will be removed from the chart.
”Show Boxes” - Show or hide the boxes that represent the zones. This is useful for those who want the zones to be visualized by just lines.
“Filter Type” - this input lets you create a filter that will make the script only show zones that are larger than ATR or larger than a certain percentage. You can choose the ATR Length and the multiplier (higher multiplier → larger zone required), as well as the Percentage (%) and its multiplier (higher percentage → larger zone required). If you choose “None”, the zones of all sizes will be plotted.
”Zone Labels” - this part of the settings lets you: show/hide labels, decide on the size of the labels and their positions, choose a custom name for each zone, choose the data that the labels present (Type of the zone/Timeframe/ Volume ).
”Other settings” - ‘Stop/Delete zone after X number of candles’ will force stop/delete the zone if it’s plotted for more than prefered number of bars. ‘Line Style’ lets you choose the style and the color of the lines, ‘Zone Length’ defines the length of the zone if Fill Condition is “None”.
More settings, modifications and improvements coming in future updates. This script is a bit old so I will clean up and optimize the code once I have more time.

Largest Candle Profile - Selection ToolLargest Candle Profile
A simple script that finds the largest candle between a user's defined area. Search for the largest candle (high-low), largest body (open-close) or largest wick between any selected area.
How To Use:
Anchor pivot A and B on the area of choice.
Indicator can be used to detect levels of interest. Coded to be used with anchored vwap, flexible volume profile or liquidity gaps.
In action:

Wick-off Check Moving Average [Misu]█ This Indicator shows a wick-off check pattern applied to a moving average.
This pattern appears when a candle opens below the moving average and closes above it, or when it opens above a moving average and closes below it. This causes a wick to go through the moving average: a wick-off check moving average.
█ Usages:
This indicator detects small pullbacks in a trend. This is mainly used for trading continuation strategies.
It can also be used to validate a resistance or support level .
█ Features:
> Average Wick Validation: You can validate a wick-off check pattern depending on the average wick size. This is configured with parameters "Lenght Avg Wick Validation" and "Factor Wick Validation".
> Trend Validation: A trend is taken into account when detecting a "continuation pattern". A trend is validated if X candles close above (up trend) or under (down trend) the moving average. This "X" is defined by "Length Bar - Trend Validation" parameter.
> Buy and Sell: Labels are showing wick-of check patterns but can be interpreted as a buy & sell signal.
> Multi Moving Average.
> Alerts.
█ Parameters:
Method Multi MA : The method for calculating the moving average.
Multi MA Length : The length used to calculate the moving average.
Length Bar - Trend Validation : Define the number of bar needed to validate a trend. When price is above the MA, trend is up. When price is under MA, trend is down.
Wickoff Mode : Mode used to detect Wickoff check pattern.
> continuation pattern: only shows wick-off check pattern in a confirmed trend.
> no trend in progress: only shows wick-off check pattern in a not confirmed trend.
> both: shows both.
Lenght Avg Wick Validation : Lenght used to calculate the average wick size.
Factor Wick Validation : Factor used to validate the length of a wick when a wick-off check is detected.
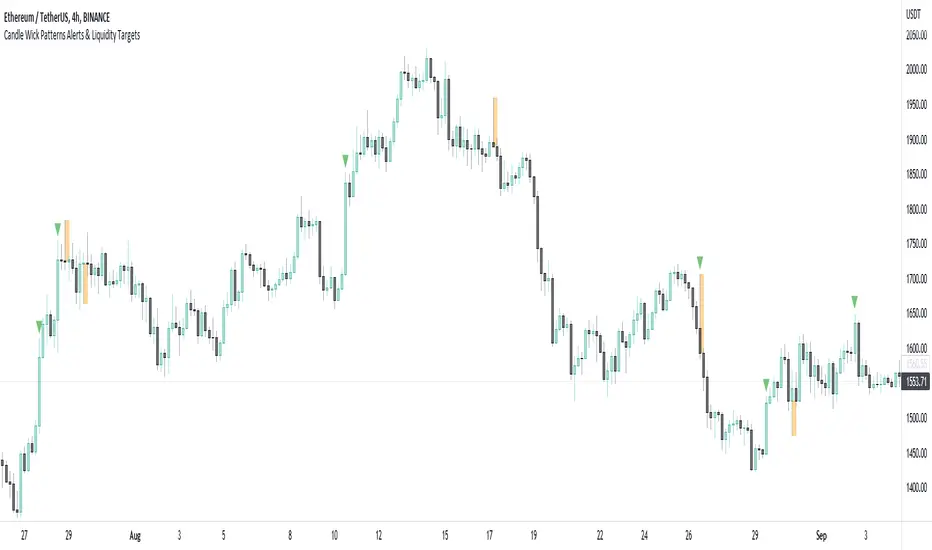
Candle Wick Patterns Alerts & Liquidity TargetsCandle wicks provide incredibly useful confluence and confirmation of price action and technical analysis.
Quite simply a wick is formed by price being moved to an extreme by one side, then price being pushed back by the other side.
This can show increased pressure by one side, reduced or increased momentum, or exhaustion by another side.
This indicator while simple, is extremely powerful and versatile and can be set up to recognize numerous types of candle wick and therefore suit numerous trading styles.
The settings as to how wicks are highlighted are:
- Timeframe - view wicks on a higher timeframe while trading on a lower timeframe
- Minimum Wick to Body Ratio - increasing this value will look for wicks who are at least n times larger than the candle body. The most obvious examples here are Doji's - hammer, gravestone, dragonfly, etc. These can indicate trend reversals, indecision and changing momentum.
- Minimum Candle Body as percent of price - this value makes sure that any wick highlighted, belongs to a candle with a body that is at least n% of the price. A higher value is likely to show price momentum is stronger in a particular direction, good for confirming a trend.
- Minimum Candle Wick as percent of price - similar to candle bodies, this value will make sure the candle wick is at least n% of the price. This will identify large fluctuations in price, and if you are familiar with smart money concepts, an increasingly popular strategy is to target 50% of the wick being filled (liquidity).
- Show half fill level of wick - As above, this can provide a good target, which price will be drawn to, depending on the wick.
Finally, the indicator can be used to create alerts when a new wick that meets your settings criteria, is formed.
And don't forget you can add the indicator multiple times, with different settings to cover multiple scenarios and timeframes!
Wick Pressure by SiddWolfMultiple Wicks forming at OverSold & OverBought levels create Buying and Selling Pressure. This Script tries to capture the essence of the buy and sell pressure created by those wicks. Wick pressure shows that the trend is Exhausted.
How it works:
This Wick Pressure Indicator checks for three candles forming the wicks in overbought and oversold zones. The zones are set by RSI and can be changed in settings. Those three candles should form a bit long wick and length of the wick is determined by ATR. The ATR multiple can be changed from settings. And then the script draws a box in the area formed by three candle wicks.
Confluence:
This indicator should not be used on its own. You should include it in your existing trading strategy. Any indicator should be rigorously tested before making any real trades.
Settings is the Key:
Settings are key to all of my indicators. Play around with it a bit. Change the ATR multiplier. Read the tooltips to understand what each settings mean. Tooltips are the (i) button in-front of each settings.
FAQs:
Q. Does the indicator Repaint ?
--- No. None of my indicators repaints. What you see now is what's drawn in real time.
Q. Indicator doesn't show anything ?
--- Maybe you've messed up the settings so reset it. or try different coin/stock.
Q. Does this indicator give financial advice?
--- No. Nope. Nein. Não. नहीं.
Conclusion:
This indicator is very basic but if used correctly it can be very powerful. Hit me up if you'd like to see the screener/scanner for this or any of my indicators. If you have any questions or suggestions feel free to comment below. I'd love to connect with you. Thank you.
~ SiddWolf

Long WickIt will work on Bank Nifty future only with 2 min time frame. GO Long above candle if the lower wick is more than 50 points and go short below the candle if upper wick is more than 50 points. It will work better with price action.(demand and supply zone)
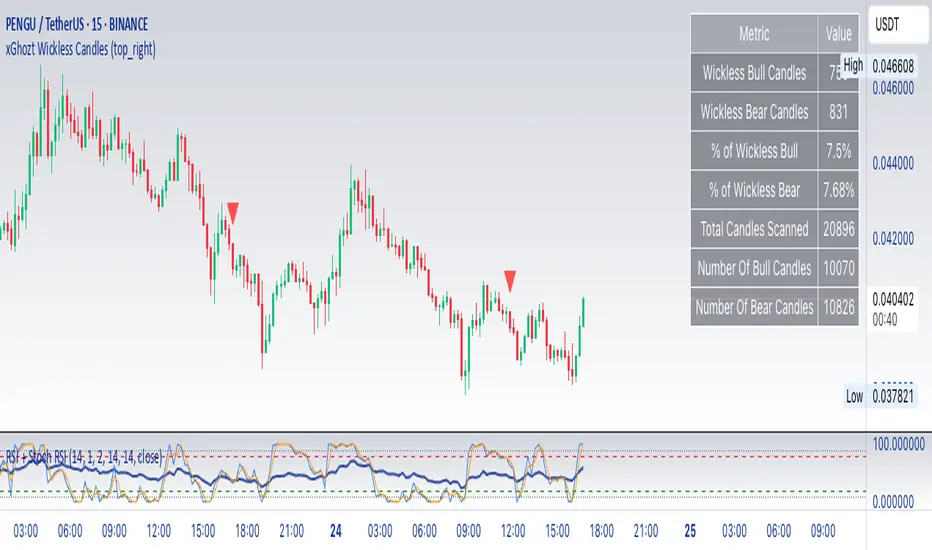
xGhozt Wickless CandlesSimple script showing candles missing an upper or downer wick. As candles tend to have a low and a high, they will most certainly form wicks. It is rare to have wickless candles on longer time frames, so it's more relevant on 1h and above.
What can you do about it?
If you see for example a Bitcoin 4h candle that hasn't form two wicks yet, there are high chances that the missing wick will be formed at one point or another, therefore you could take a trade in the direction of the missing wick. You can set alerts on wickless candles if needed.