CBG Swing HighLow MAThis indicator will show the swing high and lows for the number of bars back. It's very easy to use and shows good support and resistance levels.
I then took it a step further and added a moving average with all the standard types in my indicators:
SMA
EMA
Weighted
Hull
Symmetrical
Volume Weighted
Wilder
Linear Regression
I then added Bollinger Bands to show the standard deviation from the midline.
Finally, I added a simple bar coloring scheme: green if above the upper BB, Red if below and orange if in the middle.
I am just testing this out so please use with caution. If anyone in the community wants to run some backtests, that would be great and we would all appreciate it.
Of course you can keep it all simple and turn off all the moving averages and bollinger bands.
Enjoy! :-)
Wilder

CBG PaintBarsUses a linear regression of averages to paint bars.
Average types include SMA, EMA, Weighted, Hull, Symmetrical, Volume Weighted, Wilder, and Linear Regression.
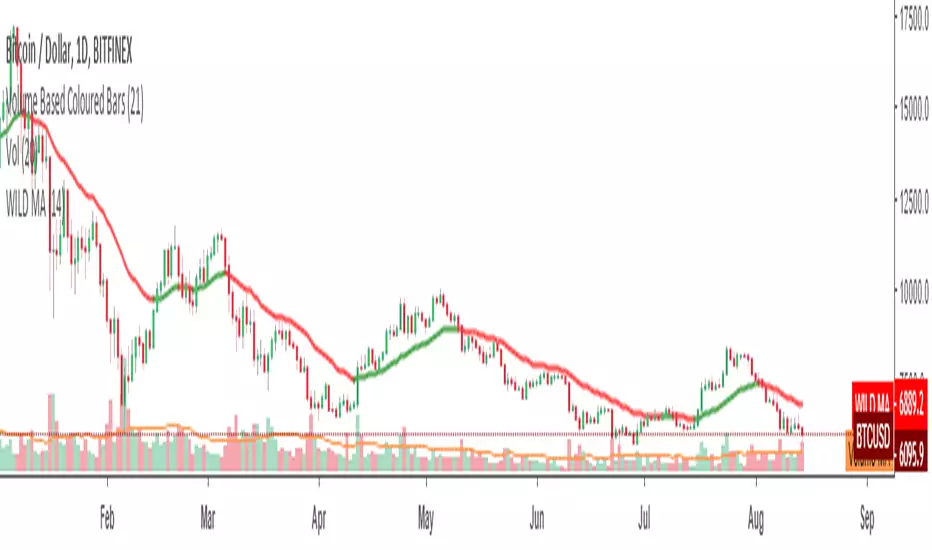
CBG Keltner ChannelsKeltner Channel with the following Moving Average types: SMA, EMA, Weighted, Hull, Symmetrical, Volume Weighted, Wilder and Linear Regression. Plus 2 bands with full color shading.
The picture shows the Keltner channels with the Wilder MA, my favorite. See how easy it would have been to stay in the move down? Excellent indicator.

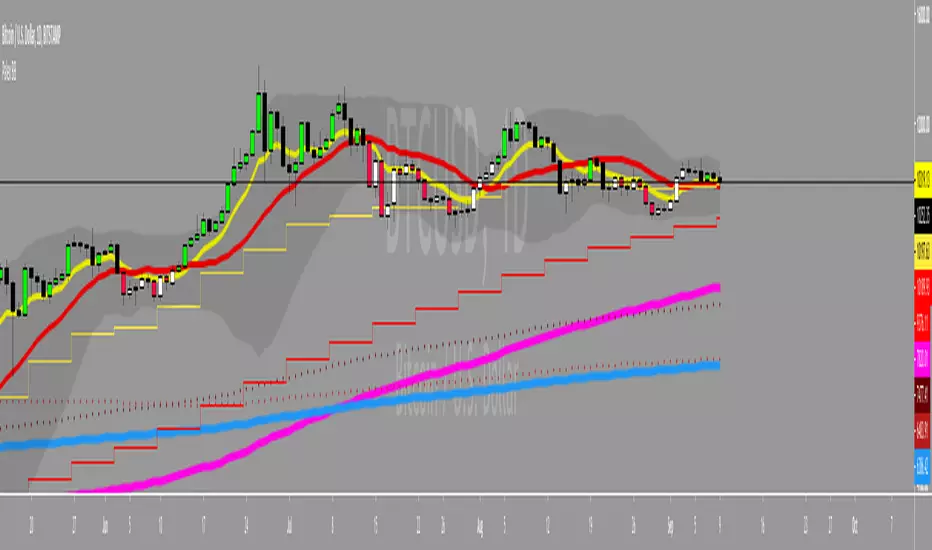
CBG MultiAverages ColorsThe latest version of my multiple moving averages. Now includes up to 14 moving averge lines plus a separate slow and fast moving average that can be assigned a different MA type.
In the screen shot is the fast/slow set to Hull with 15/50 periods. It is overlaid on top of my Key Numbers indicator.
7 moving averages in 1 indicator, including the Hull Moving Average .
SMA
EMA
Weighted
Hull
Symetrical
Volume Weighted
Wilder
Linear Regression
Lots of other features like background shading and paint bar colors.
Trend Balance Point System by Welles WilderThis is the original Trend Balance Point System created by Welles Wilders in 1978, rules can be found in his book New Concepts in Technical Trading Systems.

RSI channel ob/os breakout [ChuckBanger]This is a breakout signal script based on reverse engineering of RSI. It shows a channel of overbought and oversold readings that the trader can sett in settings. When low crosses under lower line it shows bullish signal and when high is crossing upper line it shows a bearish signal. The script also has wilder's moving average as filter instead of high/low.
Good luck traders!

Palex 2.0Atualização do SETUP do saudoso Professor Alexandre Fernandes "Palex"
- Bandas de Bolliger (Standard) =
*Banda Superior = Média Móvel Simples (20 dias) + (2 x Desvio Padrão de 20 dias)
*Banda Inferior = Média Móvel Simples (20 dias) – (2 x Desvio Padrão de 20 dias)
- EMA 9 (Média Móvel Exponencial)
- SMA 21 (Média Móvel Simples)
- SMA 200 (Média Móvel Simples) Clássica MA 200 períodos
- SMA 400 (Média Móvel Simples)
- EMA 400 (Média Móvel Exponencial)
- WILD (Média Móvel Welles Wilder)
O mesmo usado pelo nosso grande Mestre PALEX!
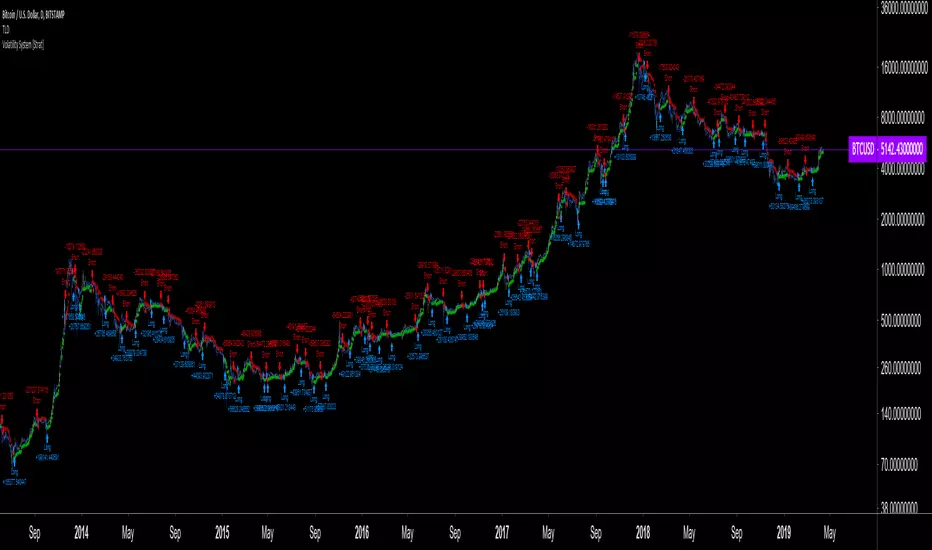
Volatility System by Wilder [LucF]The Volatility System was created by J. Welles Wilder, Jr. It first appeared in his seminal masterpiece, "New Concepts in Technical Trading Systems" (1978). He describes the system on pp.23-26, in the chapter discussing the first presentation ever of the "Volatility Index", built using a novel way of calculating a value representing volatility that he named Average True Range (ATR). The latter stuck.
The system is a pure reversal system (it is always either long or short). One of its characteristics is that its stop strategy moves up and down during a trade, widening the gap from price when volatility (ATR) increases. Because of this, this strategy can suffer large drawdowns and is not for the faint of heart.
The strategy uses a length (n) to calculate an ATR. ATR(n) is then multiplied by a factor to calculate the Average Range Constant (ARC). The ARC is then added to the lowest close n bars back to form the high Stop and Reverse points (SAR), and subtracted from the highest close n bars back to calculate the low SAR. Reversals occur when price closes above the high SAR or below the low SAR.
The system is best suited to higher time frames: 12H and above. Its performance depends heavily on calibration of the length and ARC factor. Wilder proposes a length of 7 and a factor between 2.8 to 3.1. My summary tests at 12H, 1D and 3D on stocks and cryptos yield better results with values of approximately 9-10/1.8-2.5 for cryptos and 9-10/3.0-4.0 for stocks. Small changes in the values will sometimes yield large variations in results, which I don’t particularly like because it tends to imply fragility, whereas I’d expect more robustness from a system with such simple rules. Additionally, backtests at 1D on cryptos provide so little data that no solid conclusions can be drawn from them.
All in all, the system is not very useful in my opinion; I publish it more for completeness, since as far as I can tell, it did not exist on this platform before. I also publish it out of respect for Wilder’s work. His book laid the foundation for many of the building blocks used by system designers, even today. In less than a hundred pages he presented RSI, ATR, DMI, ADXR and the Parabolic SAR indicators, some of which have become built-in functions in programming languages. This is a colossal feat and has not been repeated. Wilder is a monument.
Some lesser-known facts about his book:
It sells for the exact same price it cost in 1978: 65$,
The book has always been published by Wilder himself,
The layout hasn’t changed in 40 years,
He sells >35K copies/year.
Gotta love the guy.
The strategy is shown here on BTC /USD with settings of 12/1.8 (the defaults are 9/1.8). It shows the system under its best light. Other markets will most not reproduce such results. Also, the drawdown is as scary as the results are impressive.
Features
The code is written as a strategy but can easily be converted to an indicator if you want to use the alerts it can produce. Instructions are in the code.
You can change the length and ARC factor.
You can choose to trade only long or short positions.
You can choose to display the SARs (the stops) in multiple ways.
You can show trigger markers.
A date range can be defined.
3 alerts: reversals (both long and short), longs, shorts. Remember that for the moment, strategies cannot generate alerts in TradingView, so the strategy must be converted to an indicator in order to make the alerts available.
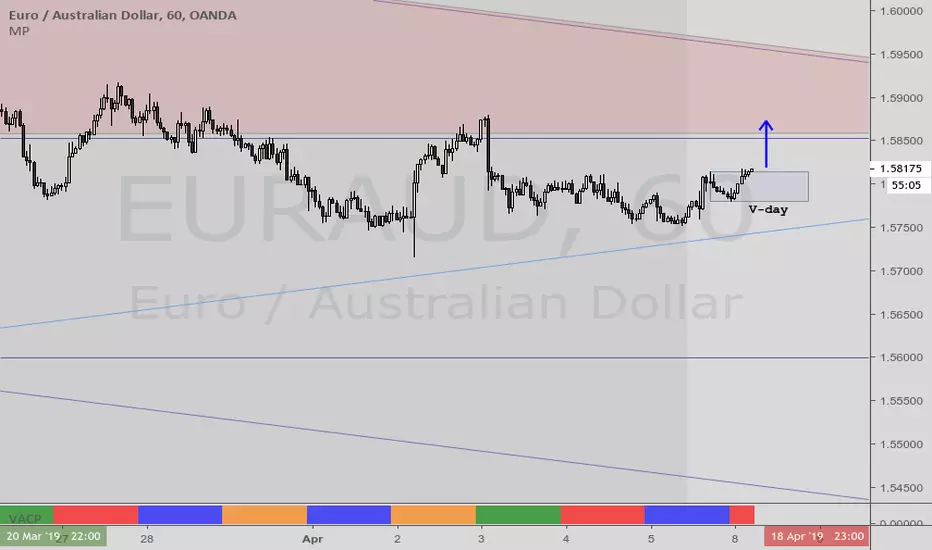
VACPWelles Wilder (delta phenomenon) a 4-day rotation indicator
PVAC is the acronym Alan uses for a four-day rotation cycle. The cycle itself is circularly continuous every days of the week, forever, including every holiday. Thus if, for instance, Monday was a P, Tuesday is V, Wednesday is A, Thursday is C. At this point the cycle repeats, with Friday being P, Saturday being V, Sunday being A, and the following Monday being C.
Having started, the cycle never changes. While each day tends to have the characteristics shown below, like all cycle tools, there are inversions, which will last a cycle or at times even more, and have reasonable odds of inverting regularly.
A trader who wants to incorporate a four-day rotation cycle into their work is encouraged to study for themselves whether this adds value.
Day: V-day Color: Red Characteristics: Closes well for bulls; Use your fleece bars Bar8 and Bar11; Bar8 open often a V-day return target; 'V' return comes early in day in bear moves, late in day in bullish moves
Day: A-day Color: Blue Characteristics: Closes poorly for bulls; Use your fleece bars 8 and 11; Generally 'A' shaped, but may have a kick-leg after 3pm
Day: C-day Color: Orange Characteristics: Consolidation day, aka 'consoly' day. It may not chop, but it may have an
accumulation or distribution quality to the action; Trade often and trade fast; Pattern traders fade 4HHs and 4LLs with backfill/pullbacks 3 bars later; Apexes and angulars tend to have less importance; Numerical traders trade after Bar8 open and use support one horizontal below, resistance one horizontal above; C-day opens often at the 25%; The afternoon action tends to be opposite to the morning action
Day: P-day Color: Green Characteristics: Often a trend day. Find the trend and enter it; Often opens at the 75%; Trade P-days against a quartile; Watch for price to be above/below the first apex: buy above or sell below ; Do not fade dead zone, minimal trading
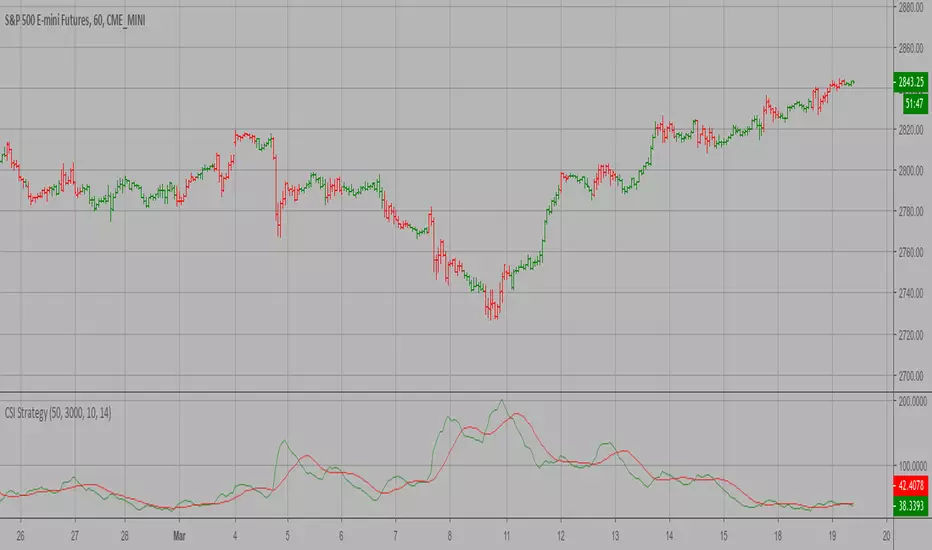
Commodity Selection Index Strategy The Commodity Selection Index ("CSI") is a momentum indicator. It was
developed by Welles Wilder and is presented in his book New Concepts in
Technical Trading Systems. The name of the index reflects its primary purpose.
That is, to help select commodities suitable for short-term trading.
A high CSI rating indicates that the commodity has strong trending and volatility
characteristics. The trending characteristics are brought out by the Directional
Movement factor in the calculation--the volatility characteristic by the Average
True Range factor.
Wilder's approach is to trade commodities with high CSI values (relative to other
commodities). Because these commodities are highly volatile, they have the potential
to make the "most money in the shortest period of time." High CSI values imply
trending characteristics which make it easier to trade the security.
The Commodity Selection Index is designed for short-term traders who can handle
the risks associated with highly volatile markets.
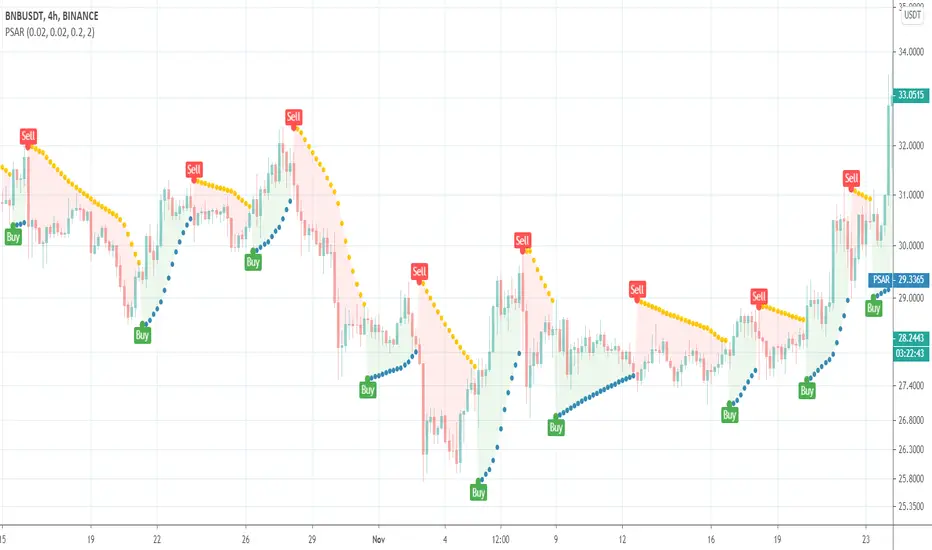
Parabolic SARThis is a redesign of the built-in Parabolic SAR indicator. I added a proper input system, an option to highlight initial points for both lines and an option to choose points width. So, customize it as you want.
Parabolic SAR was originally developed by J. Welles Wilder and described in his book "New Concepts in Technical Trading Systems" (1978). It is a trend-following indicator that can be used as a trailing stop loss.
To know which settings for PSAR are the most profitable on your instrument and timeframe you can use this tool
Profitable Parabolic SAR
RSI ATR ChannelDraws a channel based on ATR (Average True Range) and RSI. Detects band touches and colors the background appropriately.

Average Directional Movement Index Rating ADXR by KIVANÇ fr3762Average Directional Movement Rating quantifies momentum change in the ADX . It is calculated by adding two values of ADX (the current value and a value n periods back), then dividing by two. This additional smoothing makes the ADXR slightly less responsive than ADX . The interpretation is the same as the ADX ; the higher the value, the stronger the trend.
The ADXR , being a smoothed version of ADX , and can be used similarly to the ADX in the three rule system discussed on the ADX section..
The ADXR is a measure of the spread between the Directional Indicators ( +DI and -DI ). When the ADXR is declining, it's not advised to use a trend following system. However, a rising ADXR signals that the dominant trend is likely to continue. A rising ADXR , with both the ADXR and DI+ above the D- indicates a strengthening bullish market. The scan syntax needed to represent this condition would be...
ADXR > DIMINUS AND DIPLUS > DIMINUS AND ADXR > ADXR .1
A rising ADXR , with both the ADXR and DI- above DI+ indicates a strengthening bearish trend . The scan syntax needed to represent this condition would be...
ADXR > DIPLUS AND DIMINUS > DIPLUS AND ADXR > ADXR .1
If the ADXR has been below both DI+ and DI- but has begun to rise a new market trend is emerging. The scan syntax needed to represent this condition would be...
ADXR < DIPLUS AND ADXR < DIMINUS AND ADXR > ADXR .1
IMPORTANT NOTICE: USERS CAN ADD ADX DI+ and DI- indicators by checking the box in the settings of the indicator.
Developed by J.Welles Wilder
ÖNEMLİ BİLGİ: KULLANICILAR ADX , DI- ve DI+ indikatörlerini de ayarlar bölümündeki kutucukları işaretleyerek sayfaya ekleyebilirler.

WILDER'S Moving Average by fr3762 KIVANCThe Wilder’s Moving Average indicator (Wilder’s Smoothed Moving Average ) was developed by Welles Wilder and introduced in his 1978 book, “New Concepts in Technical Trading Systems.” Mr. Wilder did not use the standard EMA formula; instead, the following formula is used: EMA = Input * K + EMA * (1-K), where K = 2 / (N+1). Then to find the Wilder’s Moving Average, the following calculation is performed: Input * K + EMA * (1-K), where K =1/N.
Type to use
Moving averages are commonly used to identify trends and reversals as well as identifying support and resistance levels. Moving averages such the WMA and EMA , which are more sensitive to recent prices (experience less lag with price) will turn before an SMA . They are therefore more suitable for dynamic trades, which are reactive to short term price movements. Moving averages such as the SMA move more slowly providing valuable information on the long dominant trend. They can however be prone to giving late signals causing the trader to miss significant parts of the price movement.
Trade Signals
Moving Average Crossovers: Moving average crossovers is a term applied when more than one moving average is used to generate a trade signal where traders will act when the shorter term moving average crosses the longer term moving average. A bullish crossover occurs when the shorter term moving average crosses above the longer term moving average (golden cross). A bearish crossover occurs where the shorter term moving average crosses below the longer term moving average (dead cross).
Price crossovers: A Price crossover is a term applied when a signal is generated where the price crosses a moving average. Bullish signals are given when the price moves above the moving average, bearish signals are given when the price moves below the moving average. Crossover trades are more likely to enjoy success when the moving average slopes are in the direction of the trade.
Support and Resistance: Moving averages can also act as a support level in an uptrend and resistance levels in a downtrend. If the average is widely followed orders in favour of the trend often cluster around the average. As markets are often driven by emotion and many players trade counter to the trend expect overshoots, to this extent the average should be used to identify support and resistance zones rather than exact levels.
from: mahifx.com
Developed by WELLES WILDER

[naoligo] Simple ADXI'm publishing this indicator just for study purposes, because the result is exactly the same as DMI without the smoothing factor. It is exactly the same as ADX Wilder from MT5.
I was looking for the algorithm all over and it was a pain to find the right formula, meaning: one that would match with the built-in ones. After several study and comparison, I still didn't find the algorithm that match with the MT5's built-in simple ADX ...
Enjoy!

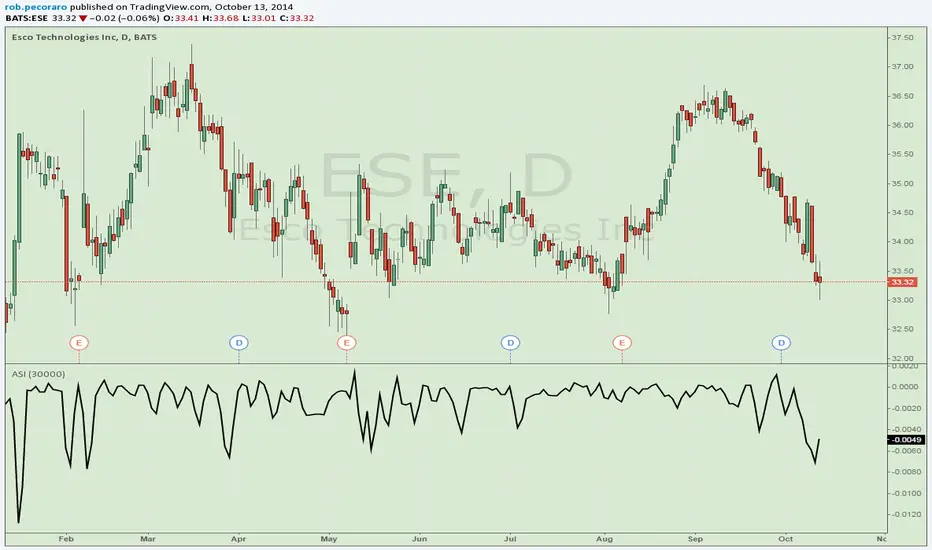
Accumulation Swing IndexPer Investopedia: The ASI is used to gage the long-term trend by comparing bars which contain its opening, closing, high and low prices throughout a period of time. It is a trend finding/confirming tool.