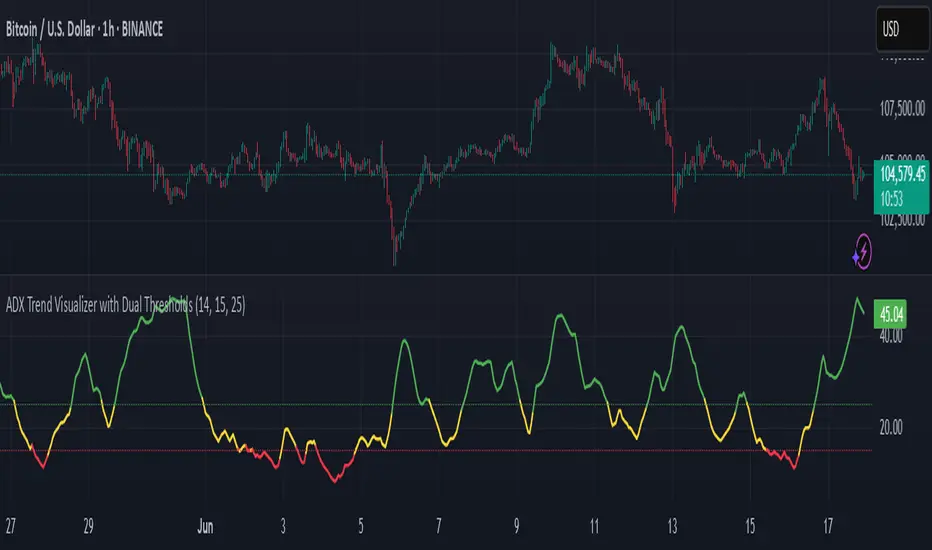
ADX Trend Visualizer with Dual ThresholdsADX Trend Visualizer with Dual Thresholds
A minimal, color coded ADX indicator designed to filter market conditions into weak, moderate, or strong trend phases.
Uses a dual threshold system for separating weak, moderate, and strong trend conditions.
Color coded ADX line:
Green– Strong trend (above upper threshold)
Yellow – Moderate trend (between thresholds)
Red – Weak or no trend (below lower threshold)
Two horizontal reference lines plotted at threshold levels
Optional +DI and -DI lines (Style tab)
Recommended Use:
Use on higher time frames (1h and above) as a trend filter
Combine with entry/exit signals from other indicators or strategies
Avoid possible false entries when ADX is below the weak threshold
This trend validator helps highlight strong directional moves and avoid weak market conditions
Wilder
Rube Goldberg Top/Bottom Finder [theUltimator5]This is what I call the Rube Goldberg Top and Bottom Finder. It is an overly complex method of plotting a simple buy or sell label on a chart.
I utilize several standard TA techniques along with several of my own to try and locate ideal Buy/Sell conditions. I came up with the name because there are way too many conditional variables to come up with a single buy or sell condition, when most standard indicators use simple crossovers or levels.
There are two unique triggers that are calculated using completely independent techniques. If both triggers turn true within a small timeframe between each other, the buy/sell trigger turns true and plots a "buy" or "sell" label on the chart.
This indicator was designed to be fully functioning out of the box and can be customized only if the user wishes to. It is effective on all timeframes, but longer timeframes (daily +) may require signal length adjustment for best results.
imgur.com
The signals used in the leading trigger are as follows:
(1)RSI
The user can select among any of the following moving averages (base is EMA) (#3) , and have an RSI generated at a user defined length (base is 14). (#4)
SMA, EMA, DEMA, TEMA, WMA, VWMA, SMMA, HMA, LSMA, ALMA
The user can select whether or not the RSI is filtered with the following options:
None, Kalman, Double EMA, ALMA
The filter conditions are hard coded to minimize the amount of selections that the user is required to make to reduce the user interface complexity.
The user can define overbought (base 70) and oversold (base 30) conditions. (#2)
When the RSI crosses above or below the threshold values, the plot will turn red. This creates condition 1 of the leading trigger.
(2) ADX and DI
This portion of the indicator is a derivative of my ADX Divergence and Gap Monitor indicator.
This technique looks at the ADX value as well as for spikes in either +DI or -DI for large divergences. When the ADX reaches a certain threshold and also outpaces a preset ADX moving average, this creates condition 2 of the leading trigger.
There is an additional built-in functionality in this portion of the indicator that looks for gaps. It triggers when the ADX is below a certain threshold value and either the +DI or -DI spike above a certain threshold value, indicating a sudden gap in price after a period of low volatility.
The user can set whether or nor to show when a gap appears on the chart or as a label on the plot below the chart (disabled by default) . If the user chooses to overlay gaps on the chart, it creates a horizontal fill showing the starting point of the gap. The theory here is that the price will return at some point in the near future to the starting point of the gap.
imgur.com
(3) DI based Multi-Symbol reference and divergence
Part of the script computes both the +DI (positive directional index) and -DI (negative directional index) for the currently selected chart symbol and three reference symbols.
The averaged directional move of the reference symbols are compared to the current ticker on your chart and if the divergence exceeds a certain threshold, then the third condition of the trigger is met.
The components that are referenced are based on what stock/chart you are looking at. The script automatically detects if you are looking at a crypto, and uses a user selectable toggle between Large Cap or Small Cap. (#1) The threshold levels are determined by the asset type and market cap.
The leading trigger highlights under several conditions:
1) All (3) portions of the trigger result in true simultaneously
OR
2) Any of triggers 2 or 3 reach a certain threshold that indicates extreme market/price divergence as well as trigger 1 being overbought or oversold.
AND
3) If the trigger didn't highlight
For the lagging part of the trigger:
The lagging trigger is used as a confirmation after the leading trigger to indicate a possible optimized entry/exit point. It can also be used by itself, as well as the leading indicator.
The lagging indicator utilizes the parabolic Stop And Reverse (SAR). It utilizes the RSI length that is defined in portion 1 of the leading trigger as well as the overbought and oversold thresholds. I have found excellent results in catching reversals because it catches rate-of-change events rather than price reversals alone.
imgur.com
When both the leading triggers FOLLOWED BY the lagging trigger result in true within a user defined timeframe, then the buy or sell trigger results in true, plotting a label on the chart.
All portions of the leading and lagging indicators can be toggled on or off, but most of them are toggled off by default in order to reduce noise on the plot.
imgur.com
The leading, lagging, and buy/sell triggers each have built-in alerts that can be toggled on or off in the alert menu.
I have an optional built-in toggle to show green or red dots on the RSI line using two separate RSI lengths that are amplified and plot based on RSI divergence and strength. This can be used as a visual confirmation (or rejection) against the chart overlay plots.
imgur.com
This indicator is not a strategy, so there are no built-in exits or stop losses.

[Stop!Loss] ADR Signal ADR Signal - a technical indicator located in a separate window, which displays by default the 80%-level , as well as the 100%-level of the average daily range (ADR) for the last 10 days and compares it with the current intraday range. The indicator helps not only with the use of a mathematical-statistical method to identify a potential reversal at the moment during intraday trading, but can also serves as an effective assistant in risk management.
👉 Basic mechanics of the indicator
Firstly, this indicator tracks the performance of the standard ATR indicator on the daily chart, in other words, ADR (Average Daily Range).
Important ❗️The ATR (Average True Range) indicator was created by J. Welles Wilder Jr. He first introduced ATR in his book "New Concepts in Technical Trading Systems", published in 1978. Wilder developed this indicator to measure market volatility to help traders estimate the range of price movements. This indicator is built into TradingView, more details can be found by link: www.tradingview.com
Like ATR , ADR calculates the average true range for a specified period. In this case, the distance in points from the maximum of each day to its minimum is calculated, after which the arithmetic mean is calculated - this is ADR .
👉 Visualization
ADR Signal is located in a separate window on the chart and has 3 levels:
1) "ADR level" (green line) - the same parameter, the calculations of which are briefly described above. There is 100%-level of ATR on the daily chart (ADR).
2) "Current level" (red line) - this is the current price passage within the day, calculated in points. At the start of a new day, this parameter is reset. Therefore, in the indicator window, this line has sharp drops at the start of a new trading day: "A new trading day - the instrument's power reserve is renewed again".
3) "Signal level" (blue line) - this is an individually customized value that demonstrates a certain part of the ADR parameter.
👉 Inputs
1) - is responsible for the ATR indicator period, the value of which will always be calculated on the daily chart. The default value is "10", that is, ATR is calculated for the last 10 days (not including the current one).
2) - signal level (in %). The default value is "0.8", that is, 80%-level of the ADR parameter (set earlier) is calculated.
👉 Style
1) - by default, this level is colored "blue".
2) - by default, this level is colored "red".
3) - by default, this level is colored "green".
👉 How to use this indicator
Important❗️ The two methods of the use of the ADR Signal indicator described below will be most effective when trading intraday (which is highlighted quite well below), so it is more logical to use the indicator information on time periods H1 and below.
1) Identifying potential reversals during intraday trading:
The ADR Signal indicator can be used as a potential individual reversal strategy.
Important ❗️It should be noted that using it in it without additional confirming analysis tools will be a rather aggressive trading approach. Therefore, it is best to support the entry point in particular with other methods.
In this case, the crossing of the red line (the number of points passed within the current day, that is, from the minimum of the current day to its maximum) and the blue line (color of the Signal level based on the default settings), indicates that the trading instrument has passed 80% (based on the default settings for the "Signal level") of its average distance from the maximum to the minimum over the past 10 days (based on the default settings for the "ADR Length"). Such a situation in the context of the mathematical-statistical approach indicates a probable reversal, since the "power reserve" of this instrument is mostly exhausted, so one can expect with a higher probability, at least, a price stop and possibly a reversal. In case of crossing of the red line and the green one (ADR level), it says again that based on the mathematical-statistical approach, this trading instrument has completely exhausted its intraday "power reserve". In this situation, a stop or reversal of the price will be even more likely.
Of course, using the "Signal level" parameter, one can filter out even more reliable situations for potential price reversals within a day, namely, by specifying, for example, 1.5 in the field of this parameter. Under such conditions, in the case of crossing the red and blue lines (based on the default style settings), to say that the trading instrument has passed 150% of its average distance over the last 10 days (based on the default style settings "ADR length"). In this case, the probability of a stop or reversal of the price increases even more.
2) Use in risk management:
In terms of risk management, this indicator is more applicable to open trades. For example, if one had an open Buy-position (especially if it is an intraday trade) and the price has raised significantly during the day, then the crossing of the red line with the blue line , and especially the red line with the green line , may indicate that the price will most likely stop growing, since the "power reserve" is almost or completely exhausted for this instrument within the current day. In this case, one can, at a minimum, move the trade to breakeven or even partially fix the profit.
We will continue to discuss the methods of using this indicator and strategies based on it here. And we are always waiting for your reactions and feedback on this topic 💬.
Thank you for your support 🚀

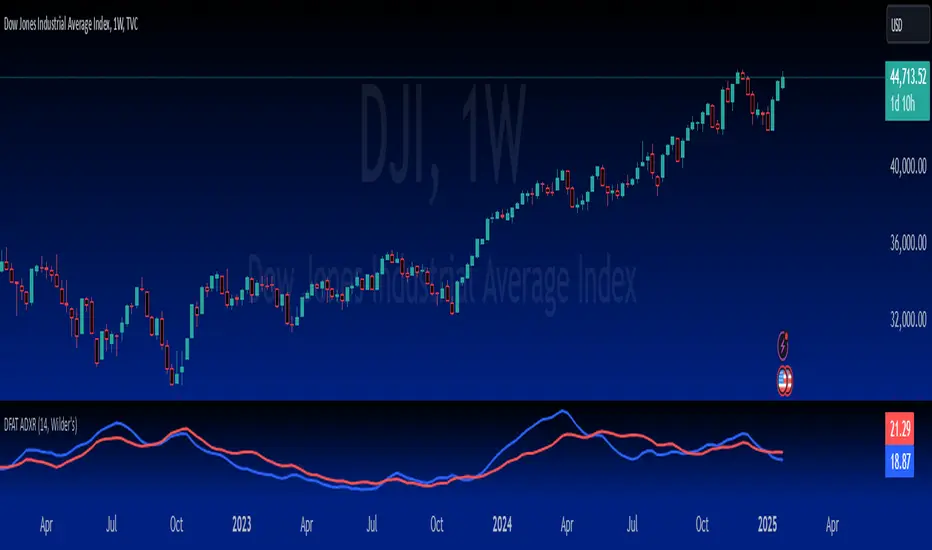
Aj's DikFat Adjusted ADXRAj's DikFat Adjusted ADXR
This indicator is designed to plot the Average Directional Index (ADX) and Average Directional Movement Rating (ADXR) on the chart. The ADX and ADXR are both used to measure the strength of a trend in the market. The script allows you to customize several parameters, including the ADX Length and the Moving Average Method used for smoothing the directional movement indicators.
Key Features:
- ADX Length : Defines the number of periods over which the ADX is calculated. This value can be adjusted by the user to suit different trading styles and timeframes.
- Moving Average Method : Choose between several smoothing methods, including Simple Moving Average (SMA), Exponential Moving Average (EMA), Wilder's Moving Average, Weighted Moving Average (WMA), Hull Moving Average (HMA), or a Super Smooth Moving Average.
- Directional Indicators : The script calculates the +DI and -DI, which represent the positive and negative directional indicators respectively. These are then used to calculate the ADX.
- ADXR : The ADXR is calculated as the average of the current ADX value and the ADX value from 14 periods ago, providing a more smoothed representation of the trend strength.
How Traders Use ADX and ADXR:
- ADX : A rising ADX indicates an increasing trend strength, while a falling ADX suggests a weakening trend. A value above 25 is often considered an indication of a strong trend.
- ADXR : This indicator smooths the ADX over time, helping traders identify persistent trends. The ADXR can help filter out noise and provide a clearer picture of the trend's health.
Please note that this script and its indicators are designed to be used as tools for analysis, not as guarantees of market outcomes. Adjustments to the moving average method or ADX length can change the behavior of the indicators based on market conditions.
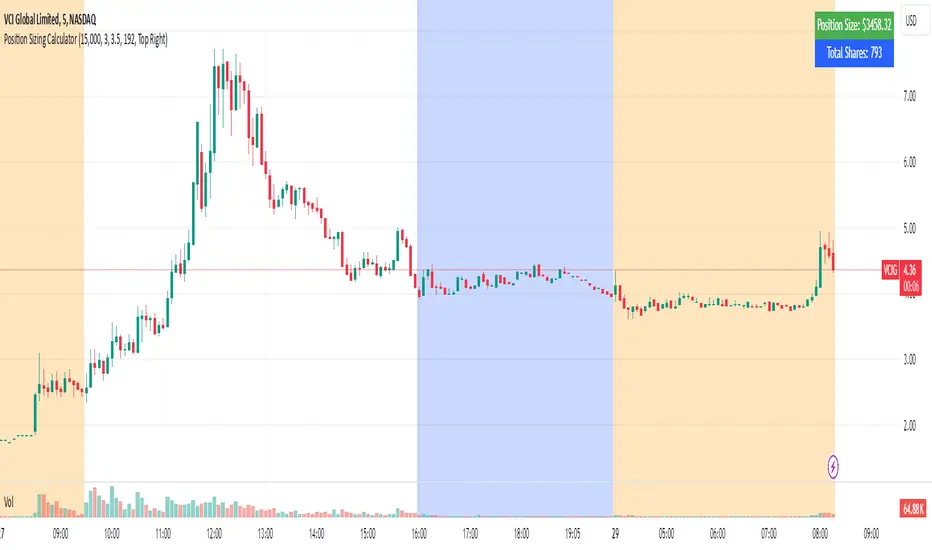
Position Sizing Calculator (Real-Time)█ SUMMARY
The following indicator is a Position Sizing Calculator based on Average True Range (ATR), originally developed by market technician J. Welles Wilder Jr., intended for real-time trading.
This script utilizes the user's account size, acceptable risk percentage, and a stop-loss distance based on ATR to dynamically calculate the appropriate position size for each trade in real time.
█ BACKGROUND
Developed for use on the 5-minute timeframe, this script provides traders with continuously updated, dynamic position sizes. It enables traders to instantly determine the exact number of shares and dollar amount to use for entering a trade within their acceptable risk tolerance whenever a trade opportunity arises.
This real-time position sizing tool helps traders make well-informed decisions when planning trade entries and calculating maximum stop-loss levels, ultimately enhancing risk management.
█ USER INPUTS
Trading Account Size: Total dollar value of the user's trading account.
Acceptable Risk (%): Maximum percentage of the trading account that the user is willing to risk per trade.
ATR Multiplier for Stop-Loss: Multiplier used to determine the distance of the stop-loss from the current price, based on the ATR value.
ATR Length: The length of the lookback period used to calculate the ATR value.
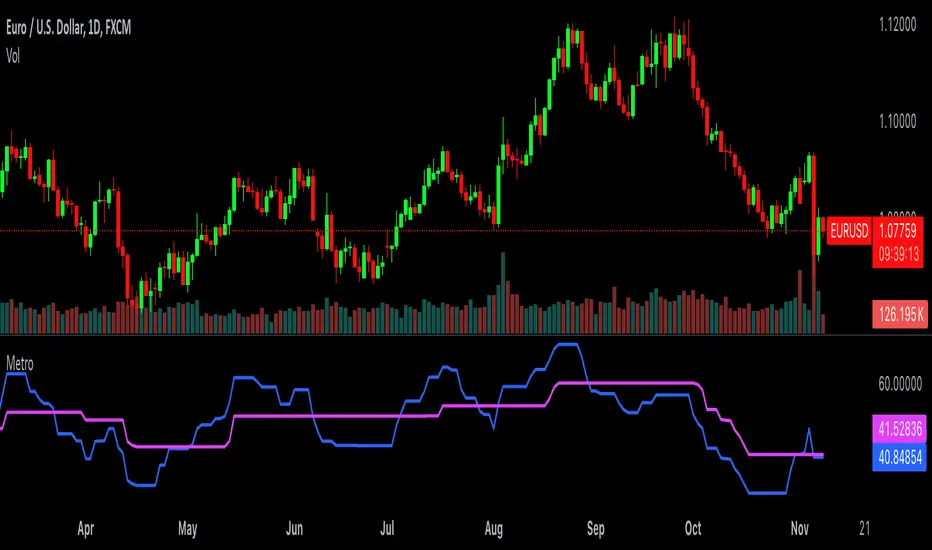
Simplified MetroThis is a derivative of J. Welles Wilder's RSI (Relative Strength Index) from 1978. This version uses a fast and slow offset of the RSI to create signals. The RSI itself has been removed from this version for visual simplicity, but its setting still has an impact on the fast and slow stepped lines.
The "RSI Period" sets the number of bars used to calculate the RSI. A higher value results in a smoother RSI, while a lower value makes it more reactive to price changes.
The "Fast Step Size" defines the step size for the fast trend line. A larger value makes the fast step line less sensitive to RSI changes, creating a smoother line.
The "Slow Step Size" defines the step size for the slow trend line. A larger value makes the slow step line less sensitive to RSI changes, resulting in a smoother line compared to the fast step.
When the faster blue line crosses and closes above the slower fuchsia line we have a signal to go long, and vice versa we take a short position.
This indicator should not be traded on its own, but could be a valuable addition to a system used for identifying trends.
Relative Rating Index (RRI)The technical rating is one of the most perfect indicators. The reason is that this indicator is based on a majority vote of multiple indicators. It is logical that the judgment based on a majority vote of multiple indicators would not be inferior to the judgment made using only a single indicator. However, just as any indicator has its shortcomings, the technical rating also has weaknesses. The most significant issue is that it primarily provides only a momentary evaluation of the current situation.
Let's consider this in more detail. In the technical rating, an evaluation of 1.0 by the majority vote of indicators is considered a strong buy. However, in the market, there are naturally varying levels of strength. For example, would a market that only once reached an evaluation of 1.0 within a given period be considered the same as a market that consistently maintains an evaluation of 1.0? The latter clearly shows a stronger trend, but the technical rating does not provide an objective criterion for such differentiation. While it is possible to check the histogram to see how long the buy or sell rating has continued, there is no objective standard for judgment.
The indicator I have created this time compensates for this weakness by using the concept of RSI. As is well known, RSI is an indicator that shows the momentum of the market. RSI typically calculates the strength of the price increase during a 14-period by dividing the total upward movement by the total movement range. Similarly, I thought that if we divide the positive evaluations of the technical rating during a given period by the total evaluations, we could calculate the "momentum of the technical rating," which shows how often positive ratings have appeared during that period.
Below is the calculation formula.
1. Setting the Evaluation Period
Decide the period to calculate (e.g., 14 periods). This is denoted as `n`.
2. Total Positive Ratings of the Technical Rating
Calculate the total number of times the technical rating is evaluated as "strong buy" or "buy" during each period. This is called `positive_sum`.
3. Total Ratings
Count the total number of ratings (including buy, sell, and neutral) during the period. This is called `total_sum`.
4. Calculating the Upward Strength
Divide `positive_sum` by `total_sum` to calculate the ratio of positive ratings in the technical rating. This is called the "ratio of positive ratings."
The ratio of positive ratings, denoted as `P`, is calculated as follows:
P = positive_sum / total_sum
5. Calculating RRI
Following the calculation method of RSI, RRI is calculated by the following formula:
RRI = 100 - (100 / (1 + (P / (1 - P))))
As you can see, the calculation method is similar to that of RSI. Therefore, initially, I intended to name this indicator the Technical Rating RSI. However, RSI calculates based on the difference between the previous bar's price and the current bar's price, whereas this indicator calculates by summing the values of the technical ratings themselves. In the case of prices, if the difference between bars is zero, it indicates a flat market, but in the case of technical rating values, if 1.0 continues for two consecutive periods, it signifies an extremely strong buy rather than a flat market. For this reason, I decided that the calculation method could no longer be considered the same as the traditional RSI, and to avoid confusion, I chose to give this new indicator the name "Relative Rating Index" (RRI), as it provides a new type of numerical evaluation.
The information provided by this indicator is simple. When RRI exceeds 50, it means that more than 50% of the technical rating evaluations during the set period (I recommend 50 periods, but please determine the optimal value based on your timeframe) are buy evaluations. However, since there may be many false signals around exactly 50, I define it as buy-dominant when the value exceeds 60 and sell-dominant when it falls below 40. Additionally, if the graph itself is rising, it indicates that the buying momentum is strengthening, and if it is falling, it indicates that the selling momentum is increasing.
Furthermore, there are lines drawn at 90 and 10, but please note that unlike RSI, these do not indicate overbought or oversold conditions. When RRI exceeds 90, it means that over 90% of the technical rating evaluations during the specified period are buy evaluations, indicating an ongoing extremely strong buy trend. Until the RRI graph turns downward and falls below 90, it should rather be considered a buying opportunity.
With this new indicator, the technical rating becomes an indicator with depth, providing evaluations not only for the moment but over a specified period. I hope you find it helpful in your market analysis.

Directional Movement Index DEThis script uses the existing built-in DMI indicator but adds two lines indicating strength of the ADX trend. The original author J. Welles Wilder, indicated a ADX trending strongly above 25 (yellow by default), and ADX trending weaker at a threshold of 20 or below (dashed yellow by default).
The default colours have been changed so that ADX is yellow, +DI is green, and -DI is red.
Calculation
Calculating the DMI can actually be broken down into two parts. First, calculating the +DI and -DI, and second, calculating the ADX. To calculate the +DI and -DI you need to find the +DM and -DM (Directional Movement). +DM and -DM are calculated using the High, Low and Close for each period. You can then calculate the following:
Current High - Previous High = UpMove
Previous Low - Current Low = DownMove
If UpMove > DownMove and UpMove > 0, then +DM = UpMove, else +DM = 0
If DownMove > Upmove and Downmove > 0, then -DM = DownMove, else -DM = 0
Once you have the current +DM and -DM calculated, the +DM and -DM lines can be calculated and plotted based on the number of user defined periods.
+DI = 100 times Exponential Moving Average of (+DM / Average True Range)
-DI = 100 times Exponential Moving Average of (-DM / Average True Range)
Now that -+DX and -DX have been calculated, the last step is calculating the ADX.
ADX = 100 times the Exponential Moving Average of the Absolute Value of (+DI - -DI) / (+DI + -DI)
The basics
DMI has a value between 0 and 100 and is used to measure the strength of the current trend. +DI and -DI are then used to measure direction. When combined, the indicator can provide some valuable insight. A general interpretation would be that during a strong trend (ADX above 25 but dependent on the analyst's interpretation), when the +DI is above the -DI, then a Bullish Market is defined. When -DI is above +DI, then a Bearish Market is at hand.
One thing to be considered is that what DMI values determine, strength or a potential signal, is up to the trader's interpretation. Acceptable values may change depending on the financial instrument being examined, therefore some historical analysis of the instrument in question would be prudent. A technical analyst can make better decisions based on what has occurred in historical examples.
All credit goes to the original script .

Korneev Reverse RSIRethinking the Legendary Relative Strength Index by John Welles Wilder
The essence of the new approach lies in the reverse use of the so-called "overbought" and "oversold" zones. In his 1978 book, "New Concepts in Technical Trading Systems," where the RSI mechanism was thoroughly described, Wilder writes that one way to use the oscillator is to open a long position when the RSI drops into oversold territory (below 30) and to open a short position when the RSI rises to overbought levels (above 70). However, backtesting this strategy with such inputs yields rather mediocre results.
Based on the calculation formula, the RSI calculates the rate of price change over a certain period. Therefore, overbought and oversold zones will have relative significance (relative to the set calculation period). It is no coincidence that the word "relative" was added to the name of the oscillator. It is worth accepting as an axiom the assertion that the price of an asset is fair at every moment in time.
Essentially, the RSI calculates the strength of a trend. If the oscillator value is above 70, it is highly likely that an upward movement is occurring in the market. Therefore, in the current strategy, a long position is opened precisely at the moment of greatest buyer strength (when RSI > 80), i.e., in the direction of the trend, since counter-trend trading with the RSI has proven to be ineffective. The position is closed after the buyers lose their advantage and the RSI drops to 40.
The strategy is recommended to be used only with long positions, as short positions show negative results. The strategy uses a moving average for the RSI with a period of 14 to smooth the oscillator data.
--------------------------------------------------------------------------------------------
Переосмысление легендарного осциллятора Relative strength index Джона Уэллса Уайлдера
Суть нового подхода заключается в реверсивном использовании так называемых зон "перекупленности" и "перепроданности". В своей книге от 1978 года "New concepts in tecnical trading systems", в которой был подробно описан механизм работы RSI, Уайлдер пишет, что один из способов использования осциллятора - открытие длинной позиции при снижении RSI в перепроданность (ниже 30) и открытие короткой позиции при повышении RSI до перекупленности (выше 70). Однако бэктест стратегии с такими вводными дает весьма посредственные результаты.
Исходя из формулы расчета, RSI рассчитывает скорость изменения цены за определенный период. Поэтому зоны перекупленности и перепроданности будут иметь относительное значение (относительно установленного периода расчета). Не зря ведь в названии осциллятора было добавлено слово "относительной". Стоит принять за аксиому утверждение, что цена актива справедлива в каждый момент времени.
По сути, RSI рассчитывает силу тренда. Если значение осциллятора выше 70, то на рынке с высокой долей вероятности происходит восходящее движение. Поэтому в текущей стратегии открытие лонга происходит именно в момент наибольшей силы покупателей (когда RSI > 80), то есть в сторону тренда, поскольку контртрендовая торговля по RSI показала свою несостоятельность. Закрытие позиции происходит после того, как покупатели теряют преимущество и RSI снижается до 40.
Стратегию рекомендуется использовать только с длинными позициями, поскольку короткие позиции показывают отрицательный результат. В стратегии используется скользящая средняя для RSI с периодом 14 для сглаживания данных осциллятора.

ATR Price Targets w/POC
ATR Price Targets with Point of Control (POC):
This script is designed to help traders identify key price target levels based on configurable multipliers of the the Average True Range (ATR) and the volume based Point of Control (POC). It is intended for intraday traders looking to capture significant price movements.
Features:
ATR Price Targets: The script calculates three levels of price targets above and below the first bar of the day, based on the ATR of the last 22 days (assuming 5-minute candles). These targets are adjustable through the settings, allowing traders to set their own ATR multipliers.
Point of Control (POC): The POC is determined as the price level of the highest volume bar since the start time, providing an indication of the most traded price within the specified period.
Customizable Start Time: Traders can set their desired start time for the calculation of price targets and POC, allowing for flexibility in aligning the indicator with their trading strategy.
Plot Lines: The ATR price targets are plotted as lines for easy visualization on the chart.
Usage:
The ATR price targets can be used as potential take-profit or stop-loss levels.
The POC can serve as a key level for assessing market sentiment and potential reversals.
Traders can adjust the ATR multipliers and start time based on their specific trading style and market conditions.
Settings:
ATR Price Targets 1, 2, 3: Adjust the multipliers for the ATR price targets. By default, these are set to 1*ATR for T1+/T1-, 3*ATR for T2+/T2- and ATR*6 for T3+/T3-. Adjust with caution as the price targets found in defaults have proven to be more accurate over intraday cycles for volatile stocks.
Start Hour & Start Minute: Set the starting hour and minute for the calculations. By default, these are set to the opening 5 minute intraday bar, but can also be set to the opening bar of pre-market hours.

Volatility System by W. WilderVolatility System (Volatility Stops) Similarity
Most traders adjust their stops over time in the direction of the trend in order to lock in profits. Apart from moving averages, one of the most popular techniques is trailing stops using a multiple of Average True Range. There are several variations:
The original Volatility System(Volatility Stops), introduced by Welles Wilder in his 1978 book: New Concepts in Technical Trading Systems
Chandelier exits introduced by Alexander Elder in Come Into My Trading Room (2002) trail the stops from Highs or Lows rather than Closing Price
Average True Range Trailing Stops are similar to the above, but include a ratchet mechanism to prevent stops moving down during an up-trend or rising during a down-trend, as ATR increases
WillTrend intoduced by Larry Williams in 1988
Comparison of systems
All the systems under consideration have one common ingredient - ATR. ATR was developed by Welles Wilder and described in his book in 1978, also in this book the Volatility System was described, which in the future became known as Volatility Stops.
In fact, Wilder is the father of such systems due to the presence of ATR in the calculation of this type of indicator.
The main difference of Volatility System
Followers such as Larry Williams and Alexander Elder made minor changes to the value based on the ATR, mainly focusing on changing the base to which this value is added or subtracted.
Larry Williams uses the square root of 5 as a multiplier and calculates the ATR with a period of 66, and Alexander Elder uses a multiplier of 2.5-3.5 applying it to the ATR with a period of 22. Both authors changed the original value for ATR and multiplier calculations. Alexander Elder is closest to the original Welles Wilder calculation, which used a multiplier of 2.8.-3.1 applying it to an ATR with a period of 7.
As a reference, Elder took the Highest High(22) from which he subtracts ATR*Multiplier in an uptrend or the Lowest Low(22) to which he adds ATR*Multiplier to obtain the turning point (SAR).
Larry Williams uses the average price of extremes (Highest High(10) + Lowest Low(10)) / 2 as a reference base to which he adds or subtracts the ATR*Multilpyer values.
Both systems differ from the original, because Wilder used Significan Close(SIC) in his calculations. SIC is the maximum closing price during an uptrend and the minimum closing price during a downtrend, which
does not go beyond the current trade, as in other systems. To calculate the base when a trend changes, bars that are outside the current trend will be used when calculating WillTrend and Chandelier Exit, in contrast to the Volatility System, which takes SIC values only within the current trade. This is the main difference from subsequent developments of similar systems.
Improvements made
The original Volatility System is present as an indicator on TradingView, but it is an improved version with the addition of a ratchet and works differently from the original Weilder system.
List of improvements:
Added the ability to remove the ratchet. You need to turn off the "Trail one way" checkbox in the setting menu. When this function is turned off, the system will operate in the author-inventor mode. On some instruments, the original system works much better than the improved ratchet system, which cannot be turned off.
Added the ability to use Highest High and Lowest Low as a base instead of the closing price.
Volatility Stops Formula Description
Welles Wilder's system uses Closing Price and incorporates a stop-and-reverse feature (as with his Parabolic SAR).
Determine the initial trend direction
Calculate the Significant Close ("SIC"): the highest close reached in an up-trend or the lowest close in a down-trend
Calculate Average True Range ("ATR") for the selected period (7 days in this example)
Multiply ATR by the Multiple (3.0 in this example, best values author describes as 2.8-3.1)
The first stop is calculated in day 7 and plotted for day 8
If an up-trend, the first stop is SIC - 3 * ATR, otherwise SIC + 3 * ATR for a down-trend
Repeat each day until price closes below the stop (or above in a down-trend)
Set SIC equal to the latest Close, reverse the trend and continue.
Chandelier Exit Description
Chandelier Exits subtract a multiple of Average True Range ("ATR") from the highest high for the selected period. Using the default settings as an example:
Highest High in last 22 days - 3 * ATR for 22 days
In a down-trend the formula is reversed:
Lowest Low in last 22 days + 3 * ATR for 22 days
The time period must be long enough to capture the highest point of the recent up-trend: too short and the stops move downward; too long and the high may be taken from a previous down-trend.
It is not essential to use the same period for up and down trends; down-trends are notoriously faster than up-trends and may benefit from a shorter time period.
The multiple of 3 may be varied, but most traders settle between 2.5 and 3.5.
WillTrend Description
Larry Williams is prefer to used the Square Root from 5 as a multiplayer for ATR. SQRT(5) = 2.236
WillTrend subtract a multiple of Average True Range ("ATR") from the Middle Price (Highest High for the selected period + Lowest Low for the selected period / 2).
(Highest High in last 10 days + Lowest Low in last 10 days) / 2 - 2.236 * ATR for 66 days
In a down-trend the formula is reversed:
(Highest High in last 10 days + Lowest Low in last 10 days) / 2 + 2.236 * ATR for 66 days

Limit Order + ATR Stop-Loss [TANHEF]This indicator enables interactive placement of limit or stop-limit orders with a trailing ATR stop-loss and optional profit target (with alerts). Refer to the images below for further clarification.
Why use a trailing stop-loss?
A trailing stop-loss serves as an exit strategy when price moves against you, while also allowing you to adjust the exit point further into profit when price moves favorably. The ATR (Average True Range), a reliable measure of volatility, acts as an effective risk management tool, functioning as a trailing stop-loss.
Indicator Explanation
Initial indicator placement: Select Long Limit or Long-Stop Limit order.
Change Entry Type: Switch between Long and Short within settings.
Modify entry price: Drag circle, adjust in settings, or re-add indicator to chart.
Optional Profit Target: Use Risk/Reward ratio or specify price.
Entry anticipation: Estimated ATR stop-loss and profit target as blue circles (fluctuates with volatility changes).
Entry triggered: Actual ATR stop-loss and profit target plotted.
Exit conditions: Stop-loss or profit target hit, exit entry.
Update Frequency: Continuously, Bar Open, or Bar Open on entry then continuously.
ATR Overlap: no entry occurs if the ATR overlaps with price (stop-loss 'hit' already on entry bar)
Table: Displays input settings selected.
Show Only On Ticker: Ability to hide indicator on other tickers.
Long Limit
Long Stop-Limit
Short Limit
Short Stop-Limit
Alerts
1. 'Check' alerts to use within indicator settings (entry, trailing stop hit, profit target hit, and failed entry).
2. Select 'Create Alert'
3. Set the condition to 'Limit Order + ATR Stop-Loss''
4. Select create.
Additional details can be added to the alert message using these words in between Curly (Brace) Brackets:
{{trail}} = ATR trailing stop-loss (price)
{{target}} = Price target (price)
{{type}} = Long or Short stop-loss (word)
{{traildistance}} = Trailing Distance (%)
{{targetdistance}} = Target Distance (%)
{{starttime}} = Start time of position (day:hr:min)
{{maxdrawdown}} = max loss
{{maxprofit}} = max profit
{{update}} = stoploss update frequency
{{entrysource}} = entry as 1st bar source (yes/no)
{{triggerentry}} = Wick/Close Trigger entry input
{{triggerexit}} = Wick/Close Trigger exit input
{{triggertarget}} = Wick/Close Trigger target input
{{atrlength}} = ATR length input
{{atrmultiplier}} = ATR multiplier input
{{atrtype}} = ATR type input
{{ticker}} = Ticker of chart (word)
{{exchange}} = Exchange of chart (word)
{{description}} = Description of ticker (words)
{{close}} = Bar close (price)
{{open}} = Bar open (price)
{{high}} = Bar high (price)
{{low}} = Bar low (price)
{{hl2}} = Bar HL2 (price)
{{volume}} = Bar volume (value)
{{time}} = Current time (day:hr:min)
{{interval}} = Chart timeframe
{{newline}} = New line for text

Interactive SAR Stop-Loss [TANHEF]This indicator is "Interactive" which means some inputs can are manually added through the first click after adding the indicator to the chart (SAR Trailing Stop-loss start point).
Unlike the normal Parabolic SAR, this indicator allows for the modification of the start point of the Parabolic SAR’s first bar calculation. Normally, the Parabolic SAR automatically has a start point after the first bar of an asset’s historical price that will then switch between trailing above and below price respectively. It must be noted that due to how the first position of the Parabolic SAR is calculated, on occasion the Parabolic SAR will immediately flip on the next bar to the opposite side relative to price that it was just located. Modifying the setting “⭐Initial Interactive SAR Position Source”, then selecting either 'Clicked' or 'ATR' level as the vertical start position will prevent this. See images below for more explanation.
Why use a trailing stop-loss?
A trailing stop-loss provides an exit when price moves against you but also enables you to move the exit point further into profit when price is moving in the desired direction of a trade. The Parabolic SAR ( stop and reverse ) which is used to determine price direction as well as when price direction is changing, is very effective at functioning as a trailing stop loss.
Indicator Explanation
Initially when this indicator is added to the chart, you will be prompted to select where to begin the SAR Trailing Stop-loss.
For a long stop-loss, select below price.
For a short stop-loss, select above price.
After this indicator is placed, it can be modified via dragging or from within the settings by modifying the time and the price input. Or simply re-add the indicator to the chart. Another option is to have this Parabolic SAR begin directly on the price that was initially ‘Clicked’ or the ‘ATR’ level, which requires selecting the option in settings labeled “⭐Initial Interactive SAR Position Source”
The SAR Stop Loss plotted. Note that the calculation that occurs on this first bar of the ‘Interactive SAR’ is as if the prior bar was the oldest historical bar of the asset. Due to the SAR’s calculations, if the ‘Normal SAR’ were to also flip sides over to the position that has been manually set for the ‘Interactive SAR’, they won’t necessarily have the same result.
An optional fixed profit target can be added within the settings. This profit target will only actively be plotted when the SAR Trailing Stop-loss has not be hit yet or until the profit target has been hit.
Here shows that the profit target was hit, then later on the SAR Trailing Stop-loss was hit.
Note, trailing stop-loss will continue to be plotted until it has been hit regardless of the profit target being hit or not.
Here is an example of when the Parabolic SAR will immediately flip on the next bar to the opposite side relative to price that it was just first located. This is due to how the Parabolic SAR is calculated and will also occur with the traditional Parabolic SAR that is not interactively (manually) given a start location. To prevent this, either relocate this time in which this SAR beings or consider modifying the SAR’s (start, increment, max) settings specifically.
Here instead of using the SAR’s calculation for an initial bar, the ‘ATR’ was selected as the start point within the setting “⭐Initial Interactive SAR Position Source”.
Alerts
1. 'Check' alerts to use within indicator settings (trailing stop hit and/or profit target hit).
2. Select 'Create Alert'
3. Set the condition to 'Interactive SAR''
4. Select create.

Interactive ATR Stop-Loss [TANHEF]This indicator is "Interactive" which means some inputs can are manually added through the first click after adding the indicator to the chart (ATR Trailing Stop-loss start point). See images below for more explanation.
Why use a trailing stop-loss?
A trailing stop-loss provides an exit when price moves against you but also enables you to move the exit point further into profit when price is moving in the desired direction of a trade. The ATR (Average True Range) which is used to measure volatility, is very effective at functioning as a trailing stop loss.
Indicator Explanation
Initially when this indicator is added to the chart, you will be prompted to select where to begin the ATR Trailing Stop-loss.
For a long stop-loss, select below price.
For a short stop-loss, select above price.
After this indicator is placed, it can be modified via dragging or from within the settings by modifying the time and the price input. Or simply re-add the indicator to the chart.
The ATR Stop Loss plotted. Note that the trailing value that is considered as the stop loss value is the value of the ATR from the prior candle. The settings for the ATR calculation can be modified within the settings.
An optional fixed profit target can be added within the settings. This profit target will only actively be plotted when the ATR Trailing Stop-loss has not be hit hit yet or until the profit target has been hit.
Here shows that the profit target was hit, then later on the ATR Trailing Stop-loss was hit.
Note, trailing stop-loss will continue to be plotted until it has been hit regardless of the profit target being hit or not.
Alerts
1. 'Check' alerts to use within indicator settings (trailing stop hit and/or profit target hit).
2. Select 'Create Alert'
3. Set the condition to 'Interactive ATR''
4. Select create.

True Average Period Traded RangeTrue Average Period Trading Range (TAPTR)
The J. Welles Wilder Average True Range calculation includes the ability to calculate in gaps into the equation.
It is in my opinion that gaps are untraded range values until the prices on their own come back and close the gaps.
The TAPTR calculation is simple, it is the average for a set period of time of the HIGH - LOW.
The ATR average calculation is automatically set based on the timeframe period you are looking at.
12 Months (1 year) = 10 (1 decade)
Months = 12 (1 year)
Weeks = 12 (1 business quarter)
Days = 21 (1 trading month)
4 Hour = 9 (5 trading days)
1 Hour = 33 (5 trading days)
45 minutes = 9 (1 trading day)
30 minutes = 14 (1 trading day)
15 minutes = 28 (1 trading day)
10 minutes = 42 (1 trading day)
5 minutes = 85 (1 trading day)
1 minute = 420 (1 trading day)
default value = 21 (if using a timeframe not described above)
The "master trend" as being a 21 SMA.
The colored columns represent the actual range value for that time period.
Description of values from left to right.
1) Actual Trade Range Value for the time period you are viewing
2) % of price (in decimal, you need multiply by 100 to get the true percent)
3) Average Traded Range
4) % of price
5) .618 of Average Traded Range
6) % of price
7) Mean of #3 and #5
8) % of price
The % of price is displayed in its calculated form. You need to multiple the value by 100 if you want the actual percent.
Example: Displayed Value: 0.0246 = 2.46%
Why calculated form only? If the ranges are .72 and the % of price is 2.32 the indicator looks all jacked up like a redneck's pick-up.
However, if it is .0232, everything is to scale.
Why is % of price helpful?
If you are trading and are aware that average period traded range is 5%, you now have an idea of an average return if you could catch from low to high (or short high to low).
Bar Colors
RED is greater than 4.2x TAPTR
ORANGE is greater than 2.618x TAPTR but less than RED
YELLOW is greater than 1.618x TAPTR but less than ORANGE
GREEN is greater than .618x TAPTR but less than YELLOW
BLUE is less than GREEN
The colors of the bars represent how far from the Master Trend (21 SMA) the close is.
This is determined by taking the difference between the close and the 21 SMA and dividing by the current TAPTR.
EXAMPLE:
IF you have a RED bar, the close is greater than 4.2 TAPTRs away from the 21 SMA. This means that either prices will stall and remain flat until
the SMA comes to the prices or turn and return to the SMA.
If prices are greater than 4.2 TAPTR, that also represents that it is greater than 4 or more time periods from the mean if the return traded within the averages.

RSI Past Can Turn RSI Into a Directional ToolThe Relative Strength Index was created by J. Welles Wilder to measure overbought and oversold conditions. It’s also found popularity as an overall measure of direction because upward-trending stocks often hit overbought conditions. The opposite can be true with underperformers.
Today’s custom script, RSI Past, attempts to capture this secondary use of RSI as a directional indicator.
RSI Past achieves this by comparing how many bars have passed since RSI's most recent overbought and oversold readings. It then plots a simple difference between those two numbers.
Stocks with “bullish” signals will have positive readings that will increase each time RSI hits an overbought condition.
“Bearish” readings are just the opposite, growing more negative as oversold conditions occur.
An examination of some individual stocks may show the usefulness of this approach.
Meta Platforms , for example, hit an oversold condition almost exactly one year ago, and has remained under heavy selling pressure since:
Exxon Mobil , on the other hand, flipped to a bullish reading last October and has trended higher since:
This raises some interesting questions for Apple, shown on the main chart above. AAPL’s RSI Past has maintained a bullish reading for over a year -- unlike most other big technology stocks and the broader Nasdaq-100. Could this reflect bigger directional strength, especially with prices holding the $150 level that’s had relevance several times mid-2021?
TradeStation has, for decades, advanced the trading industry, providing access to stocks, options, futures and cryptocurrencies. See our Overview for more.
Important Information
TradeStation Securities, Inc., TradeStation Crypto, Inc., and TradeStation Technologies, Inc. are each wholly owned subsidiaries of TradeStation Group, Inc., all operating, and providing products and services, under the TradeStation brand and trademark. You Can Trade, Inc. is also a wholly owned subsidiary of TradeStation Group, Inc., operating under its own brand and trademarks. TradeStation Crypto, Inc. offers to self-directed investors and traders cryptocurrency brokerage services. It is neither licensed with the SEC or the CFTC nor is it a Member of NFA. When applying for, or purchasing, accounts, subscriptions, products, and services, it is important that you know which company you will be dealing with. Please click here for further important information explaining what this means.
This content is for informational and educational purposes only. This is not a recommendation regarding any investment or investment strategy. Any opinions expressed herein are those of the author and do not represent the views or opinions of TradeStation or any of its affiliates.
Investing involves risks. Past performance, whether actual or indicated by historical tests of strategies, is no guarantee of future performance or success. There is a possibility that you may sustain a loss equal to or greater than your entire investment regardless of which asset class you trade (equities, options, futures, or digital assets); therefore, you should not invest or risk money that you cannot afford to lose. Before trading any asset class, first read the relevant risk disclosure statements on the Important Documents page, found here: www.tradestation.com .

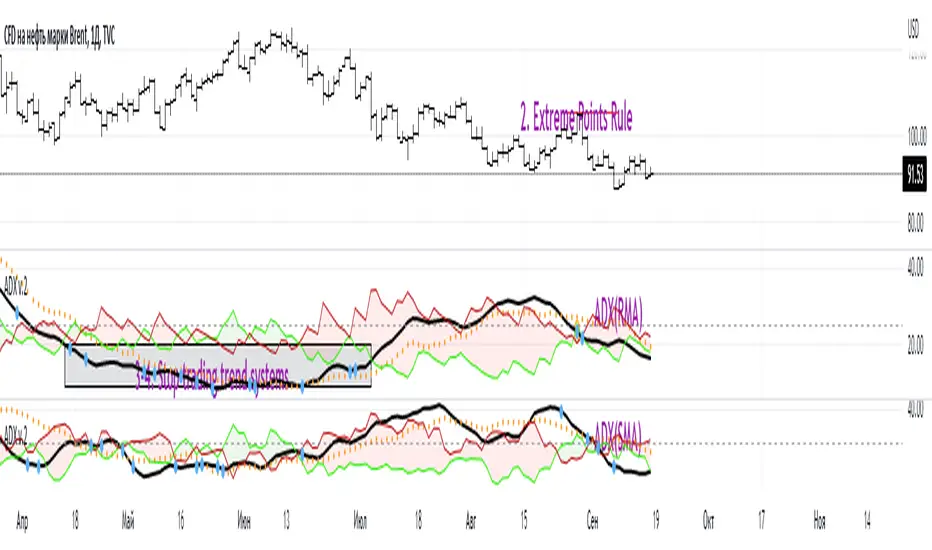
ADX W. Wilders(DI+, DI-, DX, ADXR, Equilibrium Point)The reason for publishing the script was the lack of display of important components in the standard ADX indicator, such as DI+, DI-, DX , ADXR, and the absence of a choice of methods for calculating moving averages in the indicator.
According to the book by the author of the ADX indicator, W. Wilder, the indicator components were calculated using the SMA formula, however, the RMA moving average is used in the code of the built-in indicator in TradingView, which shows excellent results, but this is not a classic calculation method. In addition to SMA and RMA, there are also EMA , HMA , WMA , VWMA moving averages to choose from. Added the ability to display lines ADX , ADXR , DX , DI+, DI- and Equilibrium points (when DI+ and DI- are equal or intersect).
ADX Trading Rules
1. Trade the intersections of DI+ and DI-
2. Extreme Point Rule(EPR). EPR is formed when DI+, DI- (Equilibrium point) crosses, forming a trend reversal point at the extremum of the current bar. In the example on the ADX RMA chart, the DI- line is above DI+. Being in a short position at the reverse intersection of the DI- and DI + lines, it is necessary to take the high price of the crossing bar for the reversal point, upon breakdown of which, turn to long. In this example, the breakdown did not take place and the short position remained active, despite the intersection of the DI+ lines over DI-. This rule is an excellent filter that removes unnecessary transactions in the trading system.
3. DI+ > ADX and DI- > ADX. Stop trading trend-following systems.
4. If ADXR > 25, the trading system will be profitable. With ADXR < 20, trend-following systems need to stop trading. Many mistakenly use ADX values instead of ADXR . The author explicitly pointed to ADXR in his book.
5. Equilibrium Point - balance points. The accumulation of these points on the chart means the presence of a flat in the market. Accumulation often appears on a declining ADX after a top has been established on the ADX indicator. The smaller the distance between the points, the less significant movements occurred in the market.
6. For intraday trading of cryptocurrencies use can the following ADX settings:
DI Length = 100
ADX Smoothing = 14
MA Type = VWMA
Flat Zone = 30
P.S. Fragment from an interview with W. Wilder:
OH: You are probably best known for inventing the Relative Strength Index ( RSI ), Average Directional Index ( ADX ) and Average True Range (ATR). Which of these is the most powerful tool for a trader?
WW: The ADX .
OH: Is it the indicator you are most proud of?
WW: I guess so.
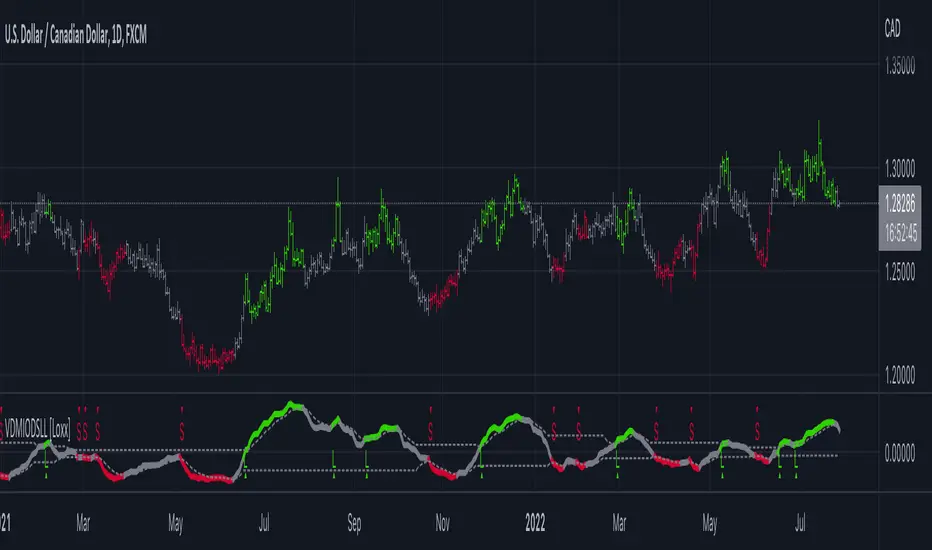
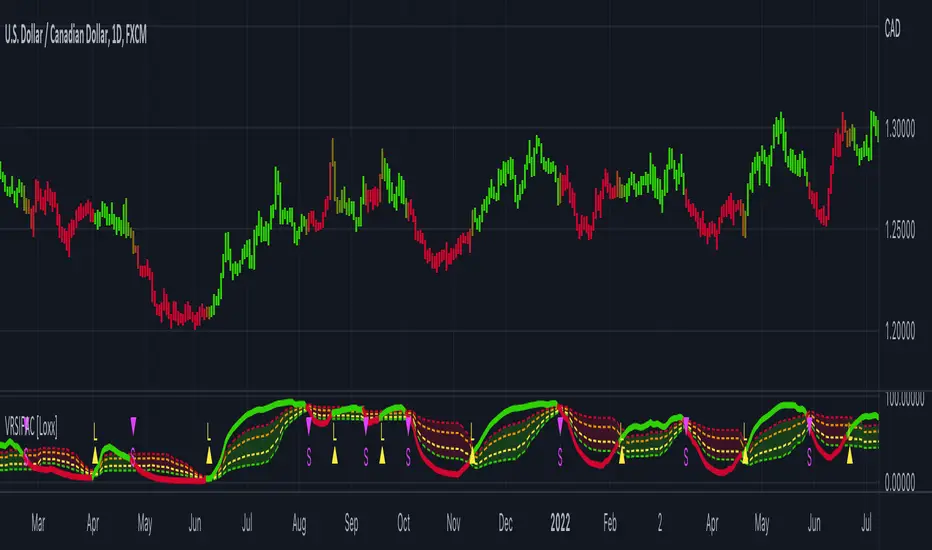
VIDYA DMI Oscillator w/ DSL Levels [Loxx]VIDYA DMI Oscillator w/ DSL Levels is a VIDYA smoothed Direction Movement Index with Discontinued Signals. These two add on features allow for more accurate signals by reducing noise.
What is the Direction Movement Index?
Within the suite of indicators that make up Wilder’s directional movement index (DMI) are the plus directional movement indicator (+DI) and the minus directional movement indicator (-DI). They provide the foundation for the more widely recognized average directional index (ADX). Whereas the ADX offers information about the strength of price movement but not its direction, the +DI and -DI furnish information about the positive or negative direction of price movement over a period of time.
Wilder provides complete information about the function and construction of all the components that make up the directional movement index in his 1978 book, New Concepts In Technical Trading Systems. In general, the plus and minus components of the DMI focus on that portion of the current bar’s trading range that is outside the range of the previous price bar. If it is higher, it is considered to be positive (+) and if it is lower, it is labeled negative (-). These values are divided by the true range and averaged over time, usually 14 periods. A move by the +DI above the -DI indicates that positive or upward price direction has overtaken negative or downward price direction. Conversely, when +DI falls below -DI, declining price either from selling pressure or lack of upward price momentum is taking control. Potential changes in direction or trend occur when the lines intersect.
What is VIDYA?
VIDYA (Chande's Variable Index Dynamic Average) is an adaptive weighted moving average indicator. It was developed by Tushar Chande as an attempt to improve the performance of the EMA (Exponential Weighted Moving Average) indicator.
Included:
Bar coloring
3 signal variations w/ alerts
4 intermediate smoothing types
Loxx's Expanded Source Types
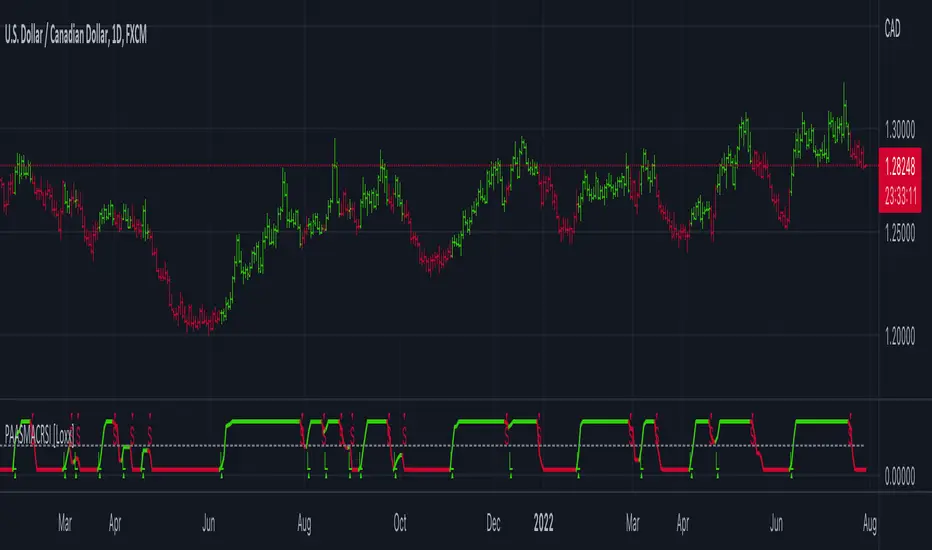
PA-Adaptive, Stepped-MA of Composite RSI [Loxx]PA-Adaptive, Stepped-MA of Composite RSI is an RSI indicator using a different kind of RSI called Composite RSI. This indicator is Phase Accumulation Cycle Adaptive and uses a stepped moving average.
What is Composite RSI?
The name of the composite RSI might mislead a bit.
Composite RSI is not "compositing" RSIs but is a rather new way of calculating the RSI. Unlike the RSI that is a sort of a momentum indicators, composite RSI is more a trending indicator. It tends to filter out insignificant price changes and seems to be good in identifying the underlying trends.
What is the Phase Accumulation Cycle?
The phase accumulation method of computing the dominant cycle is perhaps the easiest to comprehend. In this technique, we measure the phase at each sample by taking the arctangent of the ratio of the quadrature component to the in-phase component. A delta phase is generated by taking the difference of the phase between successive samples. At each sample we can then look backwards, adding up the delta phases.When the sum of the delta phases reaches 360 degrees, we must have passed through one full cycle, on average.The process is repeated for each new sample.
The phase accumulation method of cycle measurement always uses one full cycle’s worth of historical data.This is both an advantage and a disadvantage.The advantage is the lag in obtaining the answer scales directly with the cycle period.That is, the measurement of a short cycle period has less lag than the measurement of a longer cycle period. However, the number of samples used in making the measurement means the averaging period is variable with cycle period. longer averaging reduces the noise level compared to the signal.Therefore, shorter cycle periods necessarily have a higher out- put signal-to-noise ratio.
Included
Bar coloring
Signals
Alerts
Loxx's Expanded Source Types
Loxx's Special Phase Accumulation Cycle
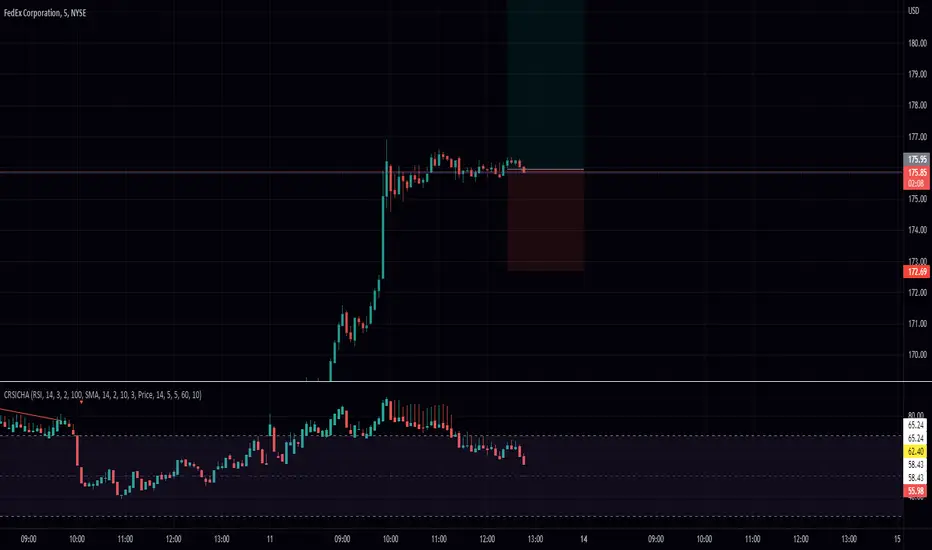
RSI Candle with Connors RSI and Heikin Ashi (CRSICHA)This script was designed to work and feel like the built in RSI script but with a lot of added feature that traders might enjoy. You get to see the RSI represented as candle sticks OR Heikin Ashi. I have added in Connors RSI as a bonus so you can see what this lesser used study looks like in candle form. Just like in the original script I have moving averages and Bollinger Bands. I must say, Heikin Ashi really excells in this situation because you don't need to know an exact price! As always I hope every one finds this useful! Enjoy!
Variety RSI w/ Dynamic Zones [Loxx]Variety RSI w/ Dynamic Zones is an indicator with 7 different RSI types with Dynamic Zones. This indicator has signal crossing options for signal, middle, and all Dynamic Zone levels.
What is RSI?
The relative strength index ( RSI ) is a momentum indicator used in technical analysis . RSI measures the speed and magnitude of a security's recent price changes to evaluate overvalued or undervalued conditions in the price of that security.
The RSI is displayed as an oscillator (a line graph) on a scale of zero to 100. The indicator was developed by J. Welles Wilder Jr. and introduced in his seminal 1978 book, New Concepts in Technical Trading Systems.
The RSI can do more than point to overbought and oversold securities. It can also indicate securities that may be primed for a trend reversal or corrective pullback in price. It can signal when to buy and sell. Traditionally, an RSI reading of 70 or above indicates an overbought situation. A reading of 30 or below indicates an oversold condition.
What are Dynamic Zones?
As explained in "Stocks & Commodities V15:7 (306-310): Dynamic Zones by Leo Zamansky, Ph .D., and David Stendahl"
Most indicators use a fixed zone for buy and sell signals. Here’ s a concept based on zones that are responsive to past levels of the indicator.
One approach to active investing employs the use of oscillators to exploit tradable market trends. This investing style follows a very simple form of logic: Enter the market only when an oscillator has moved far above or below traditional trading lev- els. However, these oscillator- driven systems lack the ability to evolve with the market because they use fixed buy and sell zones. Traders typically use one set of buy and sell zones for a bull market and substantially different zones for a bear market. And therein lies the problem.
Once traders begin introducing their market opinions into trading equations, by changing the zones, they negate the system’s mechanical nature. The objective is to have a system automatically define its own buy and sell zones and thereby profitably trade in any market — bull or bear. Dynamic zones offer a solution to the problem of fixed buy and sell zones for any oscillator-driven system.
An indicator’s extreme levels can be quantified using statistical methods. These extreme levels are calculated for a certain period and serve as the buy and sell zones for a trading system. The repetition of this statistical process for every value of the indicator creates values that become the dynamic zones. The zones are calculated in such a way that the probability of the indicator value rising above, or falling below, the dynamic zones is equal to a given probability input set by the trader.
To better understand dynamic zones, let's first describe them mathematically and then explain their use. The dynamic zones definition:
Find V such that:
For dynamic zone buy: P{X <= V}=P1
For dynamic zone sell: P{X >= V}=P2
where P1 and P2 are the probabilities set by the trader, X is the value of the indicator for the selected period and V represents the value of the dynamic zone.
The probability input P1 and P2 can be adjusted by the trader to encompass as much or as little data as the trader would like. The smaller the probability, the fewer data values above and below the dynamic zones. This translates into a wider range between the buy and sell zones. If a 10% probability is used for P1 and P2, only those data values that make up the top 10% and bottom 10% for an indicator are used in the construction of the zones. Of the values, 80% will fall between the two extreme levels. Because dynamic zone levels are penetrated so infrequently, when this happens, traders know that the market has truly moved into overbought or oversold territory.
Calculating the Dynamic Zones
The algorithm for the dynamic zones is a series of steps. First, decide the value of the lookback period t. Next, decide the value of the probability Pbuy for buy zone and value of the probability Psell for the sell zone.
For i=1, to the last lookback period, build the distribution f(x) of the price during the lookback period i. Then find the value Vi1 such that the probability of the price less than or equal to Vi1 during the lookback period i is equal to Pbuy. Find the value Vi2 such that the probability of the price greater or equal to Vi2 during the lookback period i is equal to Psell. The sequence of Vi1 for all periods gives the buy zone. The sequence of Vi2 for all periods gives the sell zone.
In the algorithm description, we have: Build the distribution f(x) of the price during the lookback period i. The distribution here is empirical namely, how many times a given value of x appeared during the lookback period. The problem is to find such x that the probability of a price being greater or equal to x will be equal to a probability selected by the user. Probability is the area under the distribution curve. The task is to find such value of x that the area under the distribution curve to the right of x will be equal to the probability selected by the user. That x is the dynamic zone.
Included
RSI source pre-smoothing options
Bar coloring
4 types of signal crossing options
Alerts
Loxx's Expanded Source Types
Loxx's RSI Variety RSI types

Variety RSI w/ Fibonacci Auto Channel [Loxx]Variety RSI w/ Fibonacci Auto Channel is an RSI indicator with 7 different RSI types and 4 Fibonacci Channels. This indicator has signal crossing options for signal, middle, and all Fibonacci levels. Bar and fill coloring is using a signal-determinant gradient coloring system to show signal strength or weakness.
What is RSI?
The relative strength index (RSI) is a momentum indicator used in technical analysis. RSI measures the speed and magnitude of a security's recent price changes to evaluate overvalued or undervalued conditions in the price of that security.
The RSI is displayed as an oscillator (a line graph) on a scale of zero to 100. The indicator was developed by J. Welles Wilder Jr. and introduced in his seminal 1978 book, New Concepts in Technical Trading Systems.
The RSI can do more than point to overbought and oversold securities. It can also indicate securities that may be primed for a trend reversal or corrective pullback in price. It can signal when to buy and sell. Traditionally, an RSI reading of 70 or above indicates an overbought situation. A reading of 30 or below indicates an oversold condition.
Included
Bar coloring
6 types of signal crossing options
Alerts
Loxx's Expanded Source Types
Loxx's RSI Variety RSI types
Pips-Stepped MA of RSI Adaptive EMA [Loxx]Pips-Stepped MA of RSI Adaptive EMA is a pips-stepping, adaptive moving average that first, filers source input price using an EMA calculated using an RSI-modified alpha value and second, and last, its plugged into a pips-stepping algorithm to output the final chart signals. This is mainly a forex indicator although it can be used for any asset, but you must adjust the step size to pips relative to the asset, For Bitcoin this may be 5000 or more.
Included
Bar coloring
Signals
Alerts
Loxx's Expanded Source Types
Loxx's RSI Variety RSI types
