Channel Based Zigzag [HeWhoMustNotBeNamed]🎲 Concept
Zigzag is built based on the price and number of offset bars. But, in this experiment, we build zigzag based on different bands such as Bollinger Band, Keltner Channel and Donchian Channel. The process is simple:
🎯 Derive bands based on input parameters
🎯 High of a bar is considered as pivot high only if the high price is above or equal to upper band.
🎯 Similarly low of a bar is considered as pivot low only if low price is below or equal to lower band.
🎯 Adding the pivot high/low follows same logic as that of regular zigzag where pivot high is always followed by pivot low and vice versa.
🎯 If the new pivot added is of same direction as that of last pivot, then both pivots are compared with each other and only the extreme one is kept. (Highest in case of pivot high and lowest in case of pivot low)
🎯 If a bar has both pivot high and pivot low - pivot with same direction as previous pivot is added to the list first before adding the pivot with opposite direction.
🎲 Use Cases
Can be used for pattern recognition algorithms instead of standard zigzag. This will help derive patterns which are relative to bands and channels.
Example: John Bollinger explains how to manually scan double tap using Bollinger Bands in this video: www.youtube.com This modified zigzag base can be used to achieve the same using algorithmic means.
🎲 Settings
Few simple configurations which will let you select the band properties. Notice that there is no zigzag length here. All the calculations depend on the bands.
With bands display, indicator looks something like this
Note that pivots do not always represent highest/lowest prices. They represent highest/lowest price relative to bands.
As mentioned many times, application of zigzag is not for buying at lower price and selling at higher price. It is mainly used for pattern recognition either manually or via algorithms. Lets build new Harmonic, Chart patterns, Trend Lines using the new zigzag?
Zigzag

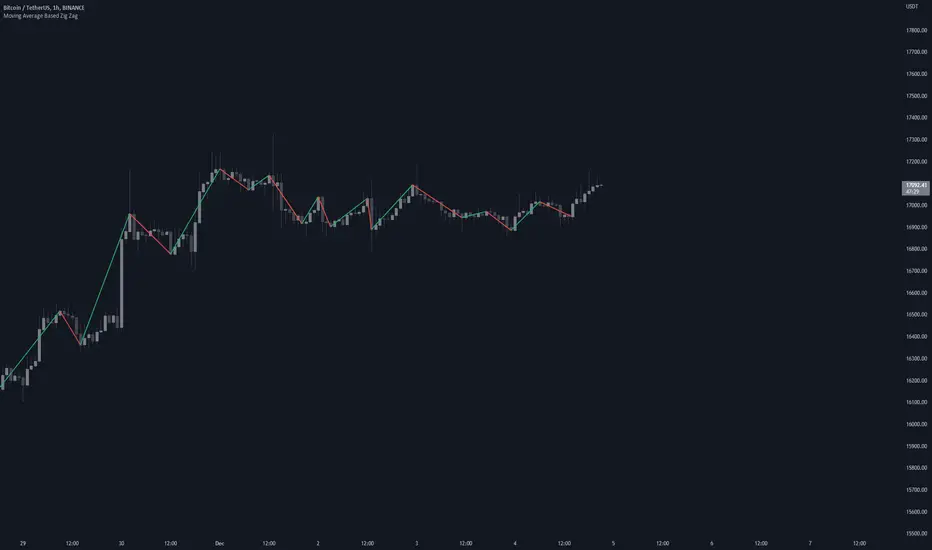
Moving Average Based Zig ZagMoving Average Based Zig Zag differs from the traditional Zig Zag indicator in that pivot points are determined by a moving average, Volume Weighted Hull Moving Average, rather than looking for the highest or lowest point in a left / right period.
Settings
Source: the source for the pivot points.
Moving Average Length: the length of the Volume Weighted Hull Moving Average, increase for longer zig zags, decrease for shorter zig zags.
Usage
Like all Zig Zag indicators, the Moving Average Based Zig Zag is not intended to be used as a live trading tool. This indicator is intended to be an alternative way of determining pivot points on your chart. Pivot points can be used for a multitude of different analytical techniques. One may use pivot points in order to draw potential support and resistance lines, trend lines or chart patterns. Additionally, pivot points can be used to determine variations of highs and lows important to market structure analysis such as break of structure or change of character.
Details
The moving average used is a Volume Weighted Hull Moving Average, this particular moving average was used due to it's relatively low-lag characteristics when compared to an Exponential Moving Average, additionally by considering volume in the moving average calculation, insignificant pivot points can be further filtered.
Rather than using built-in functions `ta.pivothigh()` and `ta.pivotlow()` to determine pivot points, this indicator waits for the moving average to pivot then searches for the highest or lowest value from the bar index of the moving average pivot to the bar index of the previous found price pivot. This method of determining pivots provides a more dynamic approach to determining pivot points.
Davin's 10/200MA Pullback on SPY Strategy v2.0Strategy:
Using 10 and 200 Simple moving averages, we capitalize on price pullbacks on a general uptrend to scalp 1 - 5% rebounds. 200 MA is used as a general indicator for bullish sentiment, 10 MA is used to identify pullbacks in the short term for buy entries.
An optional bonus: market crash of 20% from 52 days high is regarded as a buy the dip signal.
An optional bonus: can choose to exit on MA crossovers using 200 MA as reference MA (etc. Hard stop on 50 cross 200)
Recommended Ticker: SPY 1D (I have so far tested on SPY and other big indexes only, other stocks appear to be too volatile to use the same short period SMA parameters effectively) + AAPL 4H
How it works:
Buy condition is when:
- Price closes above 200 SMA
- Price closes below 10 SMA
- Price dumps at least 20% (additional bonus contrarian buy the dip option)
Entry is on the next opening market day the day after the buy condition candle was fulfilled.
Sell Condition is when:
- Prices closes below 10 SMA
- Hard stop at 15% drawdown from entry price (adjustable parameter)
- Hard stop at medium term and long term MA crossovers (adjustable parameters)
So far this strategy has been pretty effective for me, feel free to try it out and let me know in the comments how you found :)
Feel free to suggest new strategy ideas for discussion and indicator building

Trend/Retracement - ZigZag - New wayZigZag for Trend and Retracements - New way
It's another way to plot ZigZag based on lookback period for trend and % of trend lookback period to plot retracements.
█ OVERVIEW
Plot ZigZag, Trend lines, Retracements, Support levels, Resistance levels
█ Objective:
Draw ZigZag lines along with unbroken support and resistance levels. ZigZag lines are drawn for main trend and the retracements.
Main Trend – This is calculated based on lookback period.
Retracements – Retracements are calculated as 25% of main trend.
Support and Resistance line: The indicator draws 2 types of support and resistance lines
1. Un-broken – Once formed (plotted), these are the support and resistance which are not yet broken
2. Tested – One can also choose to see support and resistance lines which are tested but not broken. Tested support/resistance are those levels which are touched by high/low price but close price has not crossed the level.
█ How main trend point is calculated:
E.g.
Chart timeframe = 15m
Lookback period = 250
Retracement = 25% of main trend ( 25% of 250 = 62 )
A price point on a chart is considered as trend point if distance between current price and previous highest price is 250 candles
A price point is considered as a retracement if distance between current price and previous highest price is 62 candles. Please note retracements are calculated only after finding a main trend point.
█ Input parameters:
Zigzag Parameters
Use predefined Lookback – If checked pre-defined timeframe-based lookback parameters are used.
Trend lookback candles – If ‘Use predefined Lookback’ is unchecked then this value is used as lookback period.
Retracement % of look back candles– If ‘Use predefined Lookback’ is unchecked then this value is used for calculating retracement lookback period
Mark retracements – If unchecked only main trend lines are plotted
Plot support/resistance – To plot support/resistance levels
Show support/resistance tested lines – If checked tested support/resistance liens are shown on the chart
█ TF based Lookback period config (Defaults are set as specified below, One can change these defaults to use different lookback periods)
The defaults set here are used based on the chart timeframe. e.g. if chart timeframe is changed from say 15m to 60m then 60m chart defaults (i.e. trend lookback = 90) are used to plot the trend and the retracements. At the bottom-right of the chart, parameters used for plotting are displayed all the time.
Timeframe in minute – Default = 5m
Trend lookback candles – Default = 375 (~ 5 days of data)
Timeframe in minute – Default = 15m
Trend lookback candles – Default = 250 (~10 days of data)
Timeframe in minute – Default = 60m
Trend lookback candles = Default = 90 (~ 15 days of data)
Trend lookback candles for timeframe 'D' – Default = 30 (~1 month data)
Trend lookback candles for timeframe 'W' – Default = 21 (~6 months data)
Trend lookback candles for timeframe 'M' – Default = 12 (~1year data)
Retracement % of look back candles – Default = 25%
█ When and where one can use this indicator (Refer to chart examples)
To view support and resistance based on lookback period
To view ZigZag lines
One can use it to find chart patterns easily
Trend and retracement lines can help in drawing Elliott waves.
█ Chart examples:
1. Chart patterns can be easily identified - One can disable the candle charts which will help to identify and draw chart patterns easily
2. Trend and retracement lines can also help is analyzing charts (e.g. Elliott Waves can be marked based on trend lines)
3. Tested but not broken support and resistance lines can be viewed
4. You can select 'NOT' to plot tested support and resistance lines
5. Uncheck the Mark retracements to plot main trend lines (Retracements are not marked)

RSI + MA, LinReg, ZZ (HH HL LH LL), Div, Ichi, MACD and TSI HistRelative Strength Index with Moving Average, Linear Regression, Zig Zag (Highs and Lows), Divergence, Ichimoku Cloud, Moving Average Convergence Divergence and True Strength Index Histogram
This script is based on zdmre's RSI script, I revamped a lot of things and added a few indicators from ParkF's RSI script.
Disable Labels in the Style tab and the histogram if you don't enlarge the indicator and it seems too small.
Look to buy in the oversold area and bounce of the support of the linear regression.
Look to sell in the overbought area and bounce of the resistance of the linear regression.
Look for retracement to the moving average or horizontal lines, and divergences for potential reversal.
RSI
The Relative Strength Index (RSI) is a well versed momentum based oscillator which is used to measure the speed (velocity) as well as the change (magnitude) of directional price movements.
Moving Average
Moving Average (MA) is a good way to gauge momentum as well as to confirm trends, and define areas of support and resistance.
Linear Regression
The Linear Regression indicator visualizes the general price trend of a specific part of the chart based on the Linear Regression calculation.
Zig Zag (Highs and Lows)
The Zig Zag indicator is used to identify price trends, and in doing so plots points on the chart to mark whenever prices reverse by a larger percentage point than a predetermined variable or marker.
Divergence
The divergence indicator warns traders and technical analysts of changes in a price trend, oftentimes that it is weakening or changing direction.
Ichimoku Cloud
The Ichimoku Cloud is a package of multiple technical indicators that signal support, resistance, market trend, and market momentum.
MACD and TSI Histogram
MACD can be used to identify aspects of a security's overall trend.
The True Strength Index indicator is a momentum oscillator designed to detect, confirm or visualize the strength of a trend.

RSI TrendRSI Hull Trend is a hybrid indicator with RSI of HULL Signal. The Hull MA is combined with RSI to see if the Hull MA Buy/Sell Signal is in overbought or oversold condition. Buy Sell Signals are plotted based on settings of OB/OS or RSI. This indicator is very useful to see if the Trend is in Exhaustion or Beginning of a Trend. Entry and Exit conditions can be more precise based on OB/OS condition of price action. In addition normal RSI trend is plotted with trend color from Hull MA. Best Performance with Heiken Ashi Candles.
OB/OS Settings provided
Hull Buy/Sell Signals plotted
Double RSI FAST and DEFAULT signal with crossover
Bar Color applied based on Hull RSI Trend
Hull Trend + RSI + Price Action

PharshK RSI and Zigzag with H/LIt is with RSI level
and Zigzag Pattern that Market goes on Maximum level and Lower Level
And it is also Showing High and Law Level of last Moving Candle so it is easy to entry and Hold

PharshK RSI and Zigzag with H/LIt is with RSI level
and Zigzag Pattern that Market goes on Maximum level and Lower Level
And it is also Showing High and Law Level of last Moving Candle so it is easy to entry and Hold

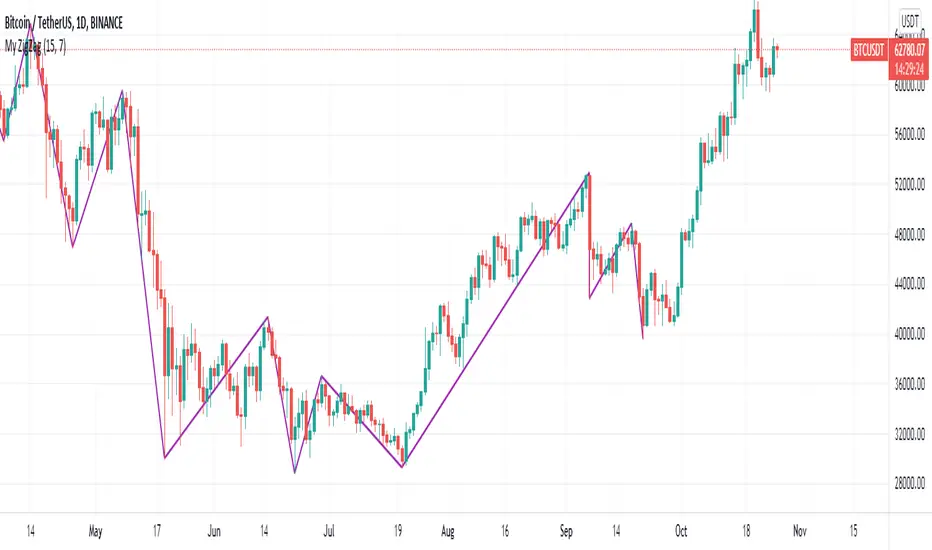
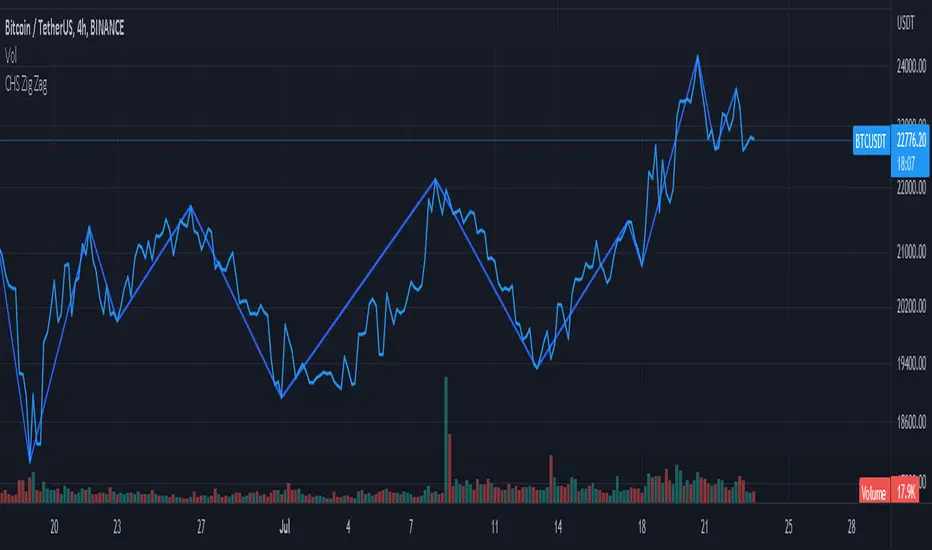
CHS Zig ZagCHS ZigZag stands for Changeable Source ZigZag
The original ZigZag indicator offered by TradingView doesn't have the ability to measure the tips and troughs based on closing prices (line chart), however, this indicator is capable of receiving an input from user that determines the price source used for further calculations.
The default inputs of the original ZigZag indicator have been also changed in order to make it adapt to pivots formed on line chart but users can change arbitrarily.
Structured zigzag support&resistance [LM]Hello Traders,
I would like to introduce you Structured zigzag support&resistance. It is based on the ZigZag semafor script made by DevLucem so shout out to him
The indicator is used to spot future multi-level Supports and Resistance zones. It is also useful to spot HL or LL or HH or LH zones
I's the same zigzag indicator as my other zigzag indicator with highlight on diagonal lines(highs and lows are automatically classified and also new types of diagonal lines that connects low or highs and extends to right are drawn )
It has two settings:
Fist is to control horizontal lines and zigzag setting
Second is to control diagonal lines
I hope you will enjoy it as I enjoyed to write it.
Lukas


RSI Divergence Scanner by zdmreDivergence is when the price of an asset is moving in the opposite direction of a technical indicator, such as an oscillator, or is moving contrary to other data. Divergence warns that the current price trend may be weakening, and in some cases may lead to the price changing direction.
If the stock is rising and making new highs, ideally the RSI is reaching new highs as well. If the stock is making new highs, but the RSI starts making lower highs, this warns the price uptrend may be weakening. This is negative divergence.
Positive divergence is the opposite situation. Imagine the price of a stock is making new lows while the RSI makes higher lows with each swing in the stock price. Investors may conclude that the lower lows in the stock price are losing their downward momentum and a trend reversal may soon follow.
Divergence is one of the common uses of many technical indicators, primarily the oscillators.
Use it at your own risk

Support and Resistance Multiperiod (Zig Zag Based)Support and Resistance Multiperiod (Zig Zag Based)
What is the indicator?
• The indicator is a multi period (up to 5 lengths) Support and Resistance indicator calculated based on Zig Zag.
Who can use?
Scalpers to Long term investors
What timeframe to use?
• Any timeframe
What are the lines?
• Green lines are Support levels.
• Orange lines are Resistance levels.
How to use?
• Buy Low and Sell High.
• Brighter zones means strong Support or Resistance.
• Weaker zones appear lighter.
• Brighter zones are formed by overlapping of lines from multiple levels of support or resistance.
Indicator Menu
• The indicator can input 5 different Lengths.
• The default settings uses 13, 21, 52, 100 & 200.
• Every option are customizable.

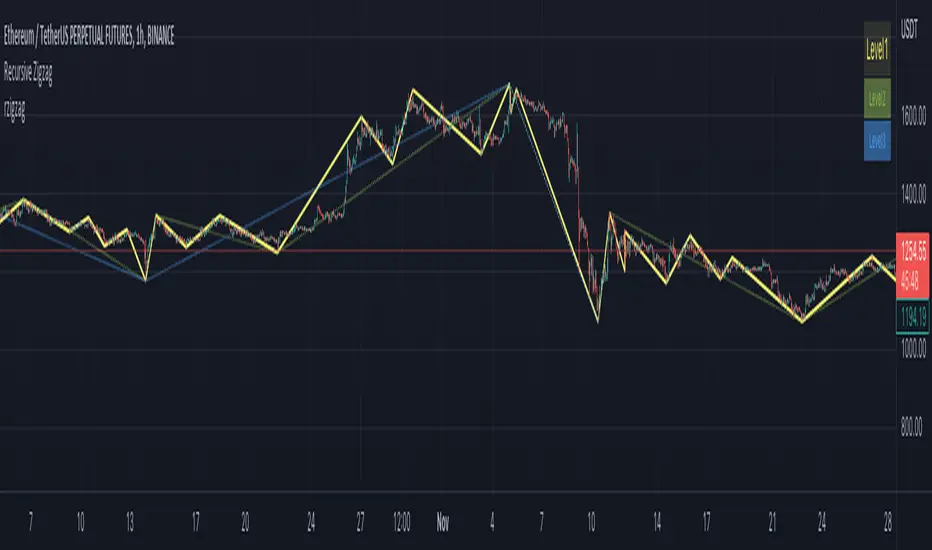
rzigzagLibrary "rzigzag"
Recursive Zigzag Using Matrix allows to create zigzags recursively on multiple levels. After bit of consideration, decided to make this public.
zigzag(length, ohlc, numberOfPivots, offset)
calculates plain zigzag based on input
Parameters:
length : Zigzag Length
ohlc : Array containing ohlc values. Can also contain custom series
numberOfPivots : Number of max pivots to be returned
offset : Offset from current bar. Can be used for calculations based on confirmed bars
Returns:
nextlevel(zigzagmatrix, numberOfPivots)
calculates next level zigzag based on present zigzag coordinates
Parameters:
zigzagmatrix : Matrix containing zigzag pivots, bars, bar time, direction and level
numberOfPivots : Number of max pivots to be returned
Returns: matrix zigzagmatrix
draw(zigzagmatrix, newPivot, doublePivot, lineColor, lineWidth, lineStyle, showLabel, xloc)
draws zigzag based on the zigzagmatrix input
Parameters:
zigzagmatrix : Matrix containing zigzag pivots, bars, bar time, direction and level
newPivot : Flag indicating there is update in the pivots
doublePivot : Flag containing there is double pivot update on same bar
lineColor : Zigzag line color
lineWidth : Zigzag line width
lineStyle : Zigzag line style
showLabel : Flag to indicate display pivot labels
xloc : xloc preference for drawing lines/labels
Returns:
draw(length, ohlc, numberOfPivots, offset, lineColor, lineWidth, lineStyle, showLabel, xloc)
calculates and draws zigzag based on zigzag length and source input
Parameters:
length : Zigzag Length
ohlc : Array containing ohlc values. Can also contain custom series
numberOfPivots : Number of max pivots to be returned
offset : Offset from current bar. Can be used for calculations based on confirmed bars
lineColor : Zigzag line color
lineWidth : Zigzag line width
lineStyle : Zigzag line style
showLabel : Flag to indicate display pivot labels
xloc : xloc preference for drawing lines/labels
Returns:
drawfresh(zigzagmatrix, zigzaglines, zigzaglabels, lineColor, lineWidth, lineStyle, showLabel, xloc)
draws fresh zigzag for all pivots in the input matrix.
Parameters:
zigzagmatrix : Matrix containing zigzag pivots, bars, bar time, direction and level
zigzaglines : array to which all newly created lines will be added
zigzaglabels : array to which all newly created lables will be added
lineColor : Zigzag line color
lineWidth : Zigzag line width
lineStyle : Zigzag line style
showLabel : Flag to indicate display pivot labels
xloc : xloc preference for drawing lines/labels
Returns:
PivotsLibrary "Pivots"
This Library focuses in functions related to pivot highs and lows and some of their applications (i.e. divergences, zigzag, harmonics, support and resistance...)
pivots(srcH, srcL, length) Delivers series of pivot highs, lows and zigzag.
Parameters:
srcH : Source series to look for pivot highs. Stricter applications might source from 'close' prices. Oscillators are also another possible source to look for pivot highs and lows. By default 'high'
srcL : Source series to look for pivot lows. By default 'low'
length : This value represents the minimum number of candles between pivots. The lower the number, the more detailed the pivot profile. The higher the number, the more relevant the pivots. By default 10
Returns:
zigzagArray(pivotHigh, pivotLow) Delivers a Zigzag series based on alternating pivots. Ocasionally this line could paint a few consecutive lows or highs without alternating. That happens because it's finding a few consecutive Higher Highs or Lower Lows. If to use lines entities instead of series, that could be easily avoided. But in this one, I'm more interested outputting series rather than painting/deleting line entities.
Parameters:
pivotHigh : Pivot high series
pivotLow : Pivot low series
Returns:
zigzagLine(srcH, srcL, colorLine, widthLine) Delivers a Zigzag based on line entities.
Parameters:
srcH : Source series to look for pivot highs. Stricter applications might source from 'close' prices. Oscillators are also another possible source to look for pivot highs and lows. By default 'high'
srcL : Source series to look for pivot lows. By default 'low'
colorLine : Color of the Zigzag Line. By default Fuchsia
widthLine : Width of the Zigzag Line. By default 4
Returns: Zigzag printed on screen
divergence(h2, l2, h1, l1, length) Calculates divergences between 2 series
Parameters:
h2 : Series in which to locate divs: Highs
l2 : Series in which to locate divs: Lows
h1 : Series in which to locate pivots: Highs. By default high
l1 : Series in which to locate pivots: Lows. By default low
length : Length used to calculate Pivots: By default 10
Returns:

Zig Zag(auto Horizon lines)A guy who automatically draws a horizon from the top of the zigzag
*Gray horizon may be repainted
The horizon of the characteristic price in the past reacts well, so it is used for contrarian
ジグザクの頂点から、自動で水平線を引く奴です
※灰色の水平線はリペイントする可能性があります
過去の特徴的な価格の水平線はよく反応するので、逆張りするとかが用途です

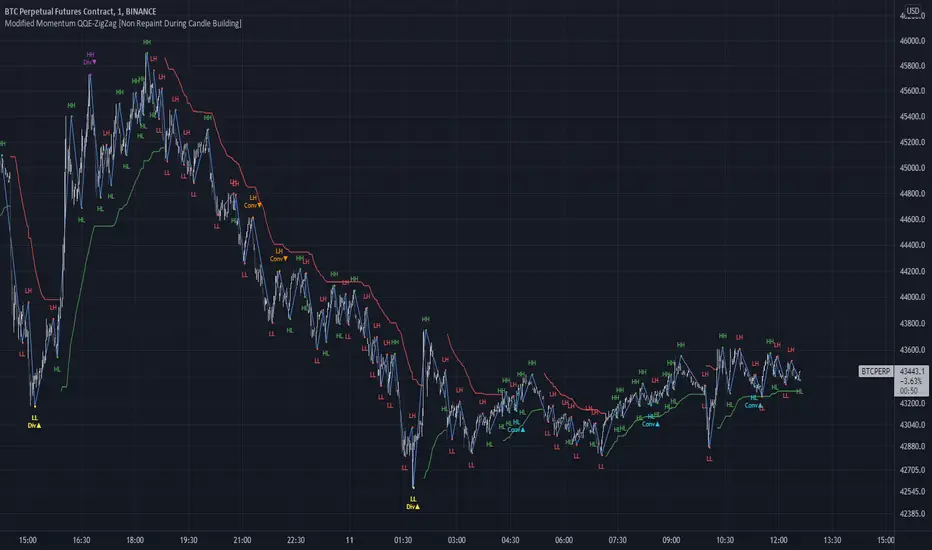
Modified QQE-ZigZag [Non Repaint During Candle Building]V V V V V V V Please Read V V V V V V V
I ask Peter and he is fine, that im published this script
Tell me if you have some ideas or criticism about that sricpt
>>>>>>>>>> This is a modified Version of Peter_O's Momentum Based ZigZag <<<<<<<<<<<
This is only a test, and i want to share it with the community
It works like other ZigZags
Because Peters_O's original Version is only non repaint on closed historical Data ,
during a Candle building process it can still repaint (signal appears / 21 seconds later signal disapears / 42 seconds later signal appears again in the same candle / etc.),
but that isnt important for backtesting, its only important for realtime PivotPoints during a candle.
My goal for this zigzag was to make it absolute non repaint neither during a candle building process (current candle),
so once the signal is shown there is no chance that it disapers and shown a few seconds later again on that same candle, it can only show up one time per candle an thats it,
and that makes it absolute non repaint in all time frames.
Credits to:
==> Thanks to @glaz , for bringing the QQE to Tradingview <3
==> Thanks to @Peter_O , for sharing his idea to use the QQE as base for a Zigzag
and for sharing his MTF RSI with the Community <3
Changes:
- I changed the MTF RSI a little bit, you can choose between two version
- I changed the QQE a little bit, its now using the MTF RSI , and its using High and Low values as Source to make it absolute non repaint during a candle is building
- I added a little Divergence Calculation beween price and the MTF RSI that is used for the ZigZag
Colors :
- Green for HH / HL Continuation
- Red for LL / LH Continuation
- Yellow for Positive Divergence
- Purple for Negative Divergence
Important:
It is not possible to backtest this script correctly with historical Data, its only possible in Realtime,
because the QQE is using crossunders with RSILowSource and the QQE Line to find the Tops and,
because the QQE is using crossovers with RSIHighSource and the QQE Line to find the Bottoms,
and that means it is not possible to find the correct Time/Moment when that crossovers / crossunders happens in historical Data
=============> So please be sure you understand the Calculation and Backtest it in Realtime when you want to use it,
because i didn't published this script for real trading
=============> Im not a financial advisor and youre using this script at your own risk
=============> Please do your own research
Cyclic RSI High Low With Noise Filter█ OVERVIEW
This indicator displays Cyclic Relative Strength Index based on Decoding the Hidden Market Rhythm, Part 1 written by Lars von Thienen.
To determine true or false for Overbought / Oversold are unnecessary, therefore these should be either strong or weak.
Noise for weak Overbought / Oversold can be filtered, especially for smaller timeframe.
█ FEATURES
Display calculated Cyclic Relative Strength Index.
Zigzag high low based on Cyclic Relative Strength Index.
Able to filter noise for high low.
█ LEGENDS
◍ Weak Overbought / Oversold
OB ▼ = Strong Overbought
OS ▲ = Strong Oversold
█ USAGE / TIPS
Recommend to be used for Harmonic Patterns such as XABCD and ABCD.
Condition 1 (XABCD) : When ▼ and ▲ exist side by side, usually this outline XA, while the next two ◍ can be BC.
Condition 2 (ABCD) : When ▼ and ▲ exist side by side, usually this outline AB, while the next one ◍ can be BC, strong ABCD.
Condition 3 (ABCD) : When ▼ or ▲ exist at Point A, the next two ◍ can be Point B and Point C, medium ABCD.
Condition 4 (ABCD) : When ◍ exist at Point a, the next two ◍ can be Point b and Point c, weak ABCD usually used as lower case as abcd.
█ CREDITS
LoneSomeTheBlue
WhenToTrade

ZigZag WavesHello All,
I am here with a new idea and script, " Zigzag Waves ". This indicator creates 3 Zigzags with different lengths, keeps the lengths of each zigzag wave and calculates/draws average waves for each zigzag. optionally it can reset the wave when zigzag direction changes and new highest/lowest found. And optionally it draws Exponential Moving Average(EMA) of the sum of waves. This idea is very new and at the moment there is no optimization for the Zigzag Periods. Maybe we altogether can improve the idea and find the best zigzag periods for different symbols and time frames.
Using the options You can play with the periods, add/remove EMA, set its color and reset the waves on new Highest/Lowest. As far as I see resetting the waves on new Highest/Lowest may bring better results.
if we enable "Reset the waves on new Highest/Lowest":
Using different periods and EMA length:
P.S. if you have ideas to improve this script, drop a comment under the script please.
Enjoy!

Intraday Grid trading exampleHello everyone,
This was a grid trading example for intraday trading.
Please be advised that every commodity have diferent kind of reaction and rate of change between periods therefore the percentages need to be adjusted acording to the commodities change %.
In order to specify the adjustment rate we add the Zig Zag in the script.
For Example ;
Last 3 days zigzag high points are %25 , %13 and %8 , the average %is about %9 therefore you have to put the adjustment ratios something like;
Z%1 = %3
Z%2 = %6
Z%3 = %9
Feel free to use the script with caution( it was not a investment advice), this was only a example of grid trading strategy on our trading platform.
Regards.
FunctionZigZagMultipleMethodsLibrary "FunctionZigZagMultipleMethods"
ZigZag Multiple Methods.
method(idx) Helper methods enumeration.
Parameters:
idx : int, index of method, range 0 to 4.
Returns: string
function(method, value_x, value_y) Multiple method ZigZag.
Parameters:
method : string, default='(MANUAL) Percent price move over X * Y', method for zigzag.
value_x : float, x value in method.
value_y : float, y value in method.
Returns: tuple with:
zigzag float
direction
reverse_line float
realtimeofpivot int

Jeges JigsThis is a combination of all my old indicators, with an added feature for trend lines (inspiration for this came from Wedge Maker script thanks to veryfid, I hope he doesn't mind).
This script looks for a period with increased volatility , as measured by ATR ( Average True Range ), then it looks for a high or a low in that area.
When price is above EMA (400 is default, can be changed), it looks for the highs and adds multiples of ATR to the high. Default values for multipliers are 3,9 and 27, meaning that the script will show 3xATR level above the high, 9xATR above the high and 27xATR above the high.
When price is below EMA it looks for the lows and subtracts multiples of ATR from the low.The script will show 3xATR level below the low, 9xATR below the low and 27xATR below the low.
Multipliers values can be changed as well, making it a versatile tool that shows potential levels of suppport/resistance based on the volatility .
Possible use cases:
Breakout trading, when price crosses a certain level, it may show potential profit targets for trades opened at a breakout.
Stoploss helper. Many traders use ATR for their stoplosses, 1 ATR below the swing low for long trades and 1 ATR above the swing high for short trades are common values used by many traders. In this case, the Lookback value comes handy, if we want to look maybe at a more recent value for swing high/low point.
It highlights ATR peaks, it also displays Bollinger bands of SMA400 (or Ema), breakouts for upper/lower bands.
Another thing you get is Parabolic SAR and Zigzag based on SAR.
ZigZag reSampledthis indicator looks like the default ZigZag indicator but it uses the price action instead of the deviation%