Auto Harmonic Pattern - UltimateX [Trendoscope]IMPORTANT NOTE: (Read this before looking at any other thing on this indicator)
This indicator is created to supersede existing Auto-Harmonic-Pattern-Ultimate-Trendoscope invite only script. The script deviates a lot from the original Auto Harmonic Patterns Ultimate script in terms of number of available patterns, trading type and few other things. Hence, instead of updating the existing script, we have just decided to release as new script. Few FAQs in this regard are as below
What it means for users of AHPU and new users?
▶ Subscription of this script is not sold separately, but will be offered along with existing AHPU script. Meaning, there will be single subscription for both scripts together.
▶ All existing subscribers of AHPU will also get access to this script for the duration of their subscription term. Will start adding access to users starting from lifetime subscribers first.
▶ Any new subscriptions to AHPU will also get access to both the scripts together. We will eventually look to phase out existing AHPU once users are accustomed to new script and any possible bugs are resolved.
▶ Any trial requests will also get access to both scripts. You can request trial even if you have recently requested trial for AHPU.
Why did we create new script instead of updating the existing one?
▶ As mentioned before, this script deviates a lot from the original AHPU. Hence, it is released as new version to make sure smoother transition of users. If anyone is not comfortable using the new version, they can continue using the existing AHPU script until things settle down.
▶ Since the script is new implementation, it may also have initial bugs. It will help us resolve it in more streamlined way.
What are the main differences between these scripts?
▶ Uses single zigzag instead of multi as algorithm is further improved to detect almost everything using single zigzag.
▶ More number of patterns added. But, new patterns are disabled by default as some of them have very wide PRZ. Users can enable it via settings.
▶ Trading type with trailing entry - With wide PRZs, we also had to implement different method for calculating entry/stop. This is explained later in the script.
▶ Matrix implementation and enhanced stats - Entire implementation is redesigned to use matrix data structure instead of arrays. This allows lots of possibilities including enhanced closed trade stats.
▶ Support/Resistance widget is removed as it is proving to be bit of overhead. Users can make use of Support Resistance widget script which is a free to use script instead.
Let's get to the details of indicator now.
🎲 Indicator Components
🎯 Patterns Covered
● Classic Patterns
Gartley
Bat
Butterfly
Crab
Deep Crab
Cypher
Shark
Nenstar
● Anti/Alternate Patterns
Anti Nenstar
Anti Shark
Anti Cypher
Anti Crab
Anti Butterfly
Anti Bat
Anti Gartley
Navarro200
● Non-Standard Patterns (Disabled by default)
Five Zero
Three Drives
White Swan
Black Swan
Sea Pony
Leonardo
121
Snorm
Total
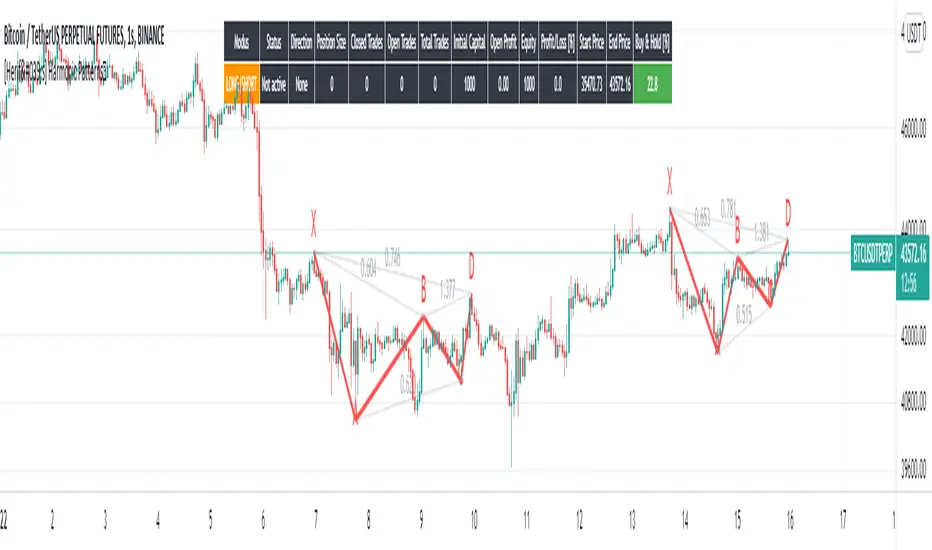
Below is a quick snapshot of indicator components.
Now, lets look at some of the individual components:
🎯 Open trade stats helps recognise trades in motion.
Apart from regular stats, it also contain different types of risk reward ratios.
Regular RR : RR calculated from entry to reach target with initial stop for risk consideration
Trailing RR : This is RR calculated for price to reach from one target to next target considering trailing stop for calculating risk
Live RR : This is calculated based on current price as entry and with given targets and stop levels. Live RR will be blank for targets which are already reached.
Targets are calculated only when entry is made. Hence, target details are not shown for patterns where it is still awaiting entry.
🎯 Closed trade stats helps understand historical performance of patterns.
By default closed stats are displayed in Compact mode. Which means, only total stats are shown. But, users can change this to show detailed stats via settings. Detailed stats take up entire screen most of the time. So, keep them only if it is required.
Closed stats present average Risk Reward, Trailing Risk Reward, Average Win Rate, and Average Trailing Win Rate for all the possible levels. As discussed before.
Regular RR : RR calculated from entry to reach target with initial stop for risk consideration
Trailing RR : This is RR calculated for price to reach from one target to next target considering trailing stop for calculating risk
Win Rate : Simple win rate calculation based on number of patterns reached target and number of valid patterns.
Trailing Win Rate : This is win rate calculated based on previous target to current target.
For example, if there are 48 valid patterns and out of which 24 patterns reach target1 and 12 patterns out of 24 reach target 2
Target1 WR : 50% (24/48)
Target1 TWR : Not applicable as there is no target before Target1
Target2 WR : 25% (12/48)
Target2 TWR : 50% (12/24)
🎲 Settings
Tooltips are provided to help with each and every settings. And they are as below.
🎲 Fully Customisable Alerts - Placeholders
Alerts are created via alert() method of pine. Hence, users will not see message box for alert template on alert widget.
Instead alerts widget look something like this:
To overcome this issue, script provides alert template placeholders as part of settings. In settings, you can already see Alert section where you can enable/disable alerts for different events.
▶ New Pattern Detection
▶ Entry Reached
▶ Target1-4 Reached
▶ Stop price reached
▶ Trade Complete - either by stop or reaching target 4
You can use following placeholders in the given text boxes to create your own alert template.
🎯 Common placeholders which are applicable for all alerts
{type} - Alert Type
- New Harmonic Pattern
- Harmonic Pattern Status Update
- Harmonic Pattern Trade Closure
{id} - Pattern Id. This is not fully unique id. But, this will be unique for all open trades. Once trade is closed, Ids are reused whenever feasible.
{ticker} - Ticker information
{timeframe} - Timeframe information
{price} - Current close price
{patterns} - Possible patterns for the projections or PRZ.
{direction} - Trade direction - Bullish or bearish
{entry} - Calculated entry for pattern
{stop} - Calculated stop for pattern
{tstop} - Trailing stop for the pattern in trade
{target1} - Target1 for pattern in trade
{target2} - Target2 for pattern in trade
{target3} - Target3 for pattern in trade
{target4} - Target4 for pattern in trade
🎯 There are few specific placeholders, which are applicable for some alert types.
Harmonic Pattern Status Update
{status} - Status of the Pattern in trade
{laststatus} - Previous status of the Pattern in trade
Harmonic Pattern Trade Closure
{result} - Trade result upon closure
Penunjuk Pine Script®Skrip berbayar