OPEN-SOURCE SCRIPT
RSI.Trend
Context
The Relative Strength Index (RSI) is one of the most widely used classical indicators in technical analysis, typically employed to identify overbought or oversold market conditions. It reflects the degree of upside or downside dominance within a specified period. However, in its standard form, RSI is not particularly effective as a standalone entry trigger.
The RSI.Trend indicator enhances the RSI to provide a more reliable method for distinguishing between bullish and bearish market regimes and offers specific entry triggers. It adds supplementary value to the pure RSI read.________________________________________
Concept
In trending markets, an Exponential Moving Average (EMA) of the price is often smoother and more stable than raw price data. As a result, the RSI calculated on this smoothed price (i.e., the EMA) tends to react earlier and more consistently than the standard RSI. Specifically:
• In uptrends, the RSI of the EMA tends to exceed the RSI of the original price.
• In downtrends, it tends to lag behind.
The difference between these two RSI readings provides a stable and less noisy measure of market bias—positive in uptrends, negative in downtrends. The crossing points can serve as entry triggers. This is, what the RSI.Trend is trying to capture.
________________________________________
The RSI.Trend indicator operates as follows:
• It first computes the 5-period EMA of the price series of the underlying ("EMA5").
• It calculates the 14-period RSI of the original price series ("RSI") as well as the 14-period RSI of EMA5 ("RSIEMA").
• It then determines the 14-period EMA of RSI ("RSI.MA") and RSIEMA ("RSIEMA.MA").
These values are used to define a Baseline and a Trigger Line:
• Baseline: The average of RSI and RSI.MA.
• Trigger Line: The average of RSIEMA and RSIEMA.MA.
Essentially, the baseline represents a smoother version of the RSI of the original price series, while the trigger line is a smoother version of the RSI on the EMA5 of the original price series.
Additionally, the RSI.Trend Background Value is calculated as the difference between the Trigger Line and the Baseline, slightly accelerated by incorporating the current bias of this difference. This acceleration causes the Background Value to react somewhat faster than the pure difference between the two lines.
How to use the RSI.Trend:
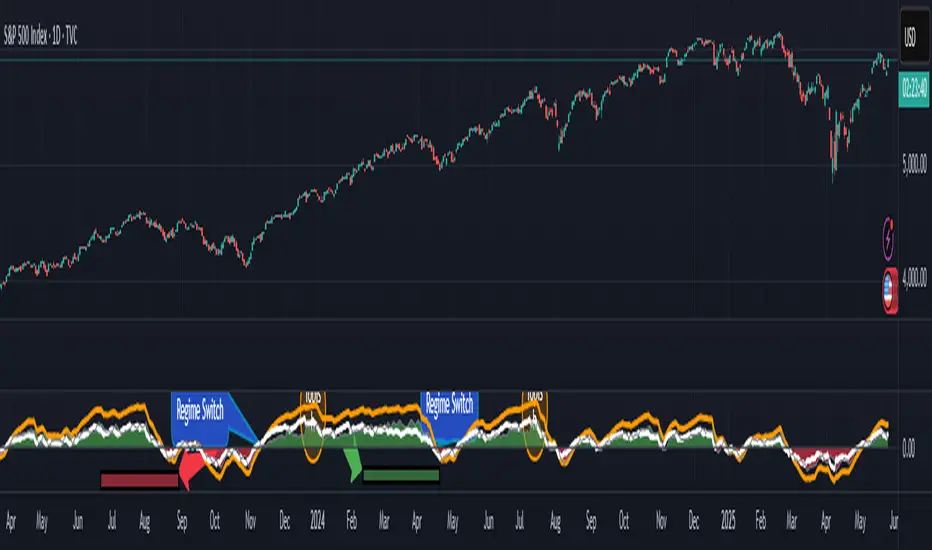
• As mentioned in the introductory context, during uptrends, the trigger line remains above the baseline; in downtrends, it stays below the baseline.
• A crossover of the baseline by the trigger line indicates a regime shift from bearish to bullish and can signal avoiding adding short positions, closing short positions, or adding long positions.
• A crossunder of the baseline by the trigger line indicates a regime shift from bullish to bearish and can signal avoiding adding long positions, closing long positions, or adding short positions.
• The level of the Trigger Line can serve as a confidence indicator; for instance, if the trigger line crosses under the baseline coming from very high values, it implies high confidence.
• The Background Value indicates the accelerated difference between the two lines:
o > 0 (Green background): Indicates a Bullish regime.
o < 0 (Red background): Indicates a Bearish regime.
The Background Value reacts slightly faster than line crossings due to its acceleration relative to the difference of the two lines.
Including these lines in the script besides the Background Value, provides insight into their levels and their origins, aiding in formulating confidence in an entry trigger, which the background value alone cannot provide. The change in slope of the trigger Line can also be used as an early and fast position-trigger.
Finally, the Background Value can be utilized in continuous trading scenarios (i.e., no entry points, always engaged) as a multiplier on a predefined max-exposure value, representing the current exposure as a fraction of that max-exposure.
The usage of RSI.Trend is also exemplified in the introductory chart.________________________________________
Final Notes
As with all indicators, the RSI.Trend is most effective when used in conjunction with other technical tools and market context. It does not predict future price movements; rather, it reflects current market dynamics and recent directional tendencies. Use it with discretion and as part of a broader trading strategy.
The Relative Strength Index (RSI) is one of the most widely used classical indicators in technical analysis, typically employed to identify overbought or oversold market conditions. It reflects the degree of upside or downside dominance within a specified period. However, in its standard form, RSI is not particularly effective as a standalone entry trigger.
The RSI.Trend indicator enhances the RSI to provide a more reliable method for distinguishing between bullish and bearish market regimes and offers specific entry triggers. It adds supplementary value to the pure RSI read.________________________________________
Concept
In trending markets, an Exponential Moving Average (EMA) of the price is often smoother and more stable than raw price data. As a result, the RSI calculated on this smoothed price (i.e., the EMA) tends to react earlier and more consistently than the standard RSI. Specifically:
• In uptrends, the RSI of the EMA tends to exceed the RSI of the original price.
• In downtrends, it tends to lag behind.
The difference between these two RSI readings provides a stable and less noisy measure of market bias—positive in uptrends, negative in downtrends. The crossing points can serve as entry triggers. This is, what the RSI.Trend is trying to capture.
________________________________________
The RSI.Trend indicator operates as follows:
• It first computes the 5-period EMA of the price series of the underlying ("EMA5").
• It calculates the 14-period RSI of the original price series ("RSI") as well as the 14-period RSI of EMA5 ("RSIEMA").
• It then determines the 14-period EMA of RSI ("RSI.MA") and RSIEMA ("RSIEMA.MA").
These values are used to define a Baseline and a Trigger Line:
• Baseline: The average of RSI and RSI.MA.
• Trigger Line: The average of RSIEMA and RSIEMA.MA.
Essentially, the baseline represents a smoother version of the RSI of the original price series, while the trigger line is a smoother version of the RSI on the EMA5 of the original price series.
Additionally, the RSI.Trend Background Value is calculated as the difference between the Trigger Line and the Baseline, slightly accelerated by incorporating the current bias of this difference. This acceleration causes the Background Value to react somewhat faster than the pure difference between the two lines.
How to use the RSI.Trend:
• As mentioned in the introductory context, during uptrends, the trigger line remains above the baseline; in downtrends, it stays below the baseline.
• A crossover of the baseline by the trigger line indicates a regime shift from bearish to bullish and can signal avoiding adding short positions, closing short positions, or adding long positions.
• A crossunder of the baseline by the trigger line indicates a regime shift from bullish to bearish and can signal avoiding adding long positions, closing long positions, or adding short positions.
• The level of the Trigger Line can serve as a confidence indicator; for instance, if the trigger line crosses under the baseline coming from very high values, it implies high confidence.
• The Background Value indicates the accelerated difference between the two lines:
o > 0 (Green background): Indicates a Bullish regime.
o < 0 (Red background): Indicates a Bearish regime.
The Background Value reacts slightly faster than line crossings due to its acceleration relative to the difference of the two lines.
Including these lines in the script besides the Background Value, provides insight into their levels and their origins, aiding in formulating confidence in an entry trigger, which the background value alone cannot provide. The change in slope of the trigger Line can also be used as an early and fast position-trigger.
Finally, the Background Value can be utilized in continuous trading scenarios (i.e., no entry points, always engaged) as a multiplier on a predefined max-exposure value, representing the current exposure as a fraction of that max-exposure.
The usage of RSI.Trend is also exemplified in the introductory chart.________________________________________
Final Notes
As with all indicators, the RSI.Trend is most effective when used in conjunction with other technical tools and market context. It does not predict future price movements; rather, it reflects current market dynamics and recent directional tendencies. Use it with discretion and as part of a broader trading strategy.
Skrip sumber terbuka
Dalam semangat TradingView sebenar, pencipta skrip ini telah menjadikannya sumber terbuka, jadi pedagang boleh menilai dan mengesahkan kefungsiannya. Terima kasih kepada penulis! Walaupuan anda boleh menggunakan secara percuma, ingat bahawa penerbitan semula kod ini tertakluk kepada Peraturan Dalaman.
parsifaltrading
Penafian
Maklumat dan penerbitan adalah tidak bertujuan, dan tidak membentuk, nasihat atau cadangan kewangan, pelaburan, dagangan atau jenis lain yang diberikan atau disahkan oleh TradingView. Baca lebih dalam Terma Penggunaan.