ES Bundle
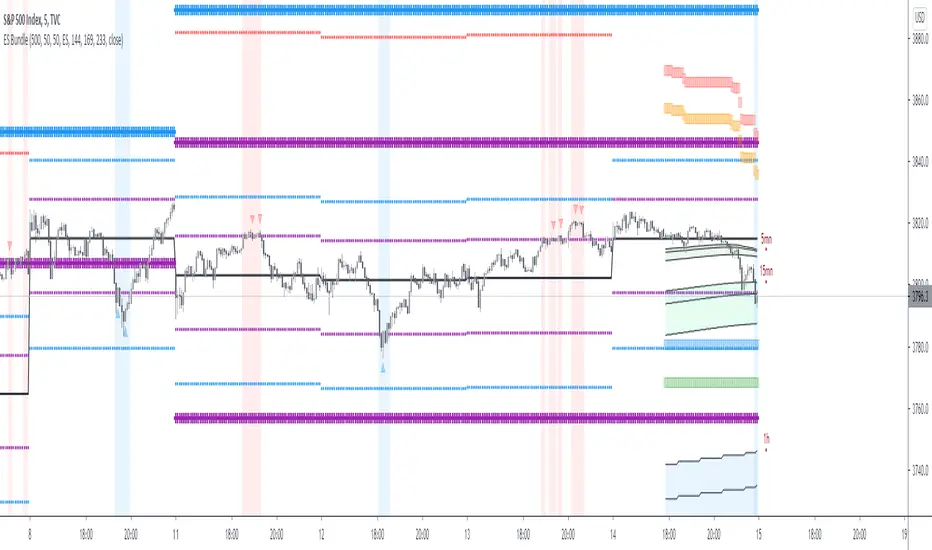
It is a simulation of marker behavior resulting in 2 kind of level:
Oversold and overbougth level:
* It is square shape: orange and red are 1st and 2nd level of Overbougth ( high probability to down of 16 points if you have a bearish divergence of momemtum above these levels)
* It is square shape:blue and green are 1st and 2nd level of Overbougth ( high probability to upof 16 points if you have a bullish divergence of momemtum above these levels)
*In case of crazy market rend (10% of the time, only small reversal is expected but more often than not momemtum will not plot divergence)
Level of support and resistance
*There is 2 size ( cross shaped pattern), the small is for daily timeframe and the large is for weekly timeframe
*Purple line is the fiest and weakest area of resistance or support
*Blue cross is and interesting level, if momemtum plot divergence above blue resistance or below bull support it is time to search for short or long respectivly
*Red line is when crazy market happen, every divergence above or below red line is a major trade reversal
Obviously if you are on support level + under oversold zone it is the best setup to long and vice versa
*Adding Bundle for GC, CL, SPX, BTC and VIX
* Adding FIlter for signal ( red and blue triangle)
*All signal must be filtered by divergence on momemtum reader (see indicator on tradingview)
Skrip jemputan sahaja
Hanya pengguna yang diberikan kebenaran oleh penulis mempunyai akses kepada skrip ini dan ini selalunya memerlukan pembayaran. Anda boleh menambahkan skrip kepada kegemaran anda tetapi anda hanya boleh menggunakannya selepas meminta kebenaran dan mendapatkannya daripada penulis — ketarhui lebih lanjut di sini. Untuk lebih butiran, ikuti arahan penulis di bawah atau hubungi nonobdx secara terus.
TradingView tidak menyarankan pembayaran untuk atau menggunakan skrip kecuali anda benar-benar mempercayai penulisnya dan memahami bagaimana ia berfungsi. Anda juga boleh mendapatkan alternatif sumber terbuka lain yang percuma dalam skrip komuniti kami.
Arahan penulis
Amaran: sila baca panduan kami untuk skrip jemputan sahaja sebelum memohon akses.
discord.gg/b7YGtY2
Site internet: marketreader.fr/
Chaine Youtube : youtube.com/channel/UC-a7p8DkfbDM6ONrTzsaErA?view_as=subscriber
Penafian
Skrip jemputan sahaja
Hanya pengguna yang diberikan kebenaran oleh penulis mempunyai akses kepada skrip ini dan ini selalunya memerlukan pembayaran. Anda boleh menambahkan skrip kepada kegemaran anda tetapi anda hanya boleh menggunakannya selepas meminta kebenaran dan mendapatkannya daripada penulis — ketarhui lebih lanjut di sini. Untuk lebih butiran, ikuti arahan penulis di bawah atau hubungi nonobdx secara terus.
TradingView tidak menyarankan pembayaran untuk atau menggunakan skrip kecuali anda benar-benar mempercayai penulisnya dan memahami bagaimana ia berfungsi. Anda juga boleh mendapatkan alternatif sumber terbuka lain yang percuma dalam skrip komuniti kami.
Arahan penulis
Amaran: sila baca panduan kami untuk skrip jemputan sahaja sebelum memohon akses.
discord.gg/b7YGtY2
Site internet: marketreader.fr/
Chaine Youtube : youtube.com/channel/UC-a7p8DkfbDM6ONrTzsaErA?view_as=subscriber